CountyAtlas California
California County Map with Cities — All 58 Counties
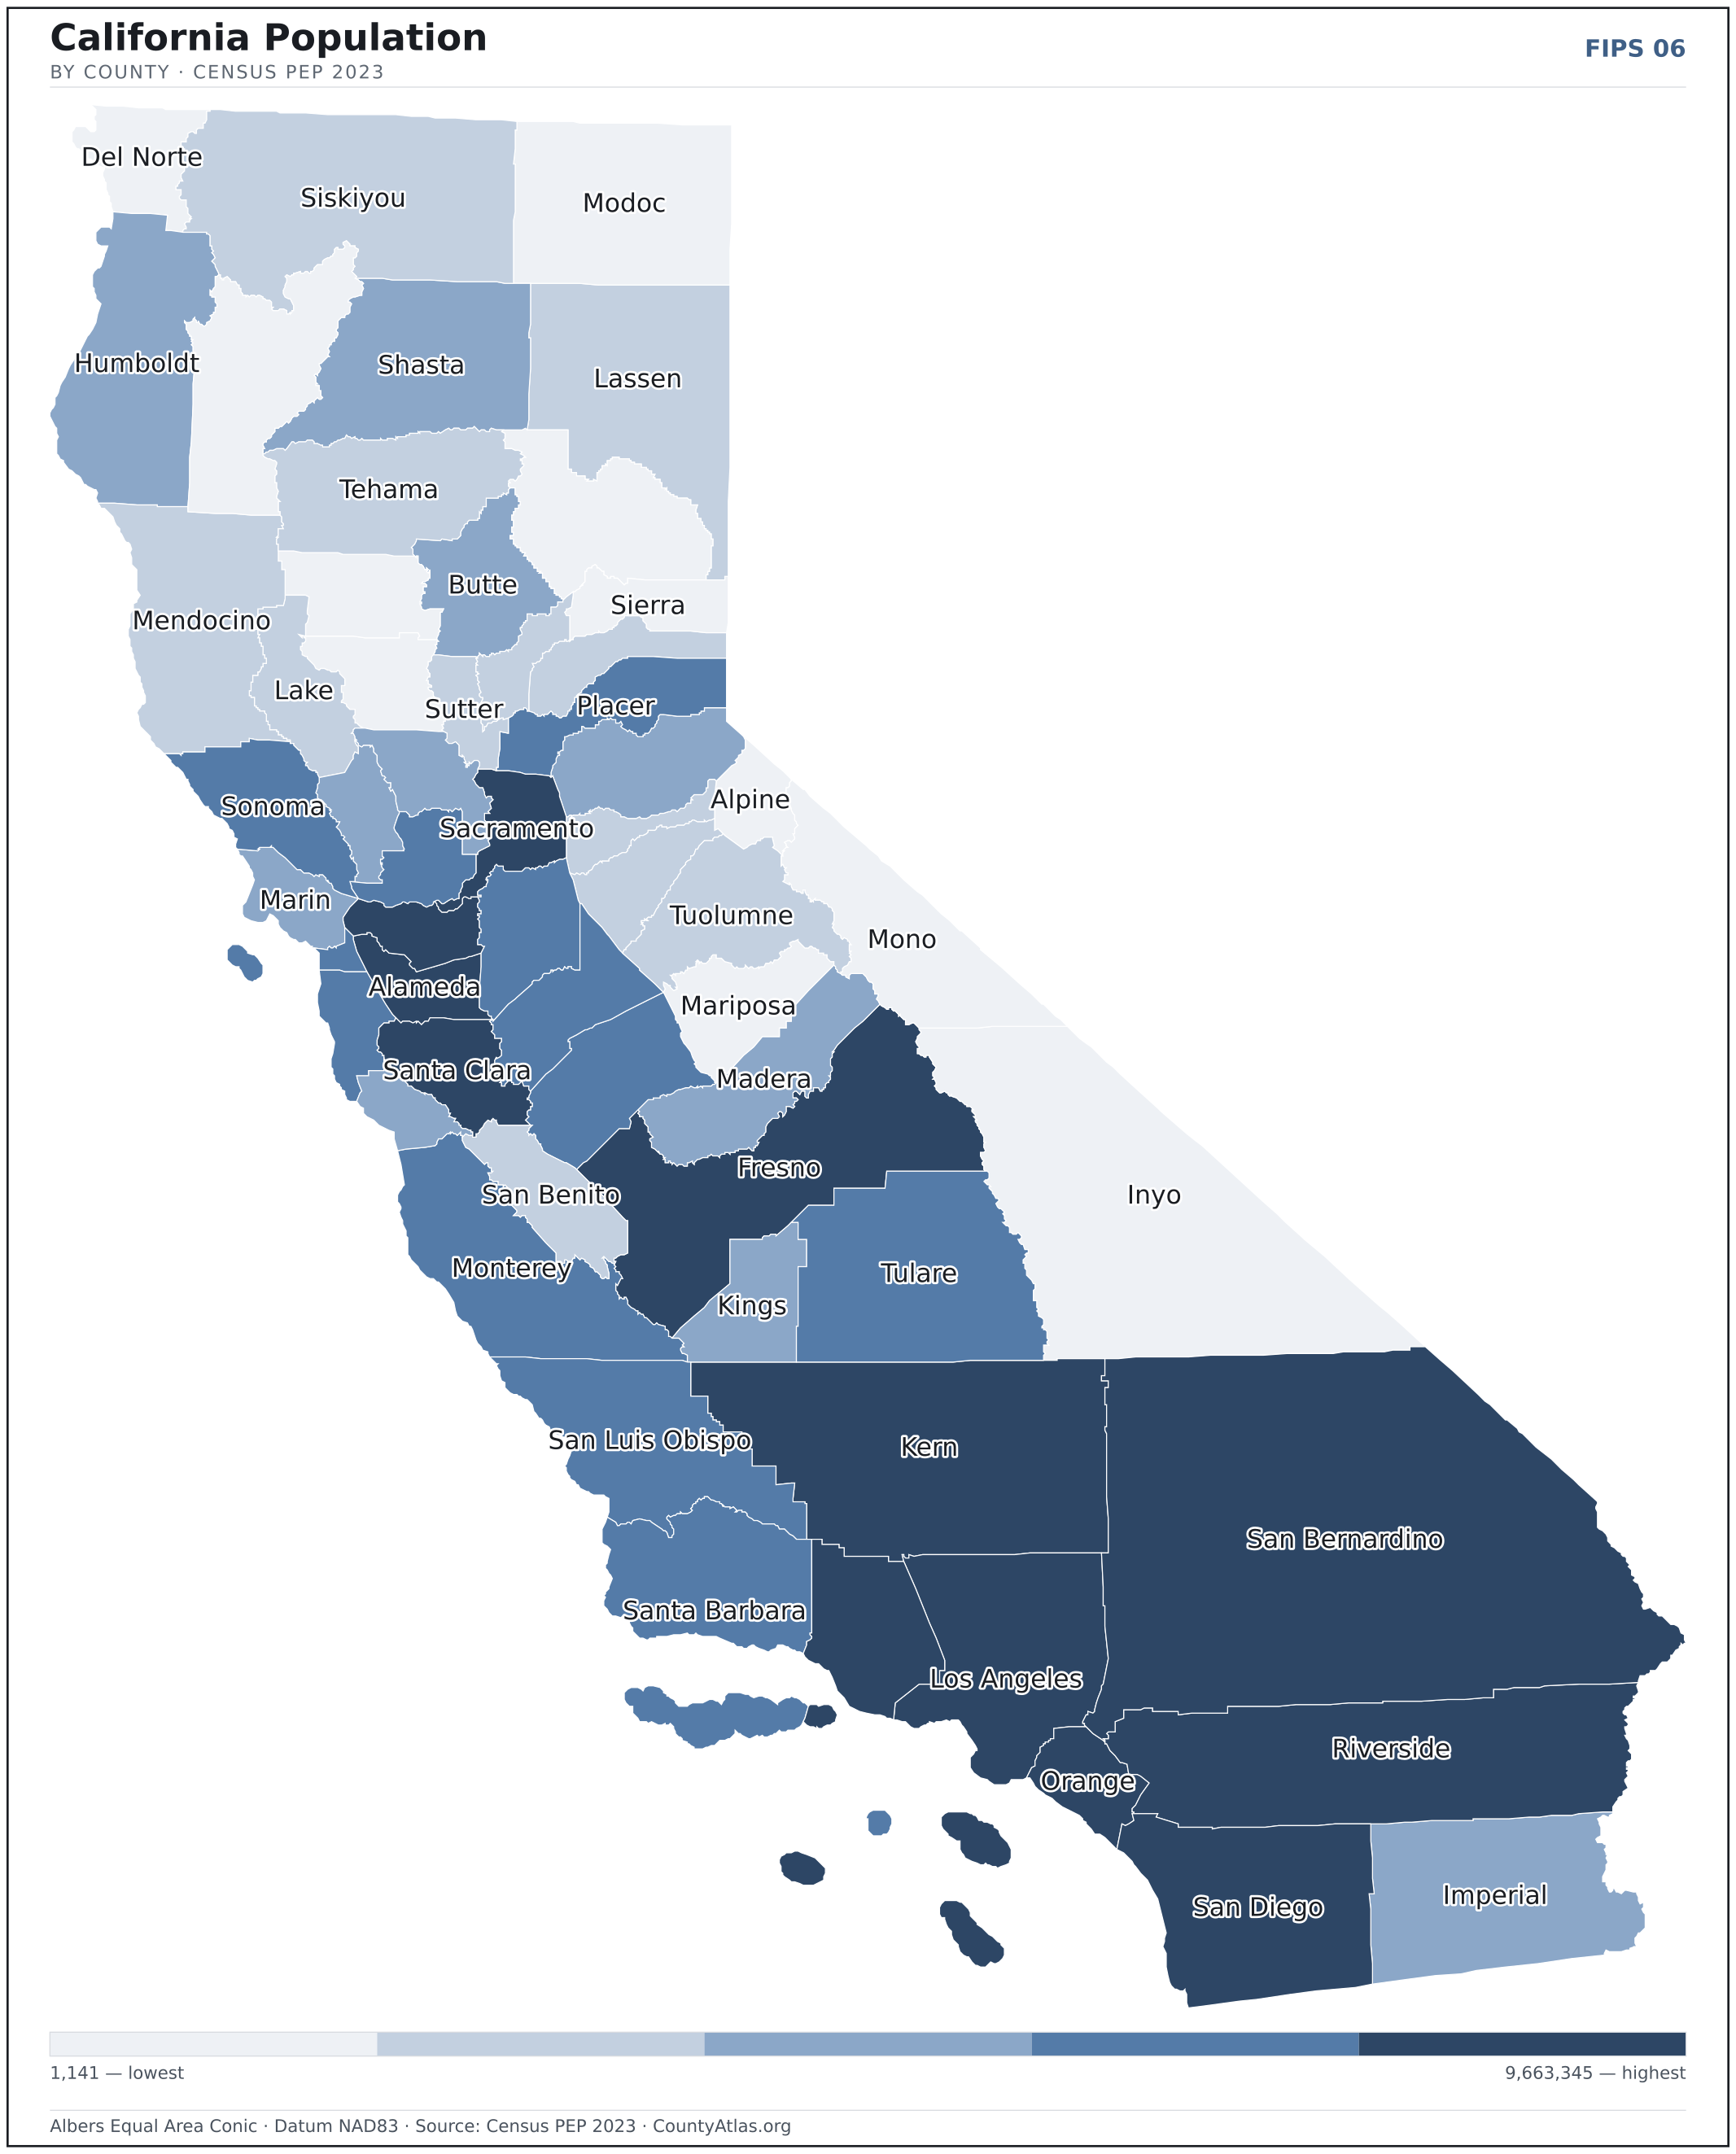
All 58 of California's counties, mapped from official U.S. Census boundaries with population, income, and unemployment for every one. Colour the map by any measure, tap a county for its data, or download a print-ready copy.
Tap any county for its population, income, and more.
California at a glance
- Scale. California is divided into 58 counties across 155,860 sq mi of land — an average of 2,687 sq mi each. Census TIGER
- People. Its counties are home to 38,965,193 residents — an average of 671,814 each, or 250 per square mile statewide. Census PEP 2023
- Water. Another 7,833 sq mi is water — 4.8% of the state’s area, led by Santa Barbara County. Census TIGER
California’s 58 counties, by the numbers
Every county’s population, median household income, unemployment, density, and land area — sortable by any column, so you can find yours or rank by what matters to you. A few patterns run through the data:
- Concentrated. Half of California’s 38,965,193 residents live in just 5 of 58 counties, and the five largest hold 53.3% of the total. Census PEP 2023
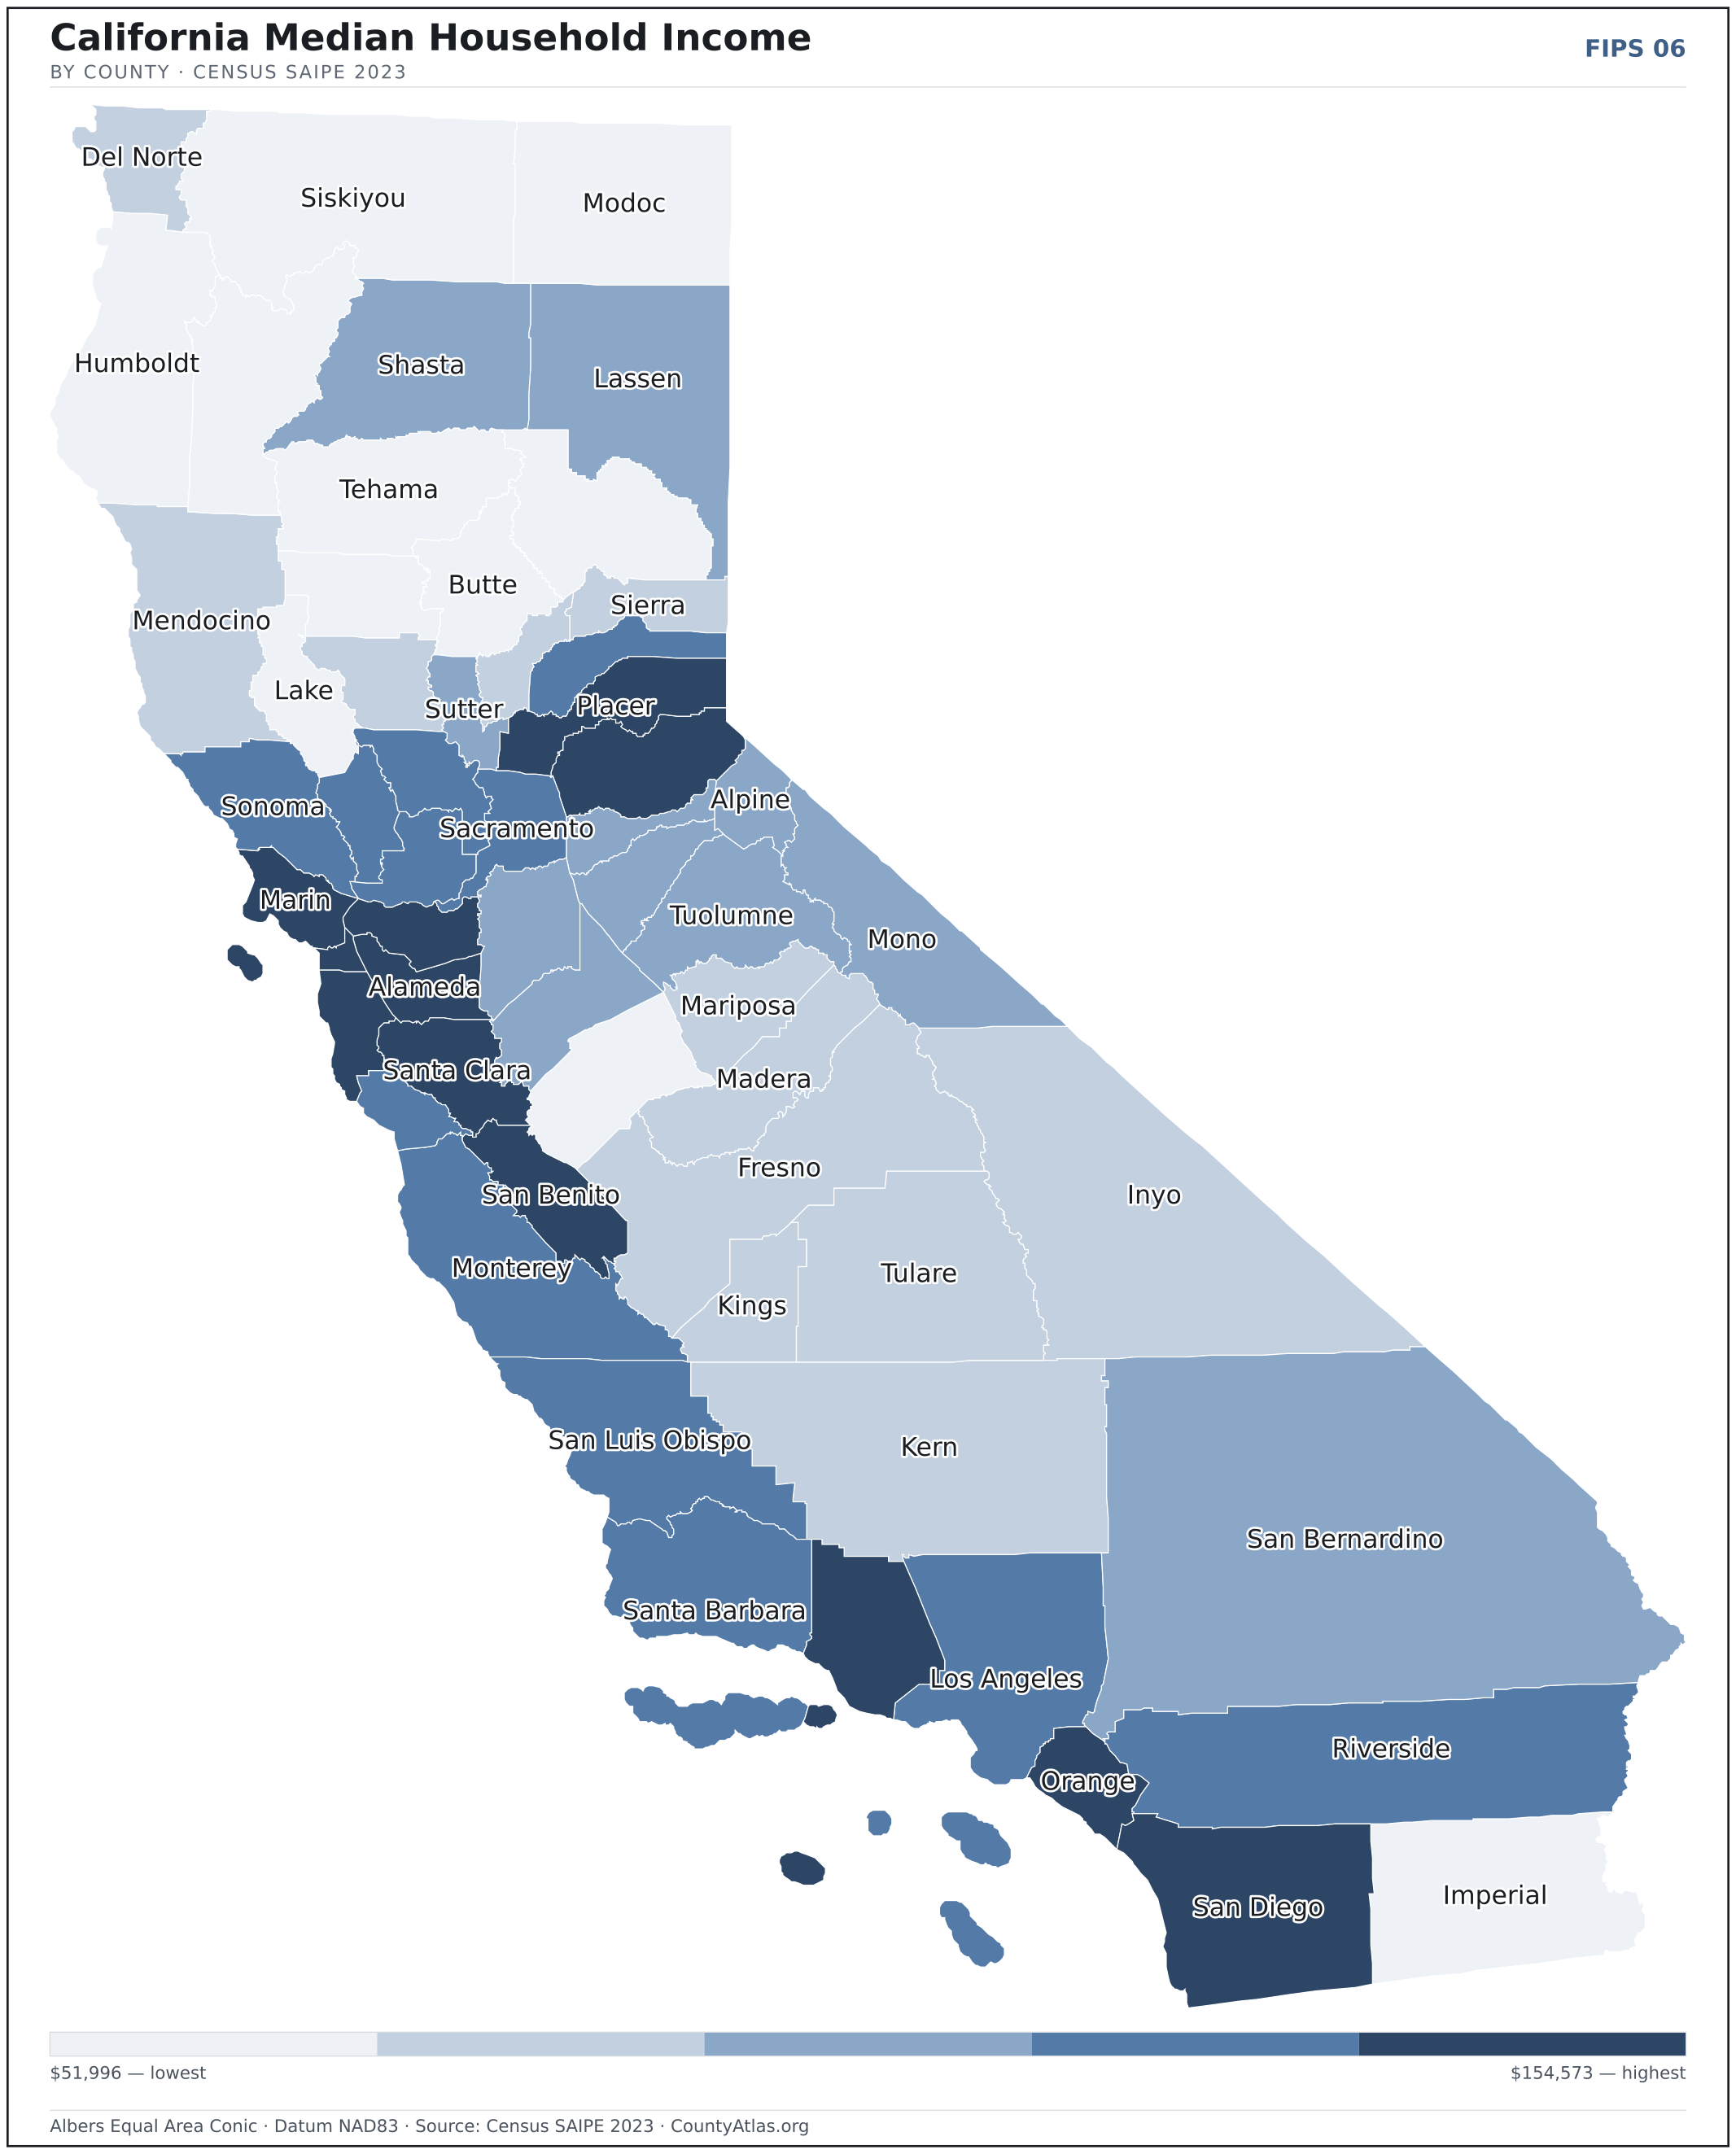
- Income tracks poverty. The gap from richest to poorest runs 3.0×, and the 10 highest-income counties average 8.6% in poverty against 17.6% for the 10 lowest. Census SAIPE 2023
- Mostly small. Half of California’s counties have fewer than 186,291 residents, and half report a median household income below $81,175 — a few metros lift the statewide totals well above both. Census PEP 2023 · SAIPE 2023
- Lopsided density. Only 18 of 58 counties are denser than California’s statewide average of 250 people per square mile — the rest are more rural. Census PEP 2023 · TIGER
| Alameda County | 1,622,188 | $119,230 | 3.8% | 2,200/sq mi | 737 sq mi | Oakland |
| Alpine County | 1,141 | $83,265 | 9.8% | 2/sq mi | 738 sq mi | Markleeville |
| Amador County | 41,811 | $80,767 | 4.9% | 70/sq mi | 595 sq mi | Jackson |
| Butte County | 207,172 | $63,084 | 5.2% | 127/sq mi | 1,637 sq mi | Oroville |
| Calaveras County | 46,565 | $77,041 | 5.4% | 46/sq mi | 1,020 sq mi | San Andreas |
| Colusa County | 22,037 | $66,675 | 11.4% | 19/sq mi | 1,151 sq mi | Colusa |
| Contra Costa County | 1,155,025 | $122,000 | 4.0% | 1,611/sq mi | 717 sq mi | Martinez |
| Del Norte County | 26,589 | $70,231 | 5.6% | 26/sq mi | 1,006 sq mi | Crescent City |
| El Dorado County | 192,215 | $107,063 | 4.2% | 113/sq mi | 1,708 sq mi | Placerville |
| Fresno County | 1,017,162 | $71,271 | 7.4% | 171/sq mi | 5,959 sq mi | Fresno |
| Glenn County | 28,129 | $64,197 | 6.3% | 21/sq mi | 1,314 sq mi | Willows |
| Humboldt County | 133,985 | $61,307 | 4.3% | 38/sq mi | 3,568 sq mi | Eureka |
| Imperial County | 179,057 | $58,768 | 16.9% | 43/sq mi | 4,175 sq mi | El Centro |
| Inyo County | 18,527 | $71,656 | 3.7% | 2/sq mi | 10,197 sq mi | Independence |
| Kern County | 913,820 | $68,436 | 8.3% | 112/sq mi | 8,135 sq mi | Bakersfield |
| Kings County | 152,682 | $65,768 | 8.0% | 110/sq mi | 1,391 sq mi | Hanford |
| Lake County | 67,878 | $57,945 | 6.0% | 54/sq mi | 1,255 sq mi | Lakeport |
| Lassen County | 28,861 | $77,743 | 5.6% | 6/sq mi | 4,541 sq mi | Susanville |
| Los Angeles County | 9,663,345 | $86,499 | 5.2% | 2,380/sq mi | 4,060 sq mi | Los Angeles |
| Madera County | 162,858 | $66,084 | 7.0% | 76/sq mi | 2,137 sq mi | Madera |
| Marin County | 254,407 | $139,197 | 3.4% | 489/sq mi | 520 sq mi | San Rafael |
| Mariposa County | 16,919 | $64,352 | 5.1% | 12/sq mi | 1,449 sq mi | Mariposa |
| Mendocino County | 89,108 | $65,891 | 4.6% | 25/sq mi | 3,507 sq mi | Ukiah |
| Merced County | 291,920 | $58,962 | 8.8% | 151/sq mi | 1,938 sq mi | Merced |
| Modoc County | 8,500 | $51,996 | 5.7% | 2/sq mi | 3,948 sq mi | Alturas |
| Mono County | 13,066 | $82,973 | 3.5% | 4/sq mi | 3,049 sq mi | Bridgeport |
| Monterey County | 430,723 | $86,809 | 5.9% | 131/sq mi | 3,282 sq mi | Salinas |
| Napa County | 133,216 | $100,469 | 3.6% | 177/sq mi | 752 sq mi | Napa |
| Nevada County | 102,037 | $87,142 | 4.2% | 107/sq mi | 958 sq mi | Nevada City |
| Orange County | 3,135,755 | $109,768 | 3.5% | 3,953/sq mi | 793 sq mi | Santa Ana |
| Placer County | 423,561 | $110,020 | 3.6% | 301/sq mi | 1,407 sq mi | Auburn |
| Plumas County | 19,131 | $64,121 | 5.6% | 7/sq mi | 2,553 sq mi | Quincy |
| Riverside County | 2,492,442 | $90,251 | 4.7% | 346/sq mi | 7,209 sq mi | Riverside |
| Sacramento County | 1,584,288 | $89,984 | 4.2% | 1,641/sq mi | 965 sq mi | Sacramento |
| San Benito County | 68,175 | $105,112 | 5.7% | 49/sq mi | 1,389 sq mi | Hollister |
| San Bernardino County | 2,195,611 | $84,576 | 4.6% | 109/sq mi | 20,068 sq mi | San Bernardino |
| San Diego County | 3,269,973 | $103,476 | 3.9% | 777/sq mi | 4,211 sq mi | San Diego |
| San Francisco County | 808,988 | $125,456 | 3.3% | 17,331/sq mi | 47 sq mi | San Francisco |
| San Joaquin County | 800,965 | $86,211 | 5.6% | 575/sq mi | 1,392 sq mi | Stockton |
| San Luis Obispo County | 281,639 | $89,809 | 3.6% | 85/sq mi | 3,301 sq mi | San Luis Obispo |
| San Mateo County | 726,353 | $151,004 | 3.1% | 1,619/sq mi | 449 sq mi | Redwood City |
| Santa Barbara County | 441,257 | $90,155 | 3.7% | 161/sq mi | 2,734 sq mi | Santa Barbara |
| Santa Clara County | 1,877,592 | $154,573 | 3.4% | 1,454/sq mi | 1,291 sq mi | San Jose |
| Santa Cruz County | 261,547 | $102,723 | 5.1% | 588/sq mi | 445 sq mi | Santa Cruz |
| Shasta County | 180,366 | $71,935 | 4.5% | 48/sq mi | 3,776 sq mi | Redding |
| Sierra County | 3,200 | $67,675 | 4.2% | 3/sq mi | 953 sq mi | Downieville |
| Siskiyou County | 42,905 | $58,975 | 6.5% | 7/sq mi | 6,279 sq mi | Yreka |
| Solano County | 449,218 | $99,117 | 4.4% | 547/sq mi | 822 sq mi | Fairfield |
| Sonoma County | 481,812 | $100,157 | 3.7% | 306/sq mi | 1,575 sq mi | Santa Rosa |
| Stanislaus County | 551,430 | $81,582 | 6.4% | 369/sq mi | 1,496 sq mi | Modesto |
| Sutter County | 97,948 | $71,968 | 7.9% | 163/sq mi | 603 sq mi | Yuba City |
| Tehama County | 64,896 | $58,333 | 5.2% | 22/sq mi | 2,949 sq mi | Red Bluff |
| Trinity County | 15,670 | $52,079 | 4.7% | 5/sq mi | 3,179 sq mi | Weaverville |
| Tulare County | 479,468 | $71,368 | 9.5% | 99/sq mi | 4,824 sq mi | Visalia |
| Tuolumne County | 54,204 | $72,329 | 4.8% | 24/sq mi | 2,221 sq mi | Sonora |
| Ventura County | 829,590 | $106,526 | 3.9% | 451/sq mi | 1,841 sq mi | San Buenaventura (Ventura) |
| Yolo County | 220,544 | $91,192 | 4.8% | 218/sq mi | 1,013 sq mi | Woodland |
| Yuba County | 85,722 | $71,493 | 5.9% | 136/sq mi | 632 sq mi | Marysville |
All 58 counties, sortable by any column — click a heading. A suppressed estimate (coefficient of variation ≥ 0.30) shows a marker, never a guess. County seats are from Wikidata (CC0), each validated to a Census place inside its county; a county with no validated seat is left blank. See the methodology.
Download & print this California map
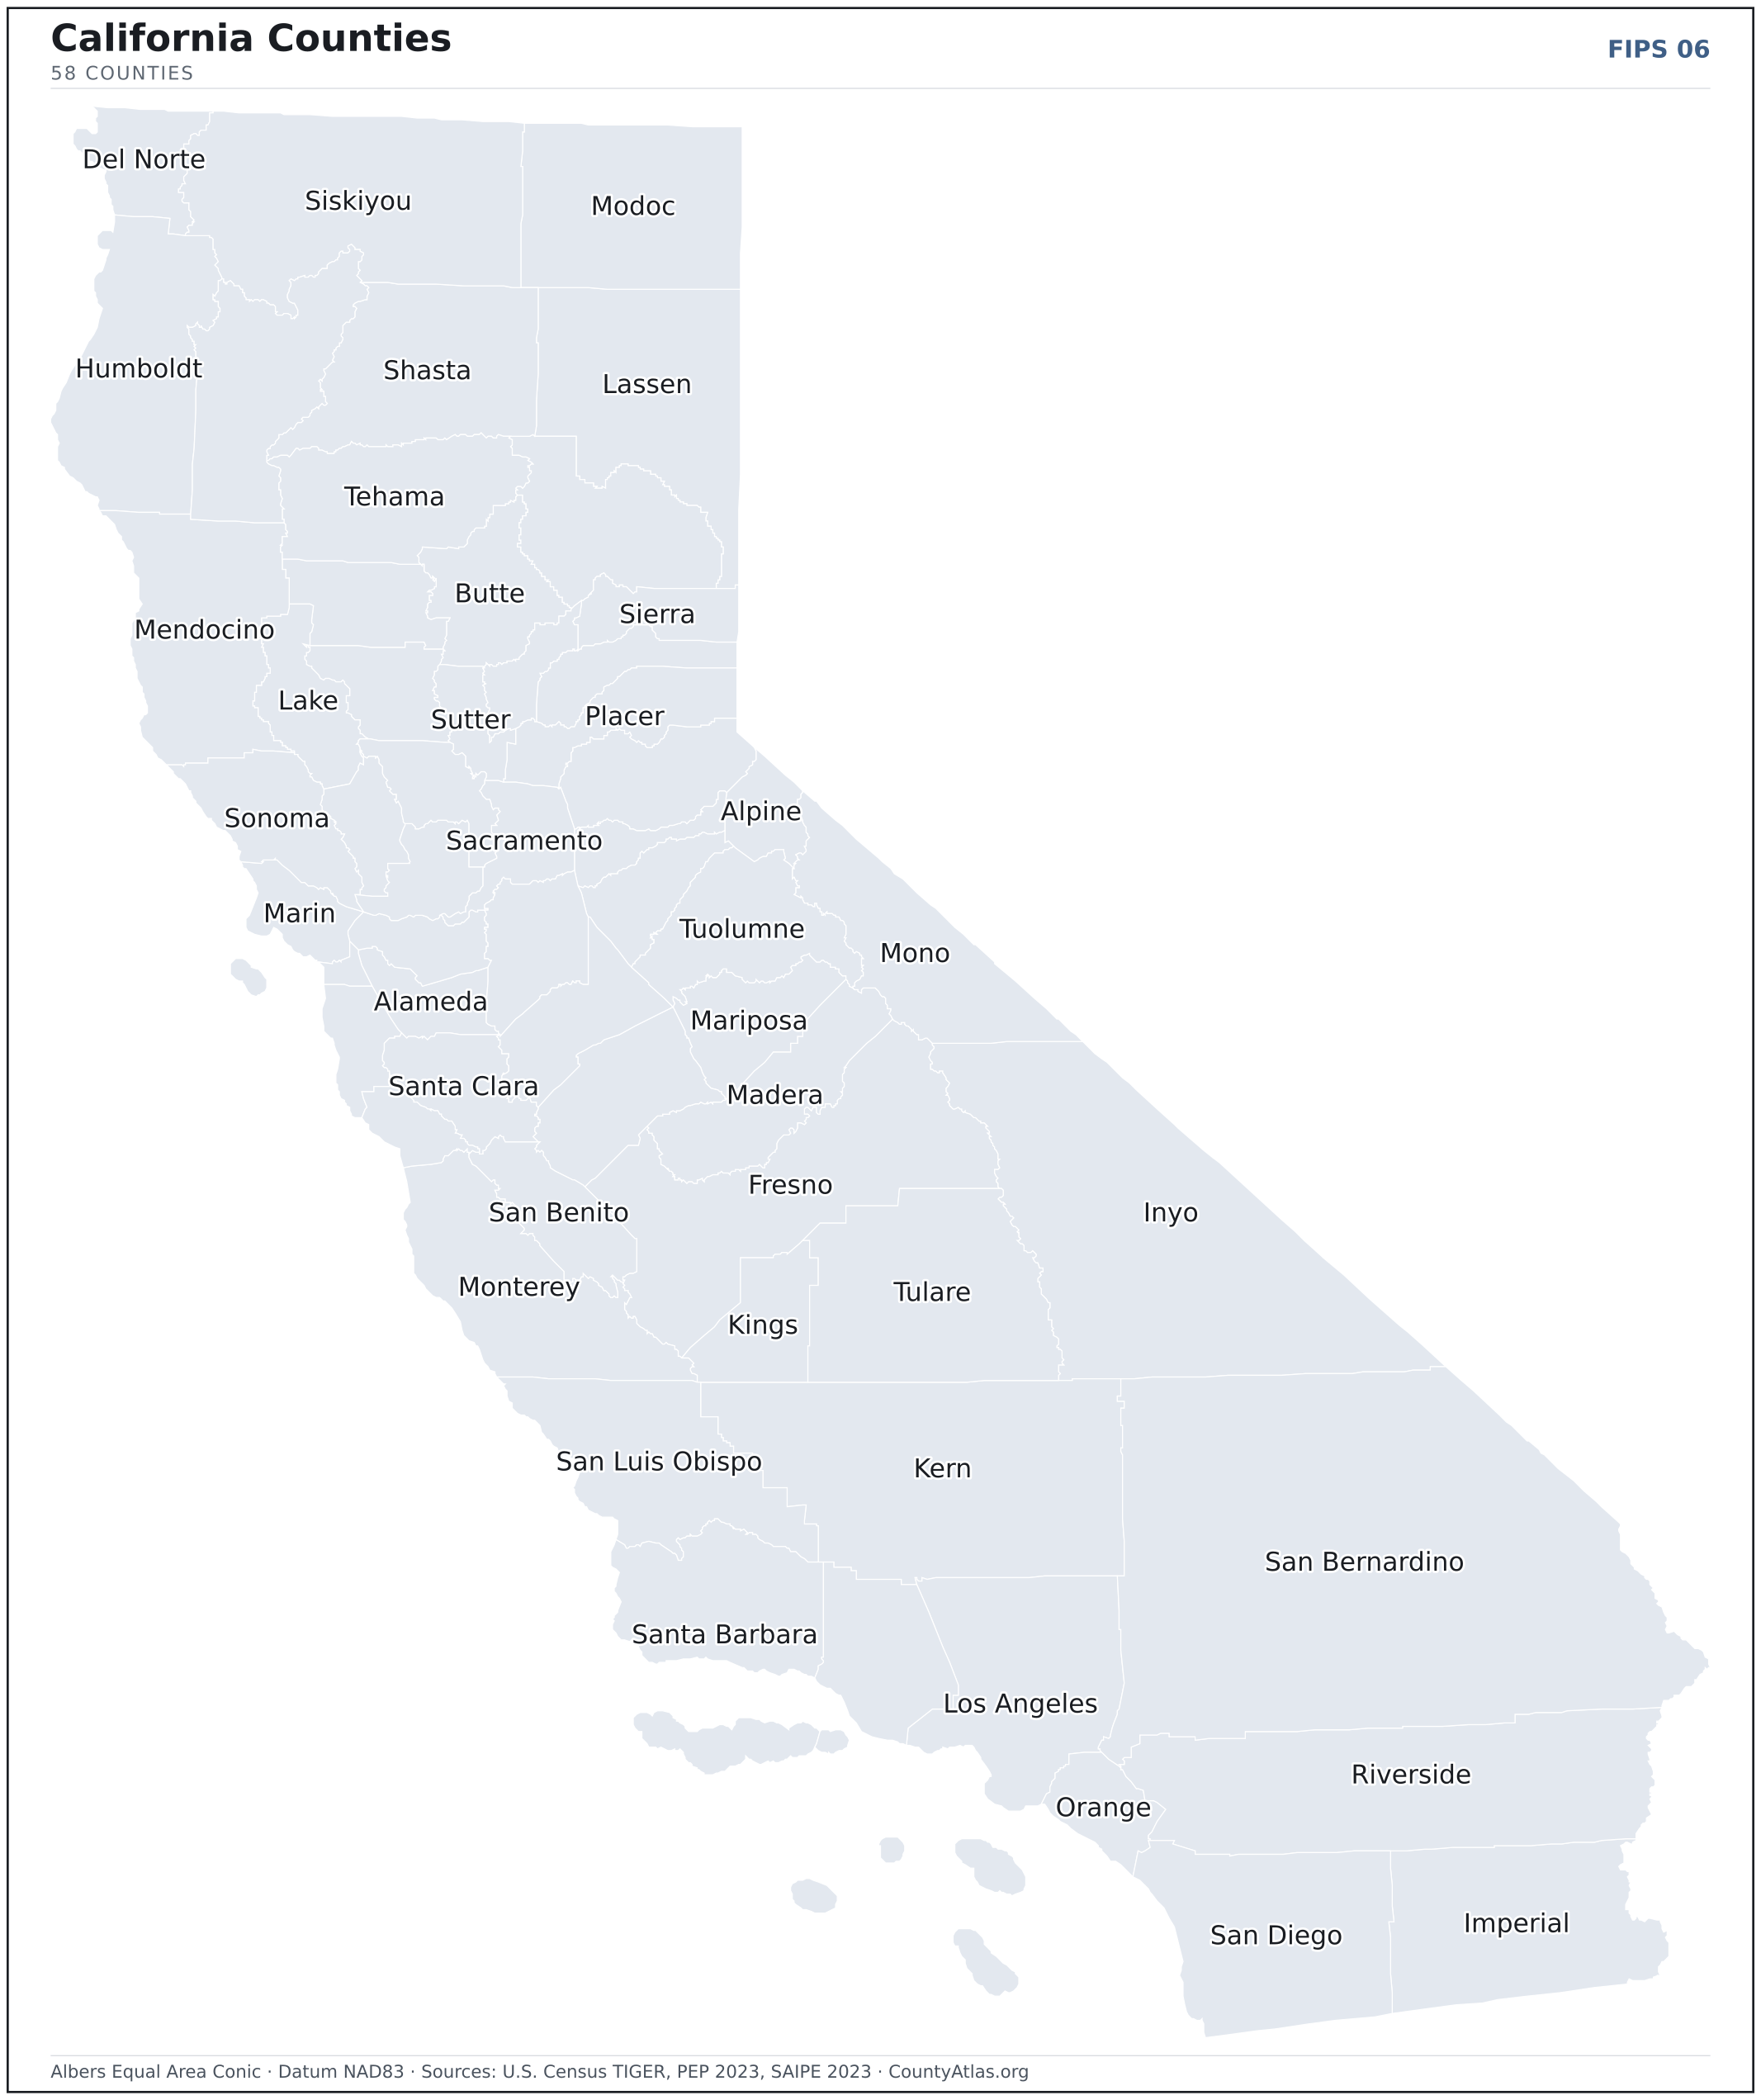
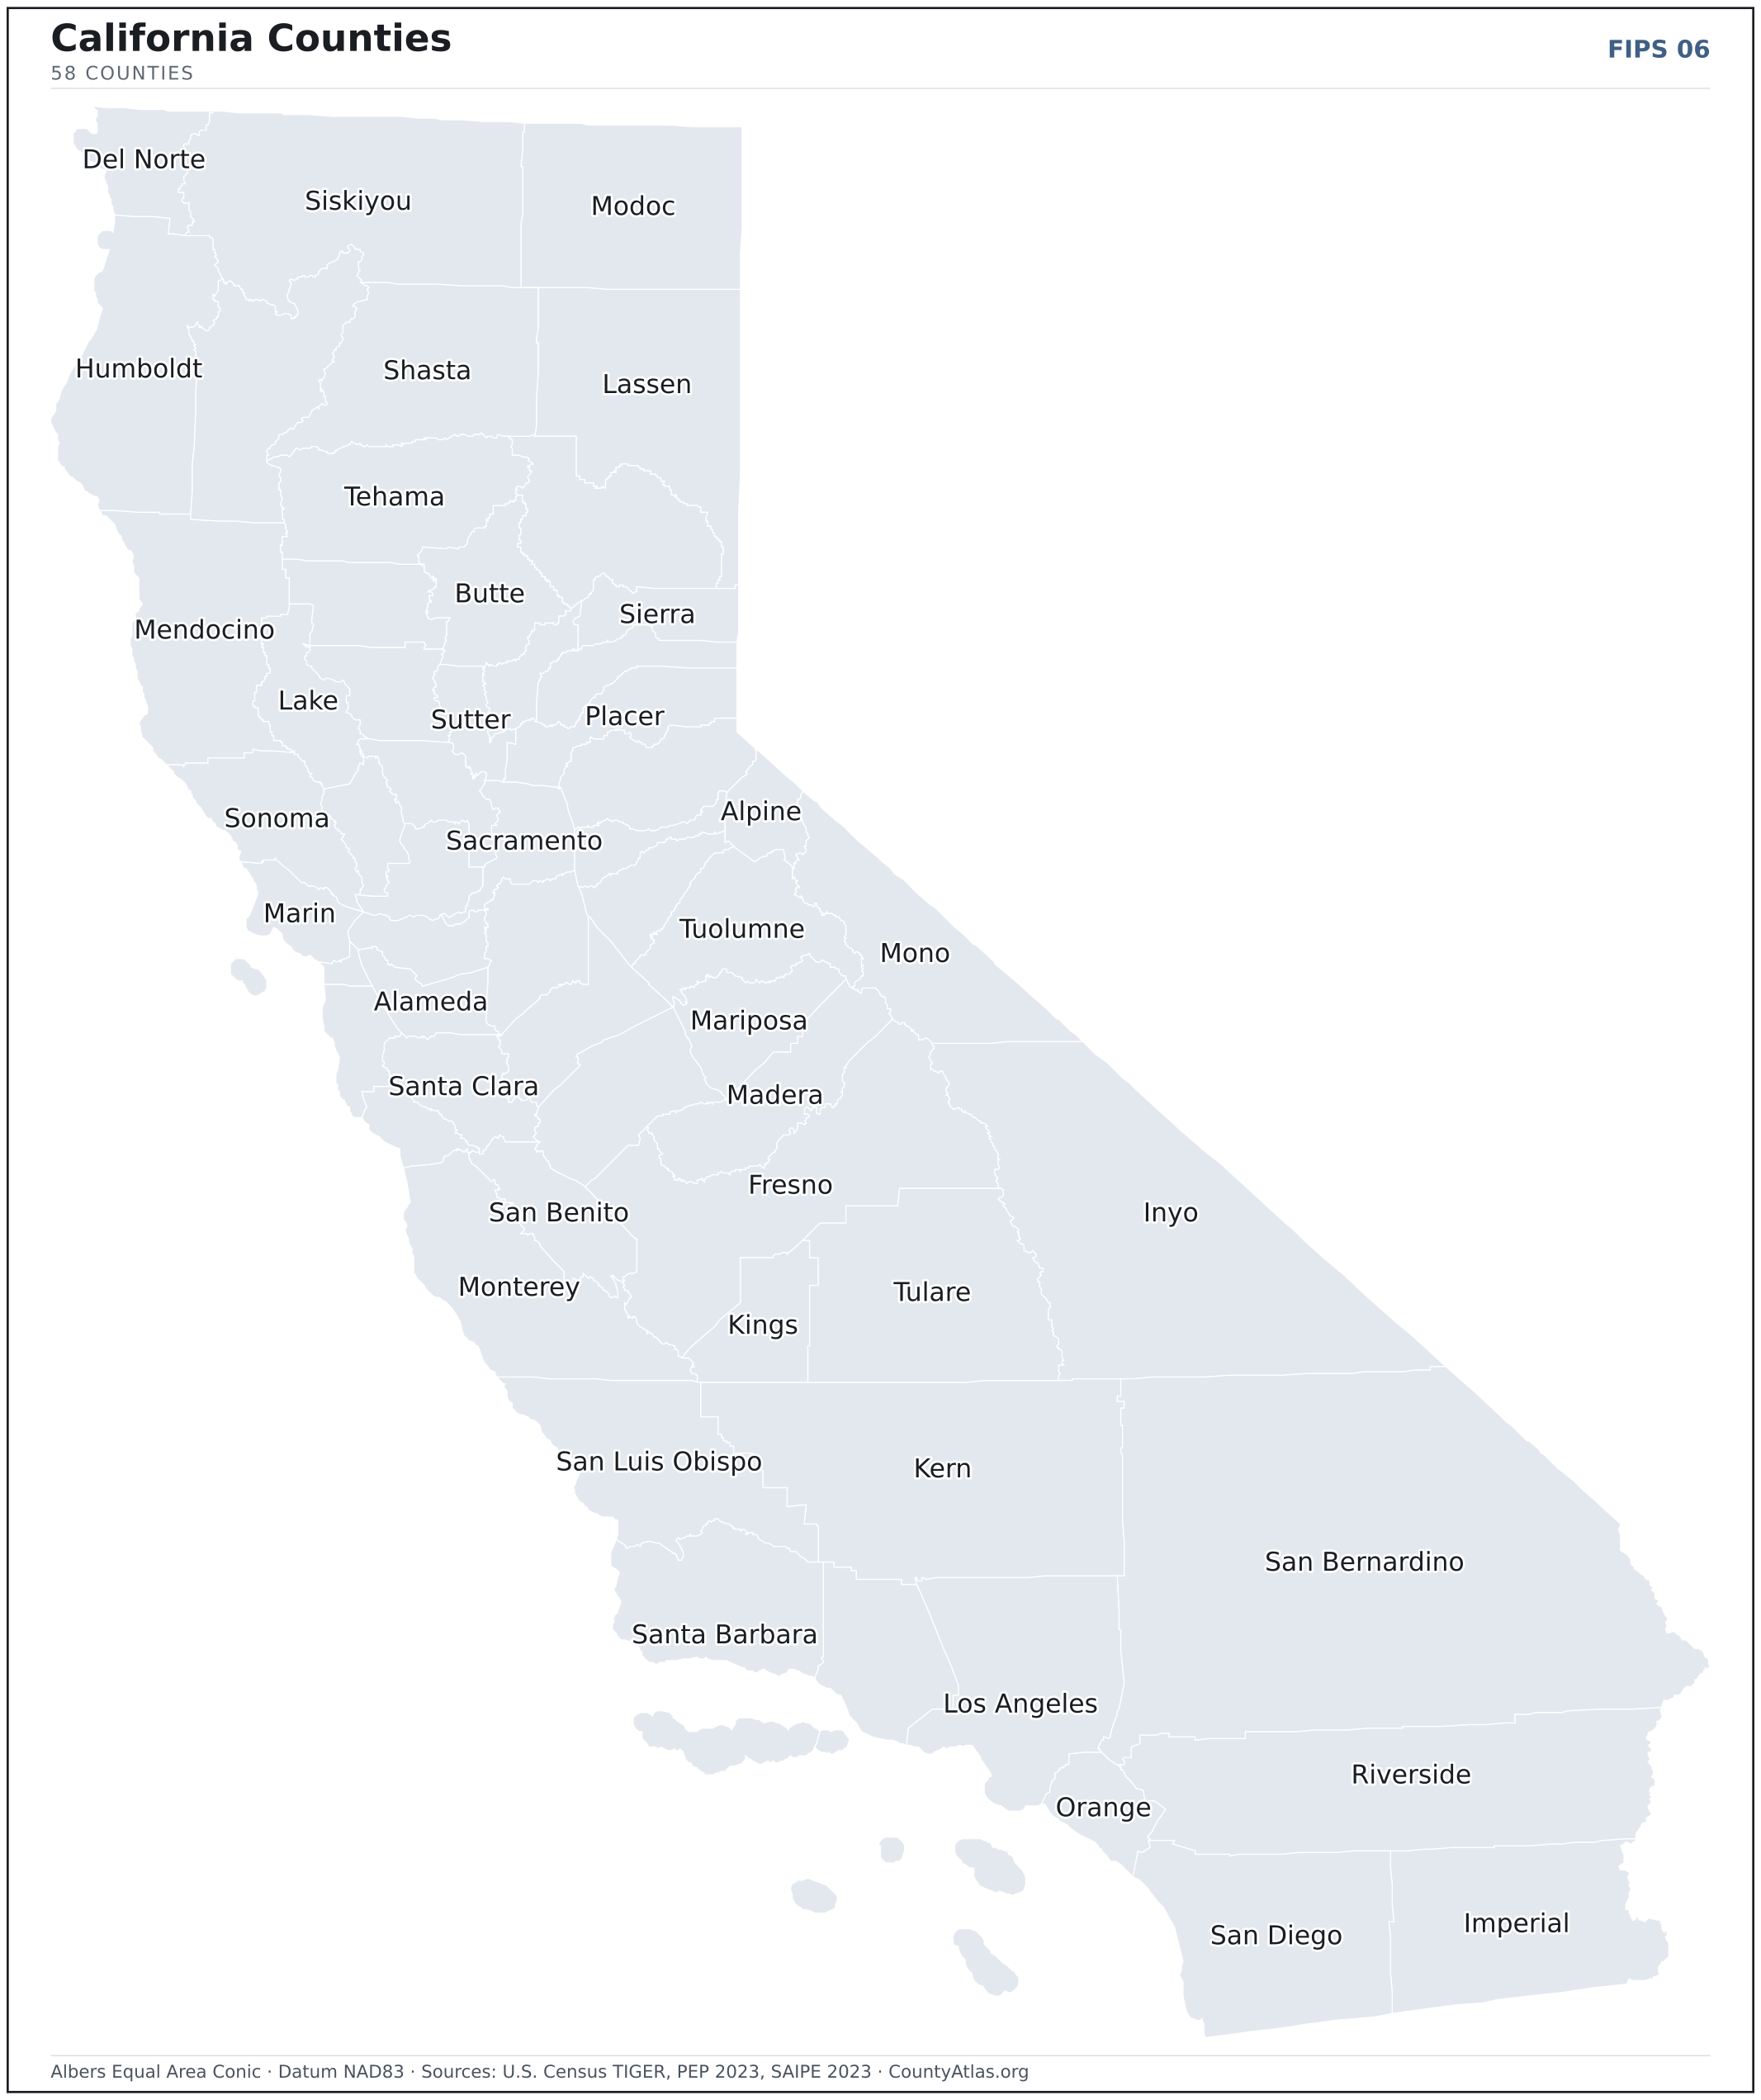
California maps, coloured by the data
Cities in California
California has 483 incorporated cities and towns. The largest is Los Angeles in Los Angeles County with 3,857,897 residents. Use the search on the map above to find any city and highlight the county it sits in.
| Los Angeles | Los Angeles County | 3,857,897 |
| San Diego | San Diego County | 1,385,061 |
| San Jose | Santa Clara County | 990,054 |
| San Francisco | San Francisco County | 836,321 |
| Fresno | Fresno County | 543,615 |
| Sacramento | Sacramento County | 524,802 |
| Long Beach | Los Angeles County | 458,491 |
| Oakland | Alameda County | 438,072 |
| Bakersfield | Kern County | 408,366 |
| Anaheim | Orange County | 344,553 |
| Stockton | San Joaquin County | 320,470 |
| Riverside | Riverside County | 316,241 |
| Santa Ana | Orange County | 311,639 |
| Irvine | Orange County | 308,160 |
| Chula Vista | San Diego County | 275,030 |
| Santa Clarita | Los Angeles County | 229,021 |
| Fremont | Alameda County | 228,518 |
| San Bernardino | San Bernardino County | 221,774 |
| Modesto | Stanislaus County | 218,614 |
| Fontana | San Bernardino County | 211,921 |
| Moreno Valley | Riverside County | 210,378 |
| Oxnard | Ventura County | 201,014 |
| Huntington Beach | Orange County | 196,010 |
| Glendale | Los Angeles County | 192,270 |
| Ontario | San Bernardino County | 178,347 |
| Elk Grove | Sacramento County | 177,221 |
| Santa Rosa | Sonoma County | 177,216 |
| Rancho Cucamonga | San Bernardino County | 174,693 |
| Oceanside | San Diego County | 172,542 |
| Garden Grove | Orange County | 170,603 |
| Lancaster | Los Angeles County | 170,013 |
| Palmdale | Los Angeles County | 165,487 |
| Salinas | Monterey County | 161,993 |
| Hayward | Alameda County | 159,201 |
| Corona | Riverside County | 158,839 |
| Sunnyvale | Santa Clara County | 153,455 |
| Roseville | Placer County | 152,438 |
| Escondido | San Diego County | 149,913 |
| Pomona | Los Angeles County | 148,391 |
| Torrance | Los Angeles County | 143,499 |
| Visalia | Tulare County | 142,649 |
| Fullerton | Orange County | 141,278 |
| Orange | Orange County | 138,723 |
| Pasadena | Los Angeles County | 136,462 |
| Victorville | San Bernardino County | 135,983 |
| Santa Clara | Santa Clara County | 129,239 |
| Simi Valley | Ventura County | 125,769 |
| Thousand Oaks | Ventura County | 125,676 |
| Vallejo | Solano County | 124,637 |
| Concord | Contra Costa County | 124,260 |
Showing the 50 most populous — and 433 more. Search the map above for any California city or village.
A city can span more than one county; each is listed in its primary county — the one its center falls in.
Which California county is the richest, largest, most crowded? The answers
- California’s highest median household income is in Santa Clara County ($154,573); the lowest is in Modoc County ($51,996). Census SAIPE 2023
- California’s most populous county is Los Angeles County (9,663,345); the least populous is Alpine County (1,141) — a 8,469× spread. Census PEP 2023
- California’s largest county by land area is San Bernardino County (20,068 sq mi); the smallest is San Francisco County (47 sq mi). Census TIGER
- California’s highest population density is in San Francisco County (17,331/sq mi); the lowest is in Alpine County (2/sq mi). Census PEP 2023 · TIGER
- California’s highest poverty rate is in Trinity County (20.8%); the lowest is in Placer County (6.5%). Census SAIPE 2023
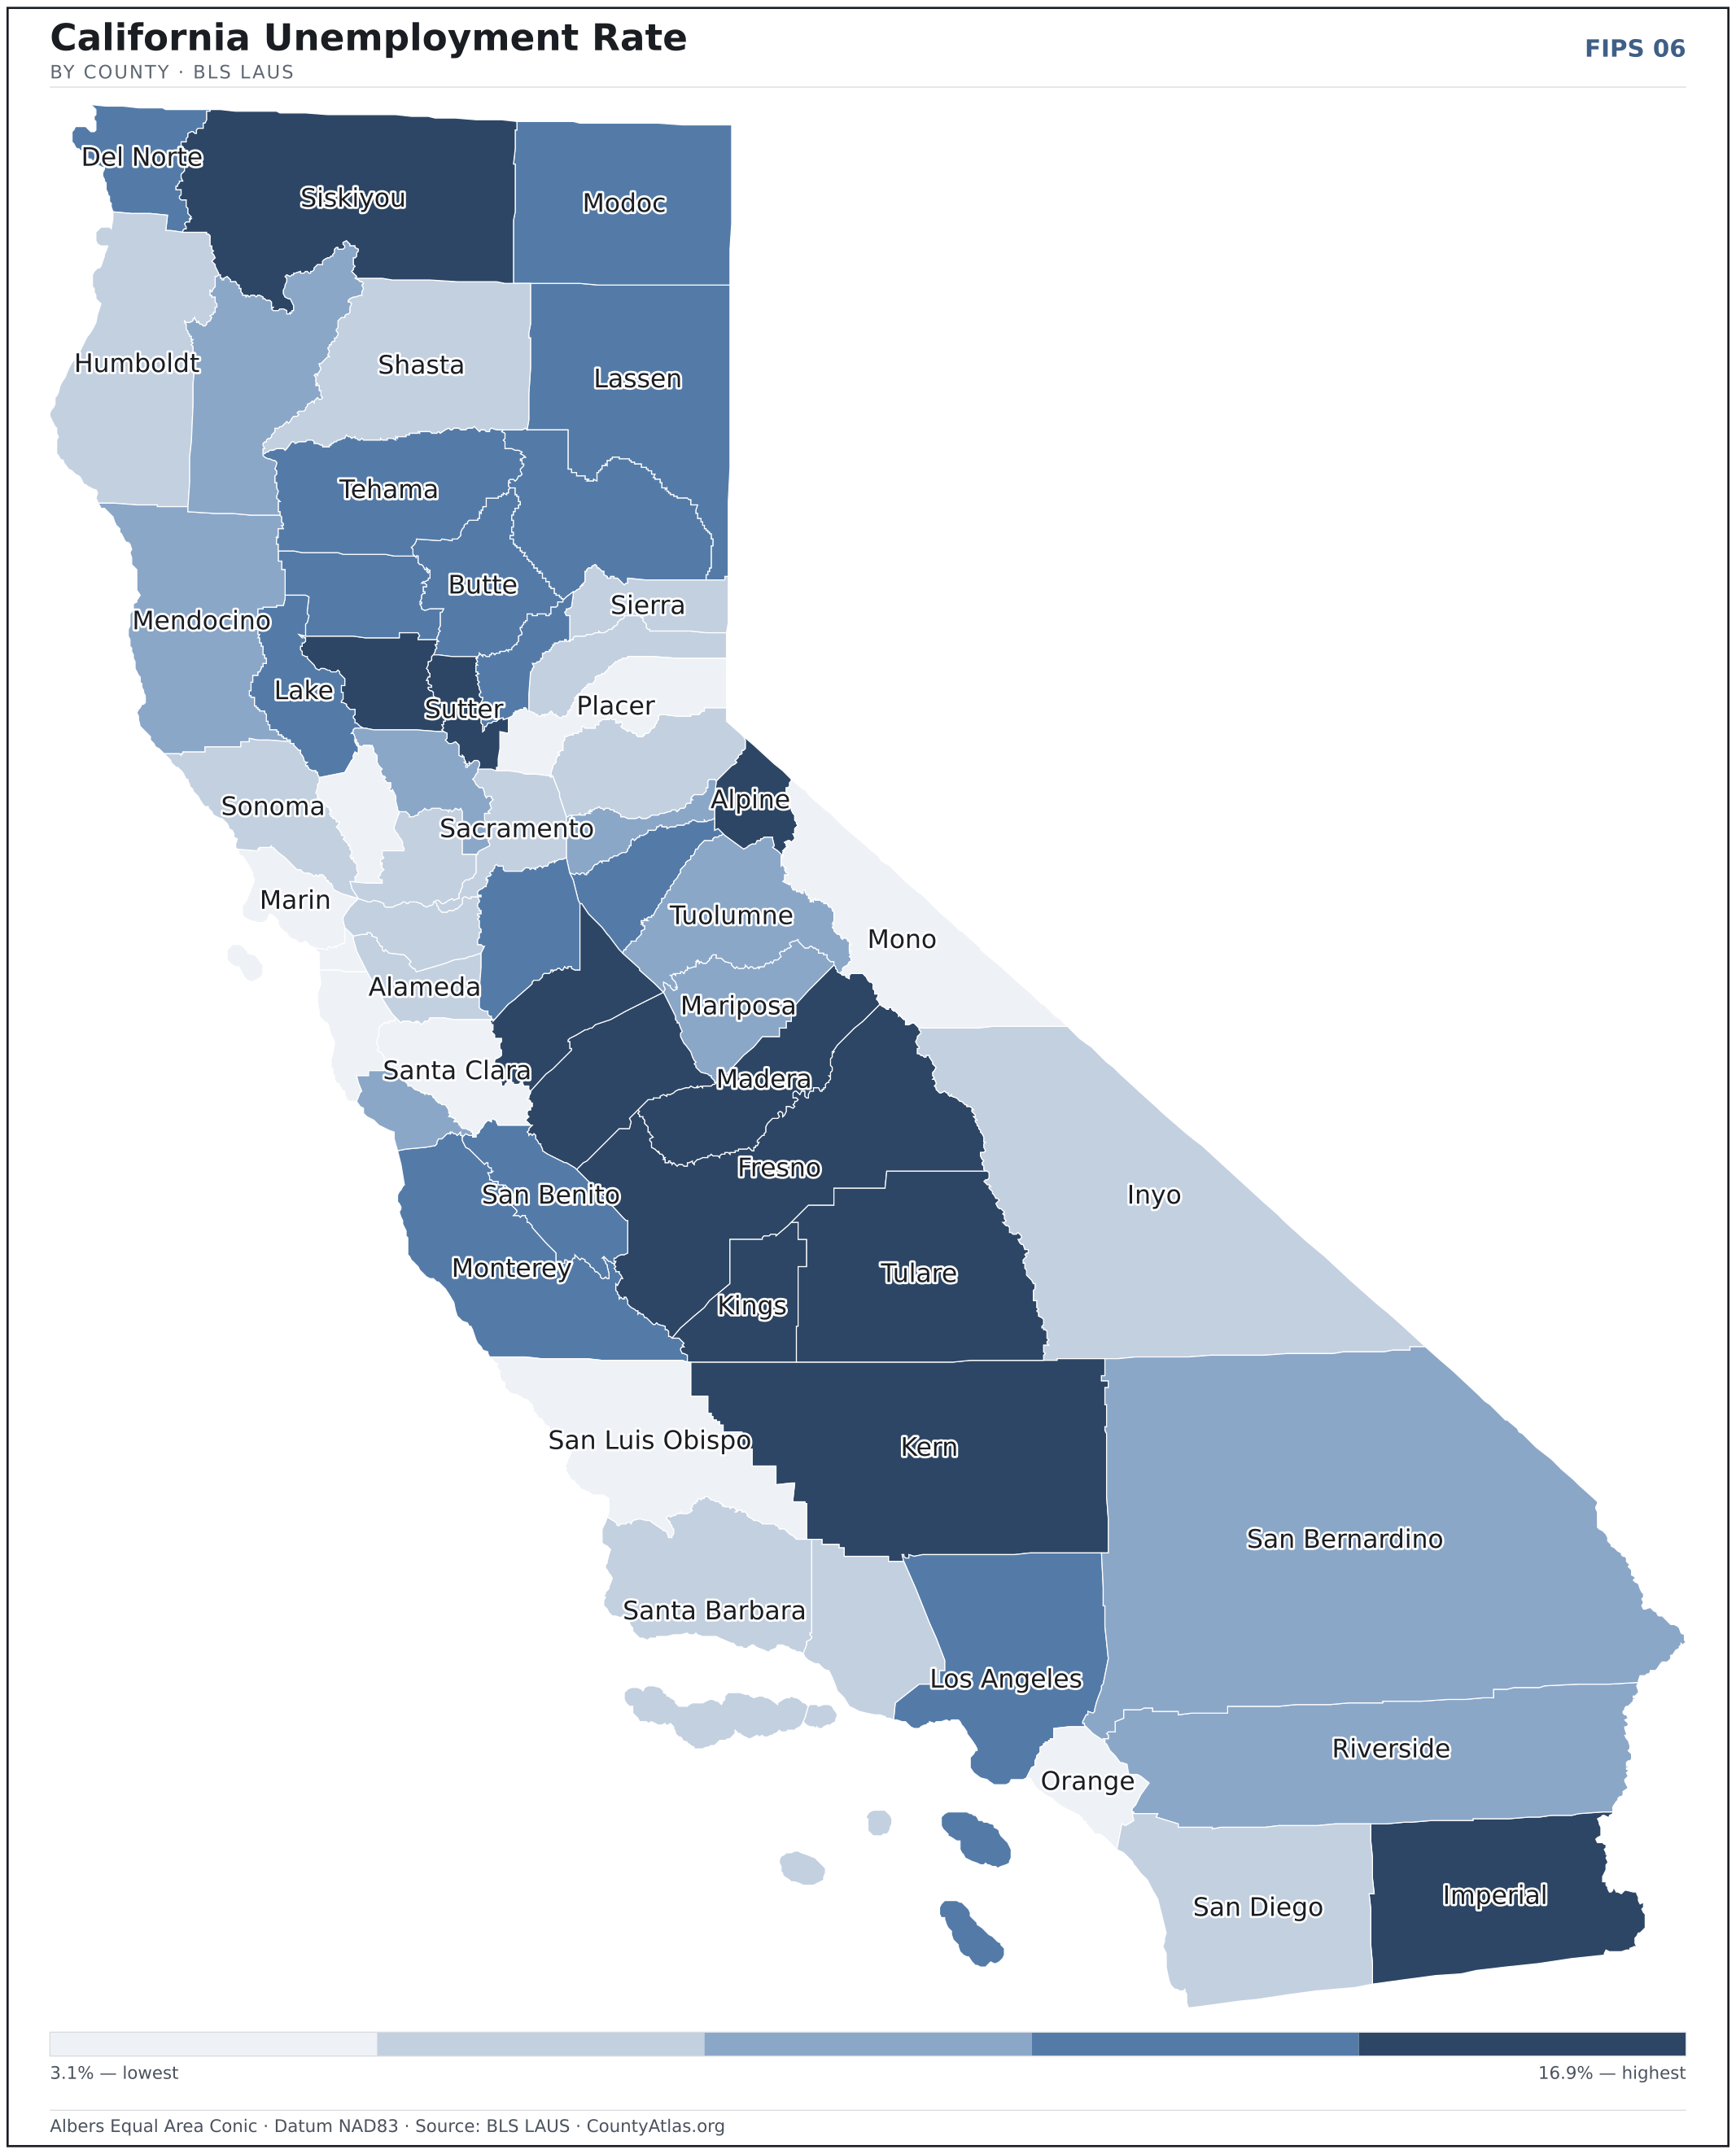
- In California, unemployment is highest in Imperial County (16.9%) and lowest in San Mateo County (3.1%), for May 2026. BLS LAUS
- California’s highest median age is in Sierra County (56.0); the lowest is in Merced County (31.8). Census ACS 2019–2023
- California’s highest share of bachelor’s degrees is in Marin County (60.5% of adults); the lowest is in Lassen County (13.2%). Census ACS 2019–2023
Every figure is a current official estimate from the source named — not a crowd-sourced or copied value. Suppressed estimates (coefficient of variation ≥ 0.30) are omitted, never guessed. See the full methodology.
California counties: common questions
How many counties are in California?
California has 58 counties covering 155,860 sq mi and about 39.0M residents. Every one is on the map above and in the table below.
What is the largest county in California?
It depends on the measure. By land area it’s San Bernardino County (20,068 sq mi); by population it’s Los Angeles County (9,663,345 residents).
What county is Los Angeles in?
Los Angeles (population 3,857,897) is in Los Angeles County. Use the search on the map to find any California city’s county.
What is the richest county in California?
By median household income, Santa Clara County is the richest at $154,573; the poorest is Modoc County at $51,996 (Census SAIPE 2023).
What is the most populous county in California?
Los Angeles County, with 9,663,345 residents — about 24.8% of California’s people, and 8,469× the least populous, Alpine County (1,141).
Sources & vintages
- Population — PEP Vintage 2023 (July 1, 2023) — pep/charv
- Median household income & poverty — SAIPE 2023
- Unemployment — BLS LAUS May 2026 (preliminary)
- Geometry & boundaries — Census TIGERweb
- Cities & city population — Census TIGERweb Incorporated Places + ACS 5-year 2019–2023
Data current through .