CountyAtlas Illinois
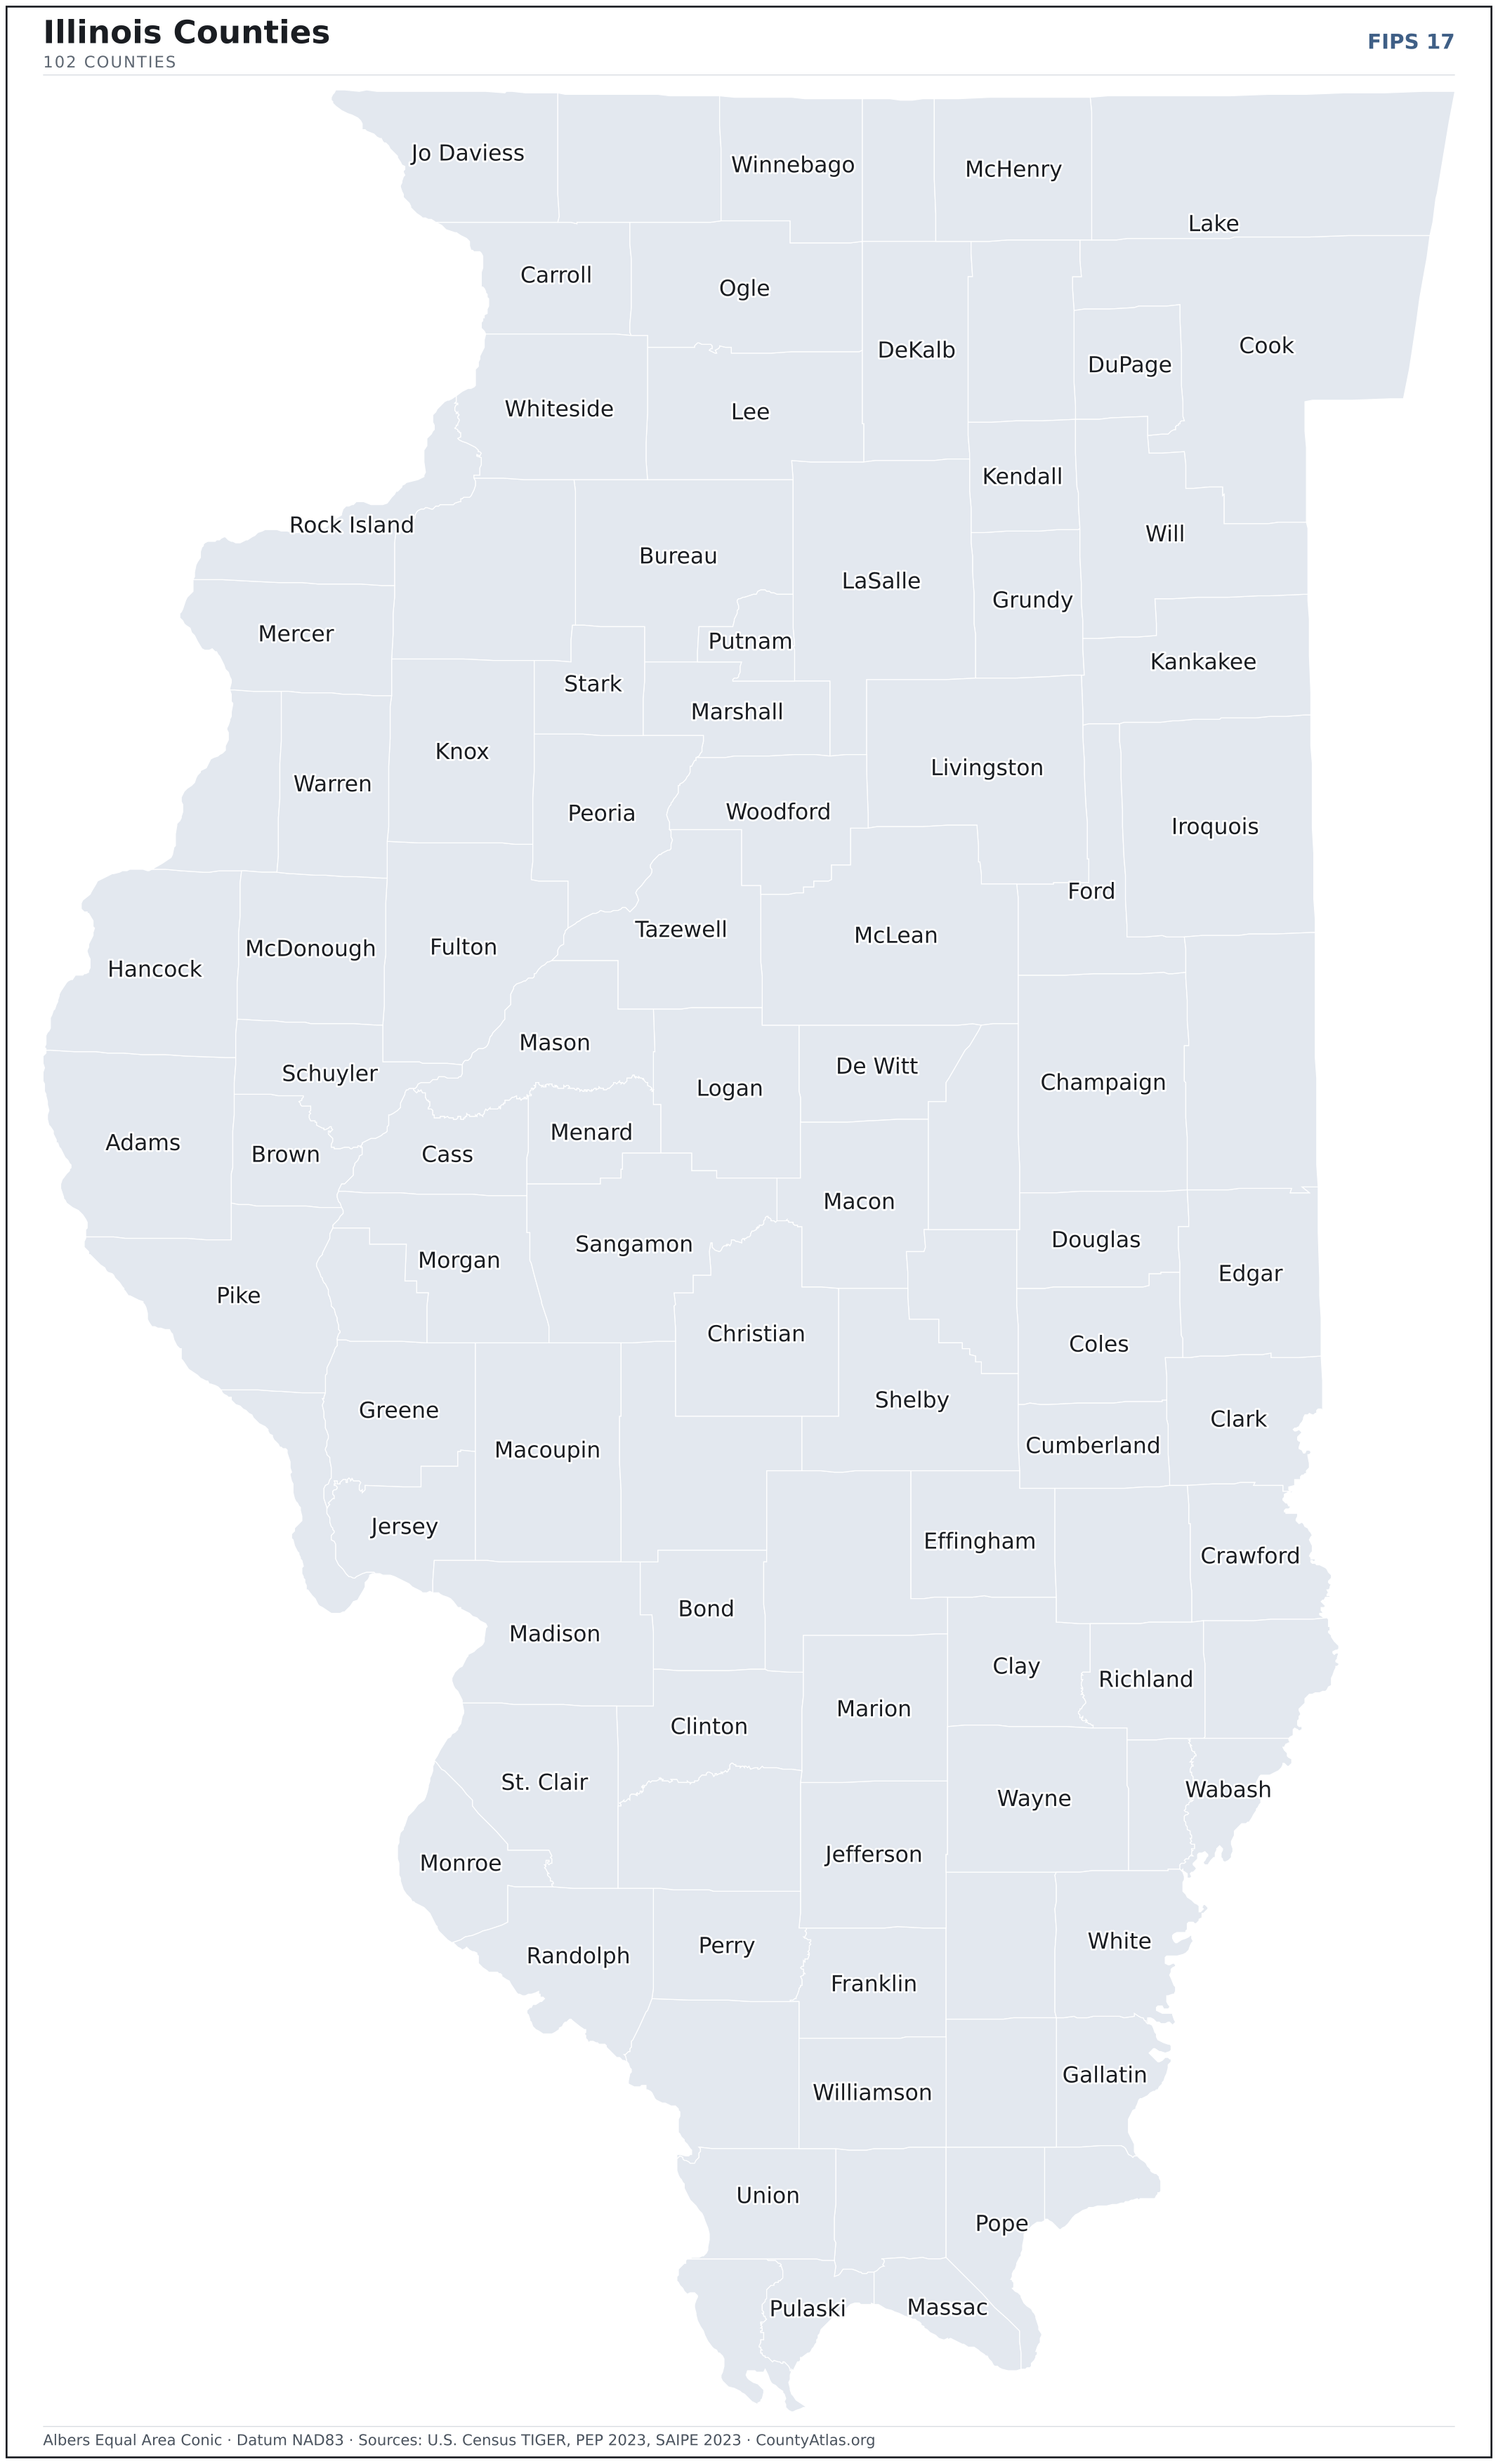
Illinois County Map with Cities — All 102 Counties
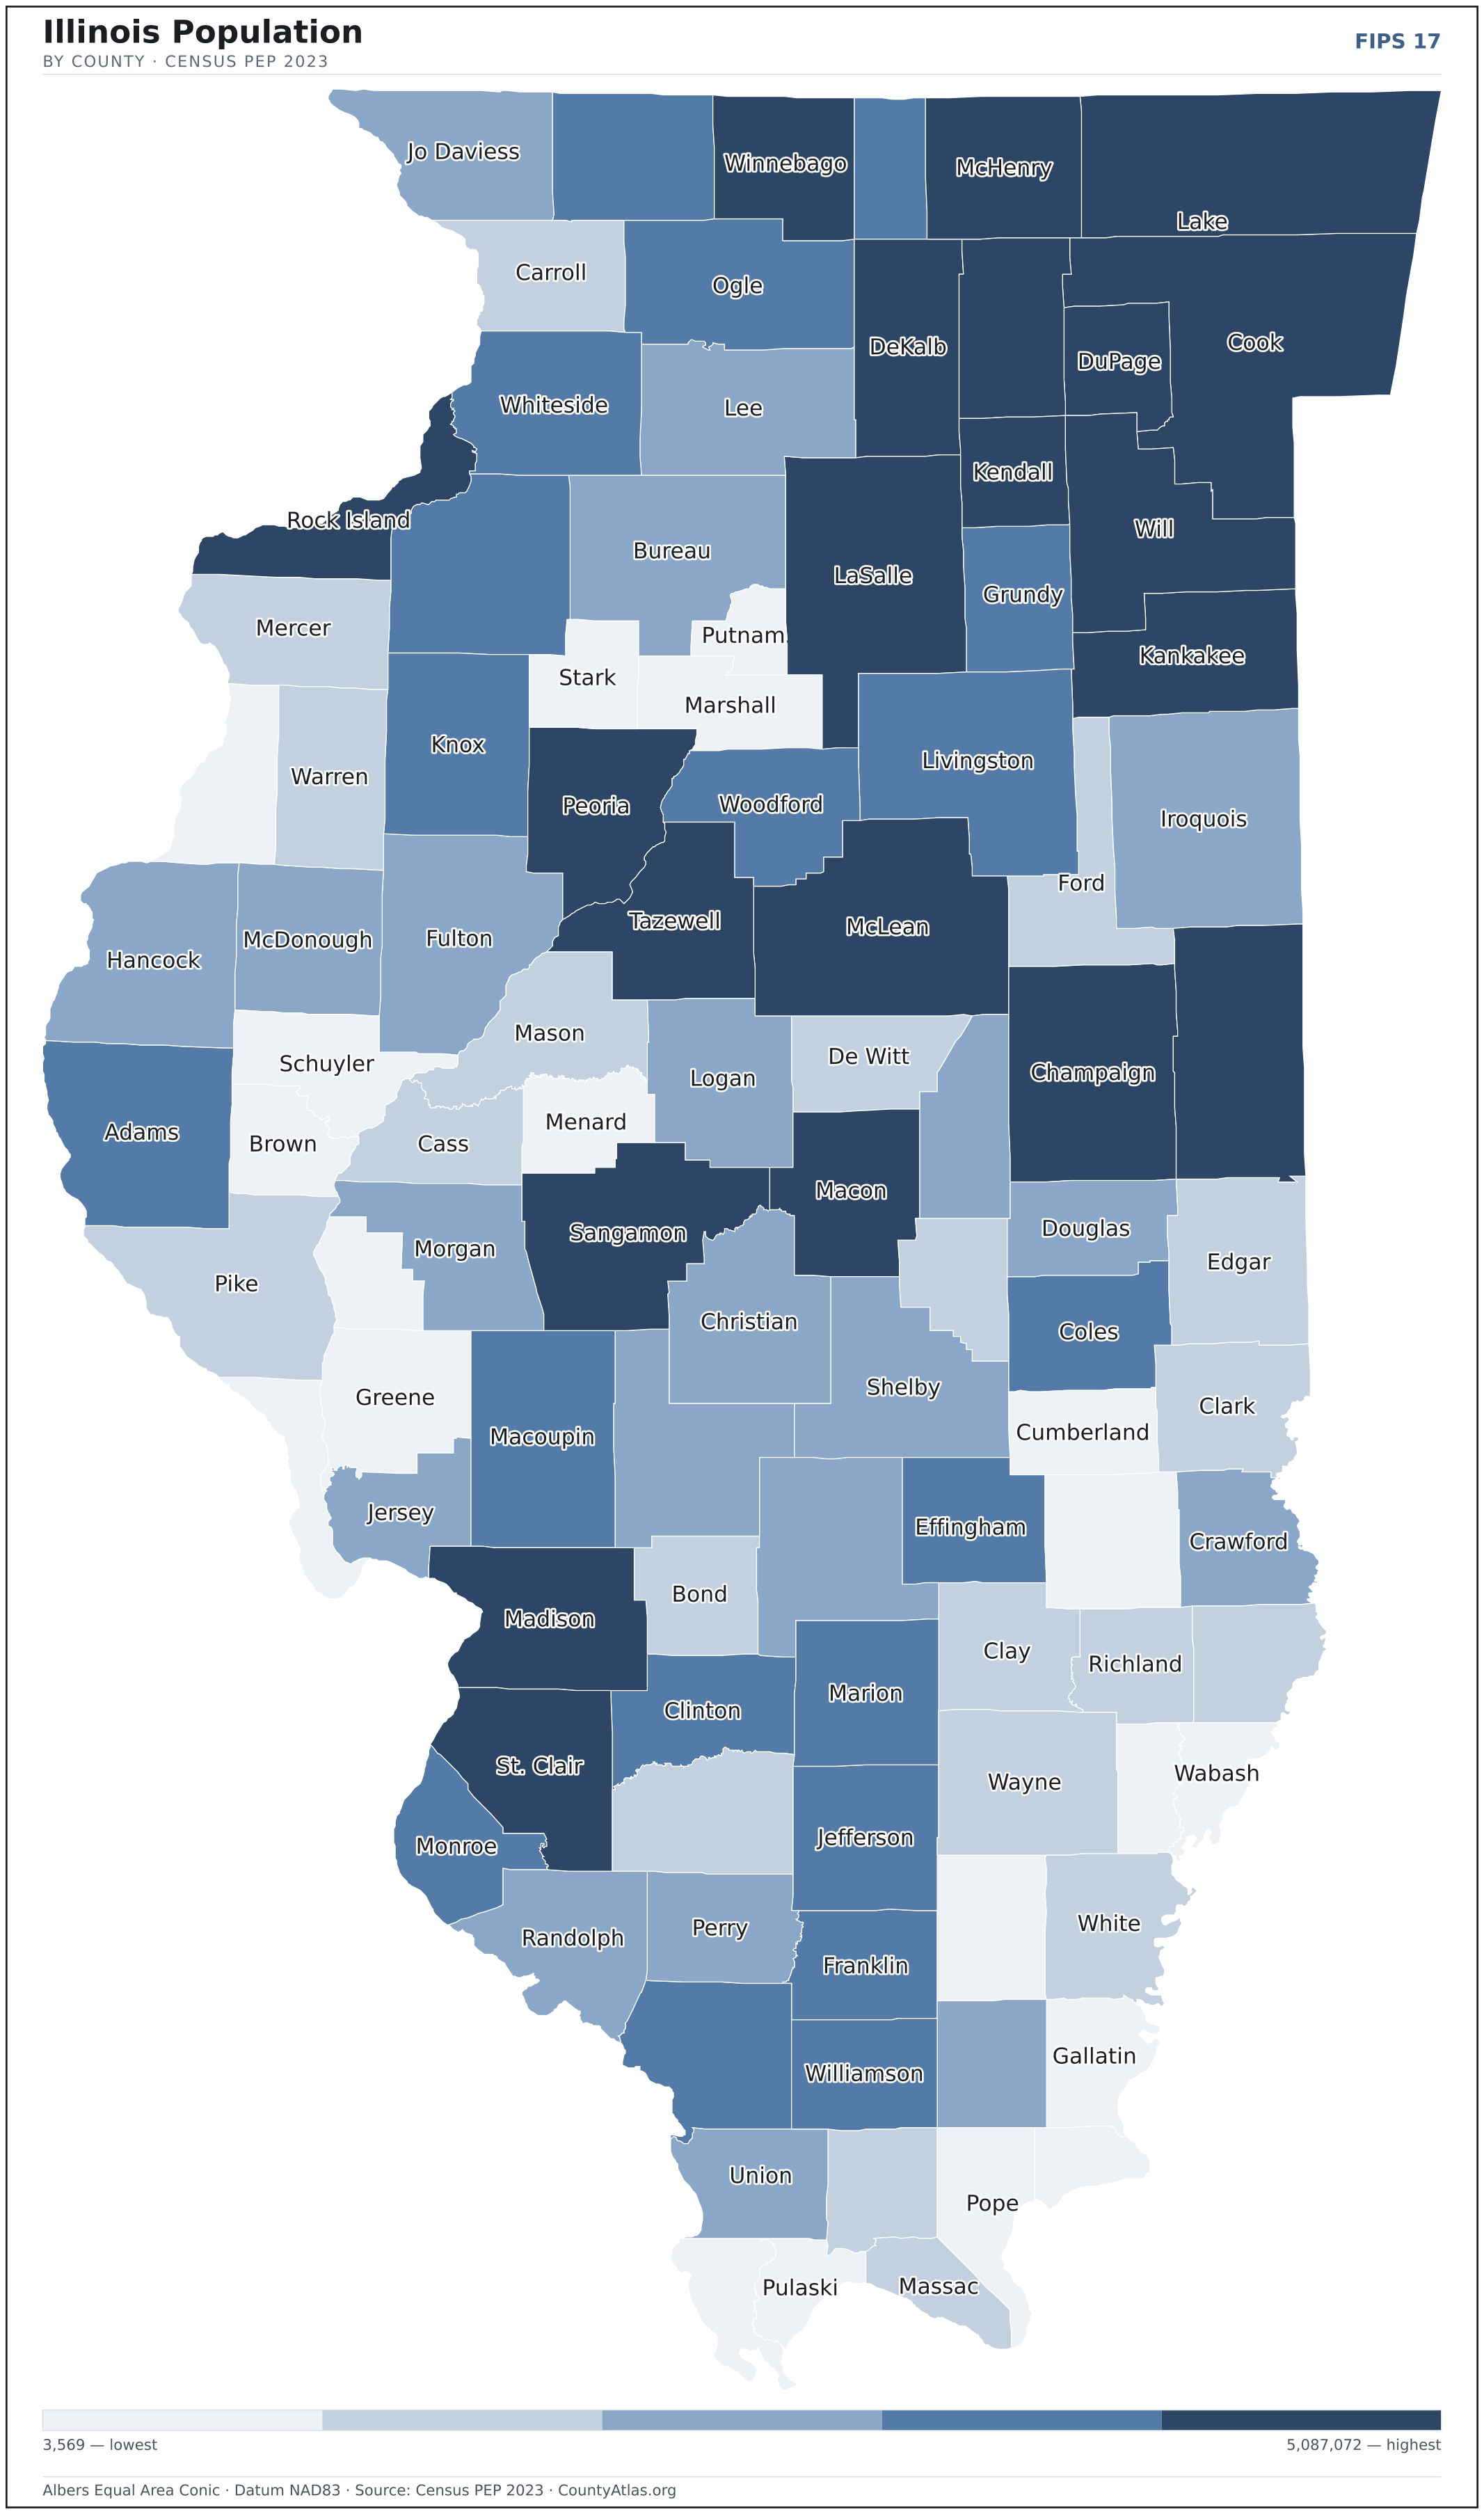
All 102 of Illinois's counties, mapped from official U.S. Census boundaries with population, income, and unemployment for every one. Colour the map by any measure, tap a county for its data, or download a print-ready copy.
Tap any county for its population, income, and more.
Illinois at a glance
- Scale. Illinois is divided into 102 counties across 55,514 sq mi of land — an average of 544 sq mi each. Census TIGER
- People. Its counties are home to 12,549,689 residents — an average of 123,036 each, or 226 per square mile statewide. Census PEP 2023
- Water. Another 2,400 sq mi is water — 4.1% of the state’s area, led by Lake County. Census TIGER
Illinois’s 102 counties, by the numbers
Every county’s population, median household income, unemployment, density, and land area — sortable by any column, so you can find yours or rank by what matters to you. A few patterns run through the data:
- Concentrated. Half of Illinois’s 12,549,689 residents live in just 3 of 102 counties, and the five largest hold 63.2% of the total. Census PEP 2023
- Income tracks poverty. The gap from richest to poorest runs 2.5×, and the 10 highest-income counties average 6.8% in poverty against 19.5% for the 10 lowest. Census SAIPE 2023
- Mostly small. Half of Illinois’s counties have fewer than 24,505 residents, and half report a median household income below $65,901 — a few metros lift the statewide totals well above both. Census PEP 2023 · SAIPE 2023
- Lopsided density. Only 12 of 102 counties are denser than Illinois’s statewide average of 226 people per square mile — the rest are more rural. Census PEP 2023 · TIGER
| Adams County | 64,441 | $63,424 | 3.3% | 75/sq mi | 855 sq mi | Quincy |
| Alexander County | 4,695 | $45,550 | 6.1% | 20/sq mi | 235 sq mi | Cairo |
| Bond County | 16,450 | $66,162 | 4.1% | 43/sq mi | 380 sq mi | Greenville |
| Boone County | 53,202 | $83,129 | 4.7% | 189/sq mi | 281 sq mi | Belvidere |
| Brown County | 6,294 | $76,076 | 2.9% | 21/sq mi | 306 sq mi | Mount Sterling |
| Bureau County | 32,729 | $66,854 | 4.6% | 38/sq mi | 869 sq mi | Princeton |
| Calhoun County | 4,317 | $72,574 | 4.2% | 17/sq mi | 254 sq mi | Hardin |
| Carroll County | 15,526 | $61,982 | 4.1% | 35/sq mi | 445 sq mi | Mount Carroll |
| Cass County | 12,596 | $64,413 | 3.9% | 34/sq mi | 376 sq mi | Virginia |
| Champaign County | 205,644 | $62,169 | 4.0% | 206/sq mi | 996 sq mi | Urbana |
| Christian County | 33,228 | $72,650 | 4.0% | 47/sq mi | 709 sq mi | Taylorville |
| Clark County | 15,088 | $66,923 | 4.5% | 30/sq mi | 501 sq mi | Marshall |
| Clay County | 12,999 | $54,837 | 4.1% | 28/sq mi | 468 sq mi | Louisville |
| Clinton County | 36,785 | $88,977 | 3.2% | 78/sq mi | 474 sq mi | Carlyle |
| Coles County | 46,060 | $57,728 | 3.7% | 91/sq mi | 508 sq mi | Charleston |
| Cook County | 5,087,072 | $80,547 | 5.3% | 5,384/sq mi | 945 sq mi | Chicago |
| Crawford County | 18,300 | $64,168 | 3.8% | 41/sq mi | 444 sq mi | Robinson |
| Cumberland County | 10,261 | $71,741 | 3.1% | 30/sq mi | 346 sq mi | Toledo |
| De Witt County | 15,365 | $74,553 | 3.8% | 39/sq mi | 398 sq mi | Clinton |
| DeKalb County | 100,288 | $69,439 | 4.1% | 159/sq mi | 631 sq mi | Sycamore |
| Douglas County | 19,629 | $82,895 | 3.5% | 47/sq mi | 417 sq mi | Tuscola |
| DuPage County | 921,213 | $107,032 | 4.4% | 2,809/sq mi | 328 sq mi | Wheaton |
| Edgar County | 16,334 | $59,330 | 4.0% | 26/sq mi | 623 sq mi | Paris |
| Edwards County | 5,968 | $59,867 | 9.6% | 27/sq mi | 222 sq mi | Albion |
| Effingham County | 34,331 | $72,158 | 3.3% | 72/sq mi | 479 sq mi | Effingham |
| Fayette County | 21,164 | $61,952 | 4.5% | 30/sq mi | 716 sq mi | Vandalia |
| Ford County | 13,250 | $71,110 | 4.0% | 27/sq mi | 486 sq mi | Paxton |
| Franklin County | 37,138 | $52,533 | 4.7% | 91/sq mi | 409 sq mi | Benton |
| Fulton County | 32,541 | $62,914 | 4.4% | 38/sq mi | 866 sq mi | Lewistown |
| Gallatin County | 4,670 | $56,852 | 4.7% | 14/sq mi | 323 sq mi | Shawneetown |
| Greene County | 11,543 | $59,146 | 3.6% | 21/sq mi | 543 sq mi | Carrollton |
| Grundy County | 53,578 | $91,254 | 4.6% | 128/sq mi | 418 sq mi | Morris |
| Hamilton County | 7,911 | $65,472 | 4.0% | 18/sq mi | 435 sq mi | McLeansboro |
| Hancock County | 17,186 | $63,408 | 3.4% | 22/sq mi | 794 sq mi | Carthage |
| Hardin County | 3,569 | $51,216 | 4.2% | 20/sq mi | 177 sq mi | Elizabethtown |
| Henderson County | 6,088 | $62,610 | 3.5% | 16/sq mi | 379 sq mi | Oquawka |
| Henry County | 48,448 | $73,198 | 4.5% | 59/sq mi | 823 sq mi | Cambridge |
| Iroquois County | 26,136 | $64,995 | 4.4% | 23/sq mi | 1,117 sq mi | Watseka |
| Jackson County | 52,141 | $48,289 | 4.8% | 89/sq mi | 584 sq mi | Murphysboro |
| Jasper County | 9,144 | $69,924 | 3.3% | 18/sq mi | 495 sq mi | Newton |
| Jefferson County | 36,320 | $60,543 | 5.0% | 64/sq mi | 571 sq mi | Mount Vernon |
| Jersey County | 21,091 | $70,158 | 3.8% | 57/sq mi | 370 sq mi | Jerseyville |
| Jo Daviess County | 21,756 | $74,426 | 3.4% | 36/sq mi | 601 sq mi | Galena |
| Johnson County | 13,326 | $63,160 | 4.8% | 39/sq mi | 344 sq mi | Vienna |
| Kane County | 514,982 | $97,543 | 4.2% | 992/sq mi | 519 sq mi | Geneva |
| Kankakee County | 105,940 | $68,451 | 4.9% | 157/sq mi | 676 sq mi | Kankakee |
| Kendall County | 139,976 | $114,606 | 4.1% | 437/sq mi | 320 sq mi | Yorkville |
| Knox County | 48,411 | $57,569 | 5.0% | 68/sq mi | 716 sq mi | Galesburg |
| Lake County | 708,760 | $108,349 | 4.2% | 1,597/sq mi | 444 sq mi | Waukegan |
| LaSalle County | 108,309 | $72,225 | 4.9% | 95/sq mi | 1,135 sq mi | Ottawa |
| Lawrence County | 14,813 | $55,411 | 4.7% | 40/sq mi | 372 sq mi | Lawrenceville |
| Lee County | 33,654 | $66,598 | 4.3% | 46/sq mi | 725 sq mi | Dixon |
| Livingston County | 35,320 | $68,544 | 3.7% | 34/sq mi | 1,044 sq mi | Pontiac |
| Logan County | 27,590 | $64,779 | 4.4% | 45/sq mi | 618 sq mi | Lincoln |
| Macon County | 100,591 | $61,033 | 5.6% | 173/sq mi | 581 sq mi | Decatur |
| Macoupin County | 44,018 | $70,256 | 4.3% | 51/sq mi | 863 sq mi | Carlinville |
| Madison County | 262,752 | $73,194 | 3.9% | 367/sq mi | 716 sq mi | Edwardsville |
| Marion County | 36,673 | $54,774 | 4.6% | 64/sq mi | 573 sq mi | Salem |
| Marshall County | 11,683 | $70,246 | 4.8% | 30/sq mi | 387 sq mi | Lacon |
| Mason County | 12,523 | $62,146 | 4.3% | 23/sq mi | 539 sq mi | Havana |
| Massac County | 13,661 | $58,202 | 4.2% | 58/sq mi | 237 sq mi | Metropolis |
| McDonough County | 26,839 | $50,487 | 4.1% | 46/sq mi | 589 sq mi | Macomb |
| McHenry County | 312,800 | $101,205 | 4.4% | 518/sq mi | 603 sq mi | Woodstock |
| McLean County | 170,441 | $79,622 | 3.8% | 144/sq mi | 1,183 sq mi | Bloomington |
| Menard County | 11,954 | $80,964 | 4.0% | 38/sq mi | 314 sq mi | Petersburg |
| Mercer County | 15,487 | $77,098 | 4.2% | 28/sq mi | 561 sq mi | Aledo |
| Monroe County | 34,957 | $103,032 | 3.0% | 91/sq mi | 385 sq mi | Waterloo |
| Montgomery County | 27,663 | $60,599 | 4.2% | 39/sq mi | 704 sq mi | Hillsboro |
| Morgan County | 32,140 | $64,268 | 4.0% | 56/sq mi | 569 sq mi | Jacksonville |
| Moultrie County | 14,342 | $72,928 | 3.3% | 43/sq mi | 336 sq mi | Sullivan |
| Ogle County | 51,265 | $78,109 | 4.3% | 68/sq mi | 759 sq mi | Oregon |
| Peoria County | 177,513 | $62,873 | 4.9% | 287/sq mi | 619 sq mi | Peoria |
| Perry County | 20,503 | $62,830 | 4.8% | 46/sq mi | 442 sq mi | Pinckneyville |
| Piatt County | 16,714 | $81,611 | 3.3% | 38/sq mi | 439 sq mi | Monticello |
| Pike County | 14,342 | $58,733 | 4.2% | 17/sq mi | 831 sq mi | Pittsfield |
| Pope County | 3,707 | $58,093 | 5.7% | 10/sq mi | 369 sq mi | Golconda |
| Pulaski County | 4,911 | $50,863 | 5.6% | 25/sq mi | 199 sq mi | Mound City |
| Putnam County | 5,561 | $75,469 | 4.3% | 35/sq mi | 160 sq mi | Hennepin |
| Randolph County | 29,815 | $70,526 | 3.8% | 52/sq mi | 575 sq mi | Chester |
| Richland County | 15,488 | $57,119 | 4.0% | 43/sq mi | 360 sq mi | Olney |
| Rock Island County | 141,236 | $63,457 | 4.5% | 330/sq mi | 428 sq mi | Rock Island |
| Saline County | 22,873 | $53,318 | 4.3% | 60/sq mi | 380 sq mi | Harrisburg |
| Sangamon County | 193,491 | $73,004 | 4.3% | 223/sq mi | 868 sq mi | Springfield |
| Schuyler County | 6,733 | $64,444 | 4.4% | 15/sq mi | 437 sq mi | Rushville |
| Scott County | 4,710 | $67,157 | 3.9% | 19/sq mi | 251 sq mi | Winchester |
| Shelby County | 20,568 | $68,618 | 3.6% | 27/sq mi | 759 sq mi | Shelbyville |
| St. Clair County | 251,018 | $66,007 | 4.3% | 382/sq mi | 658 sq mi | Belleville |
| Stark County | 5,218 | $69,523 | 4.7% | 18/sq mi | 288 sq mi | Toulon |
| Stephenson County | 43,105 | $64,926 | 4.0% | 76/sq mi | 564 sq mi | Freeport |
| Tazewell County | 129,541 | $73,659 | 4.2% | 200/sq mi | 646 sq mi | Pekin |
| Union County | 16,667 | $64,452 | 4.2% | 40/sq mi | 413 sq mi | Jonesboro |
| Vermilion County | 71,652 | $51,813 | 5.0% | 80/sq mi | 898 sq mi | Danville |
| Wabash County | 10,942 | $64,466 | 4.8% | 49/sq mi | 223 sq mi | Mount Carmel |
| Warren County | 16,185 | $64,493 | 4.1% | 30/sq mi | 542 sq mi | Monmouth |
| Washington County | 13,536 | $74,848 | 3.4% | 24/sq mi | 563 sq mi | Nashville |
| Wayne County | 15,761 | $56,071 | 4.9% | 22/sq mi | 714 sq mi | Fairfield |
| White County | 13,401 | $56,768 | 4.6% | 27/sq mi | 495 sq mi | Carmi |
| Whiteside County | 54,498 | $68,641 | 4.4% | 80/sq mi | 684 sq mi | Morrison |
| Will County | 700,728 | $103,587 | 4.8% | 838/sq mi | 836 sq mi | Joliet |
| Williamson County | 66,706 | $60,704 | 4.0% | 159/sq mi | 420 sq mi | Marion |
| Winnebago County | 280,922 | $65,795 | 5.0% | 548/sq mi | 513 sq mi | Rockford |
| Woodford County | 38,285 | $90,169 | 3.5% | 73/sq mi | 528 sq mi | Eureka |
All 102 counties, sortable by any column — click a heading. A suppressed estimate (coefficient of variation ≥ 0.30) shows a marker, never a guess. County seats are from Wikidata (CC0), each validated to a Census place inside its county; a county with no validated seat is left blank. See the methodology.
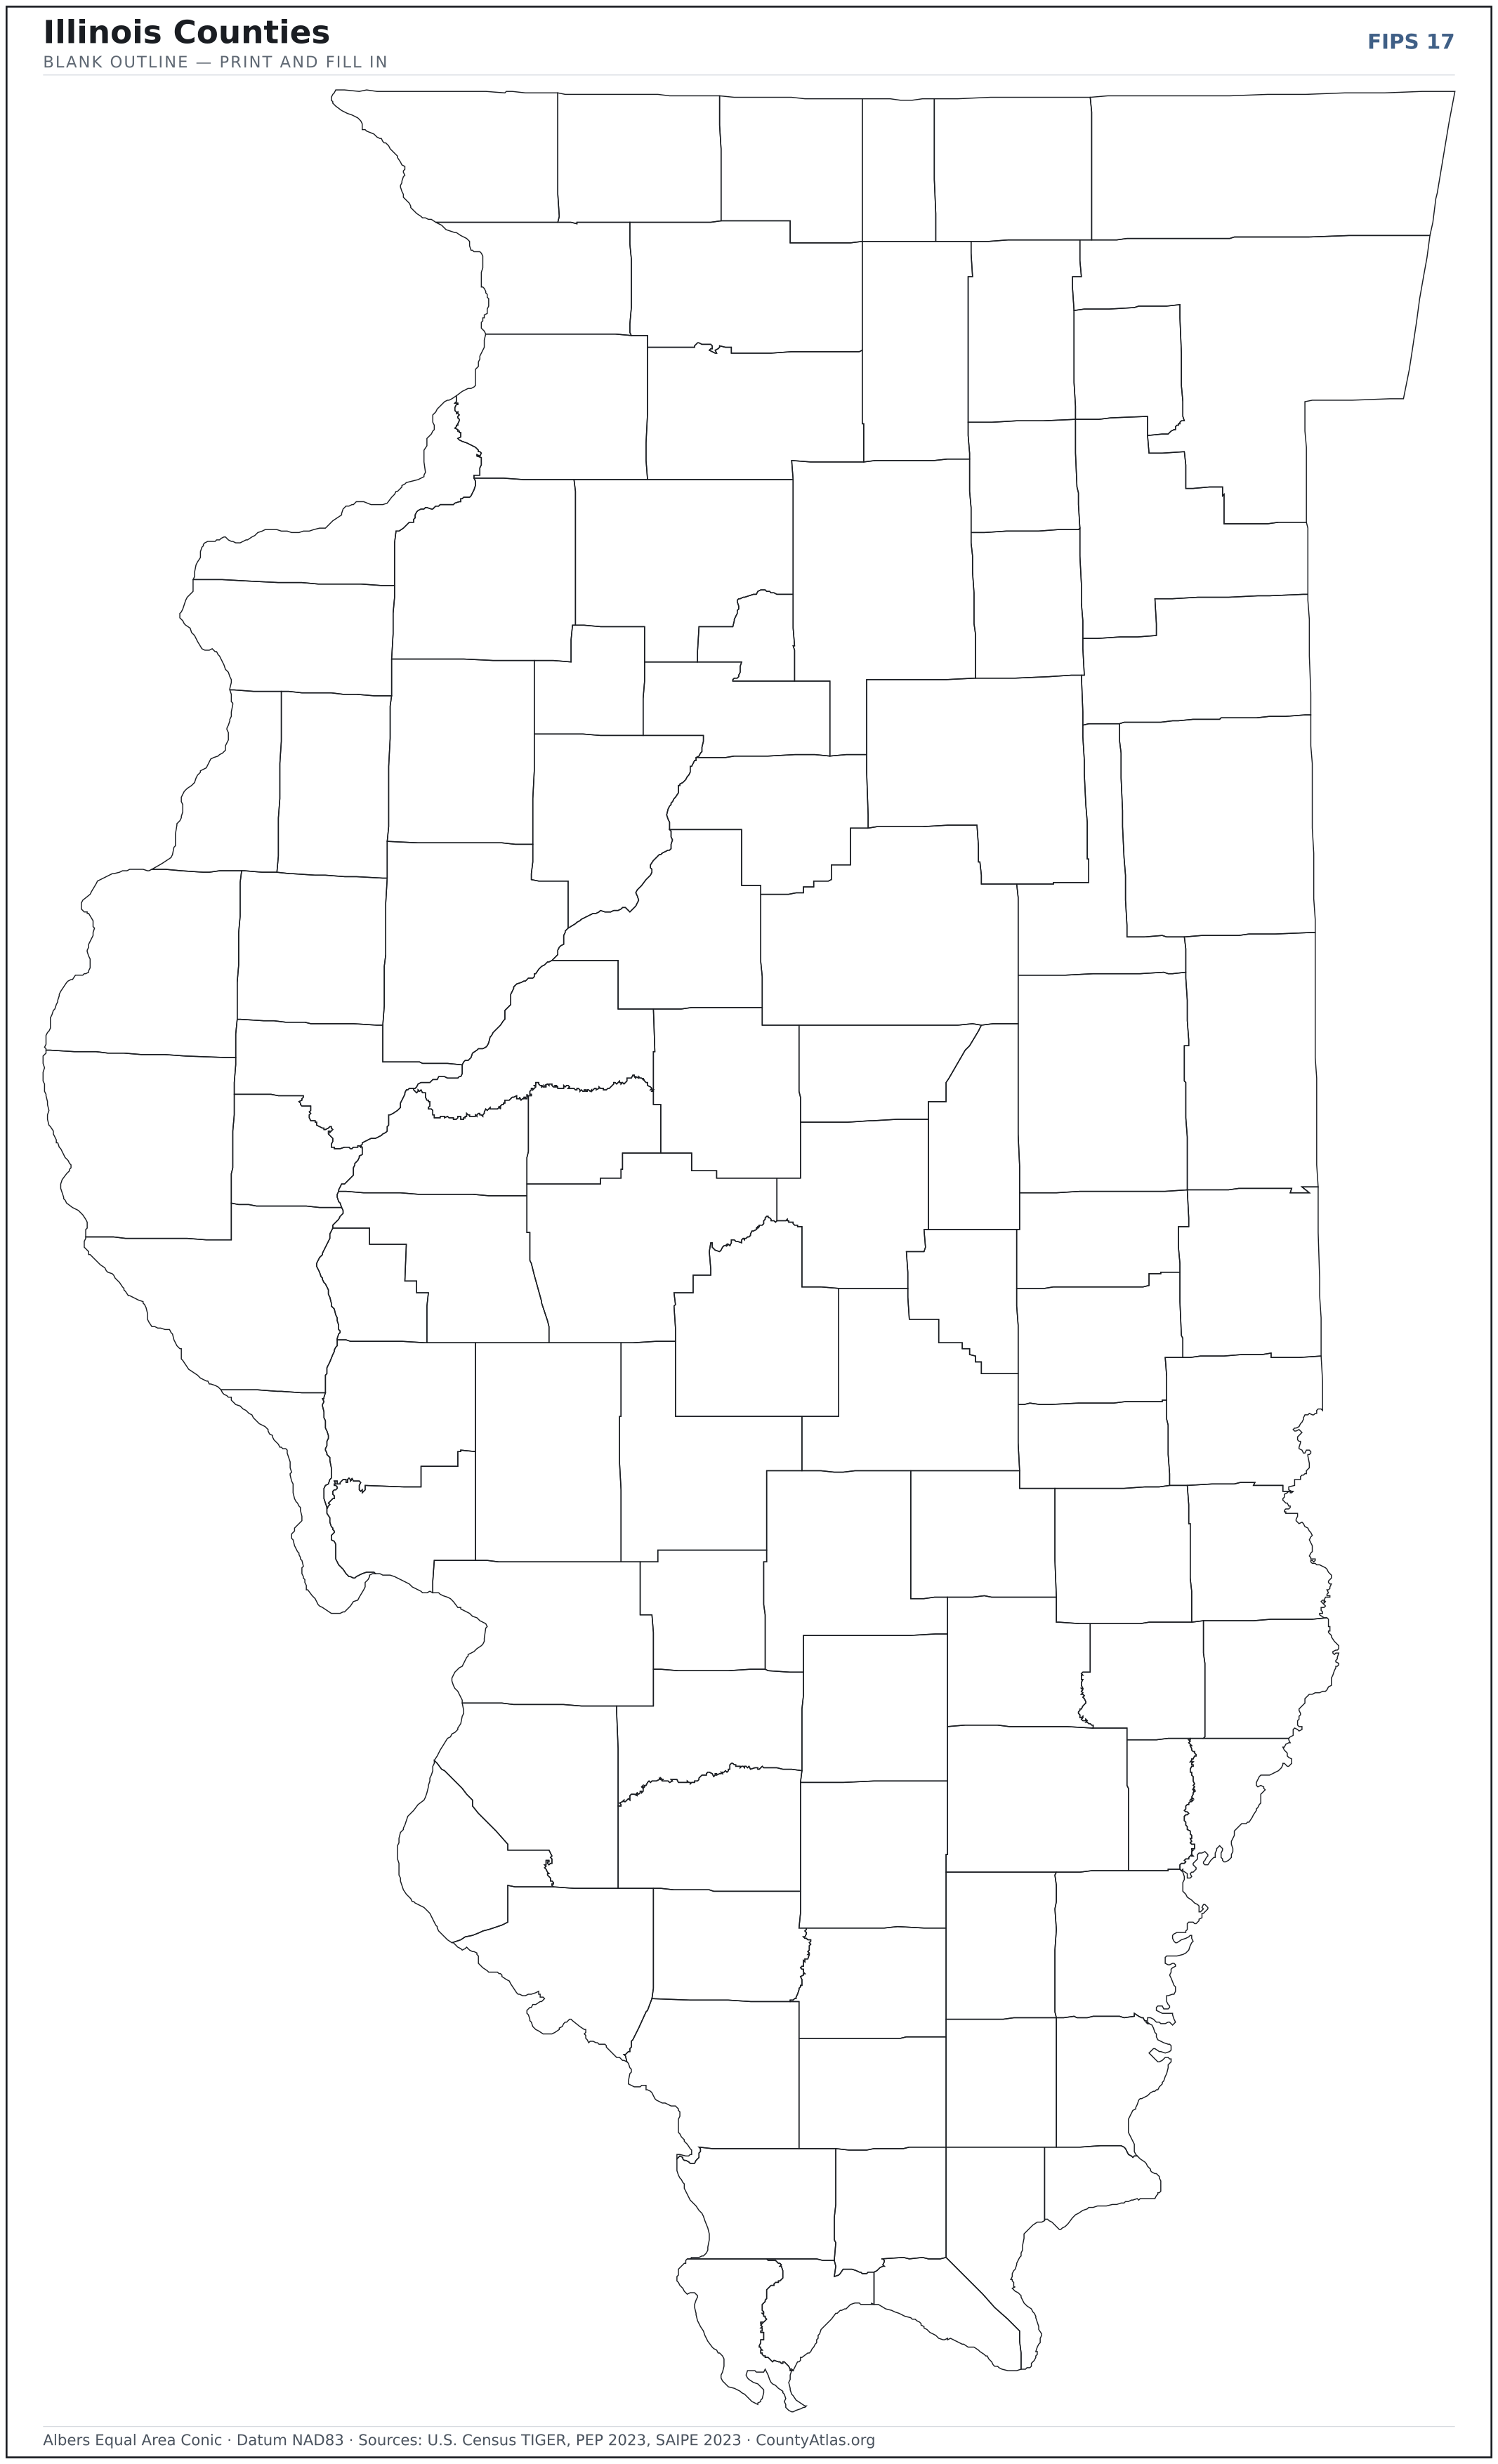
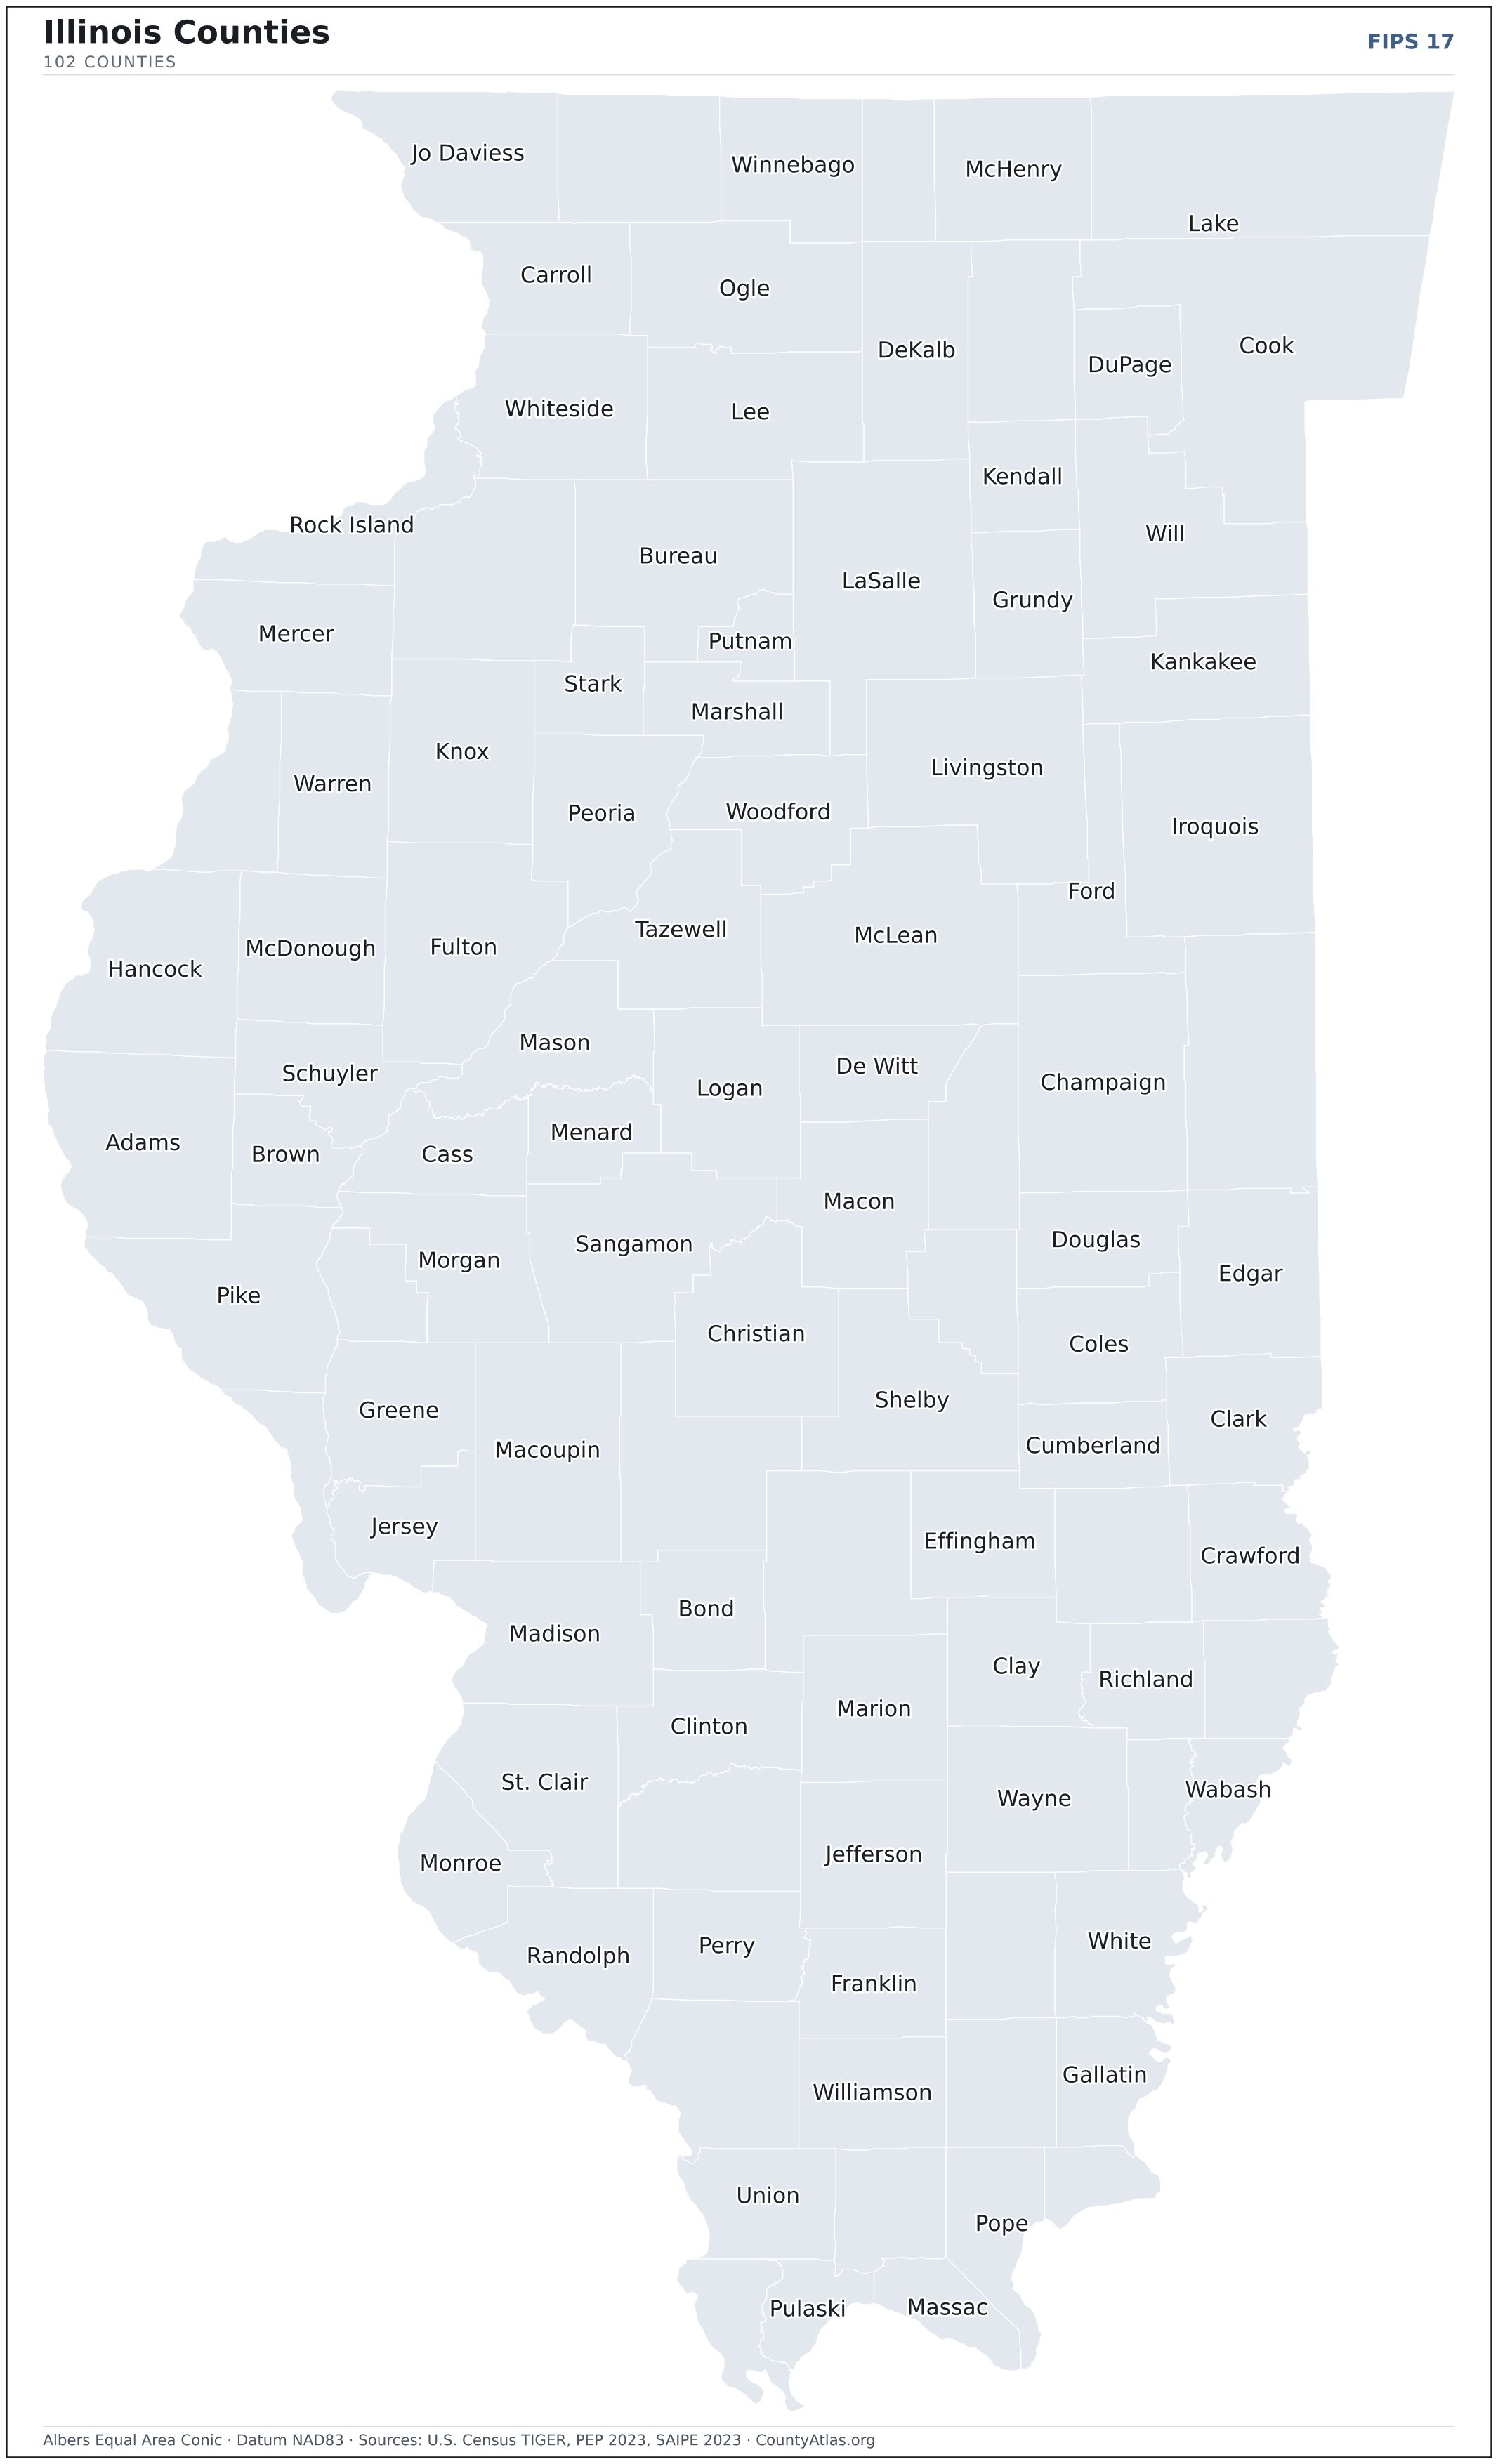
Download & print this Illinois map
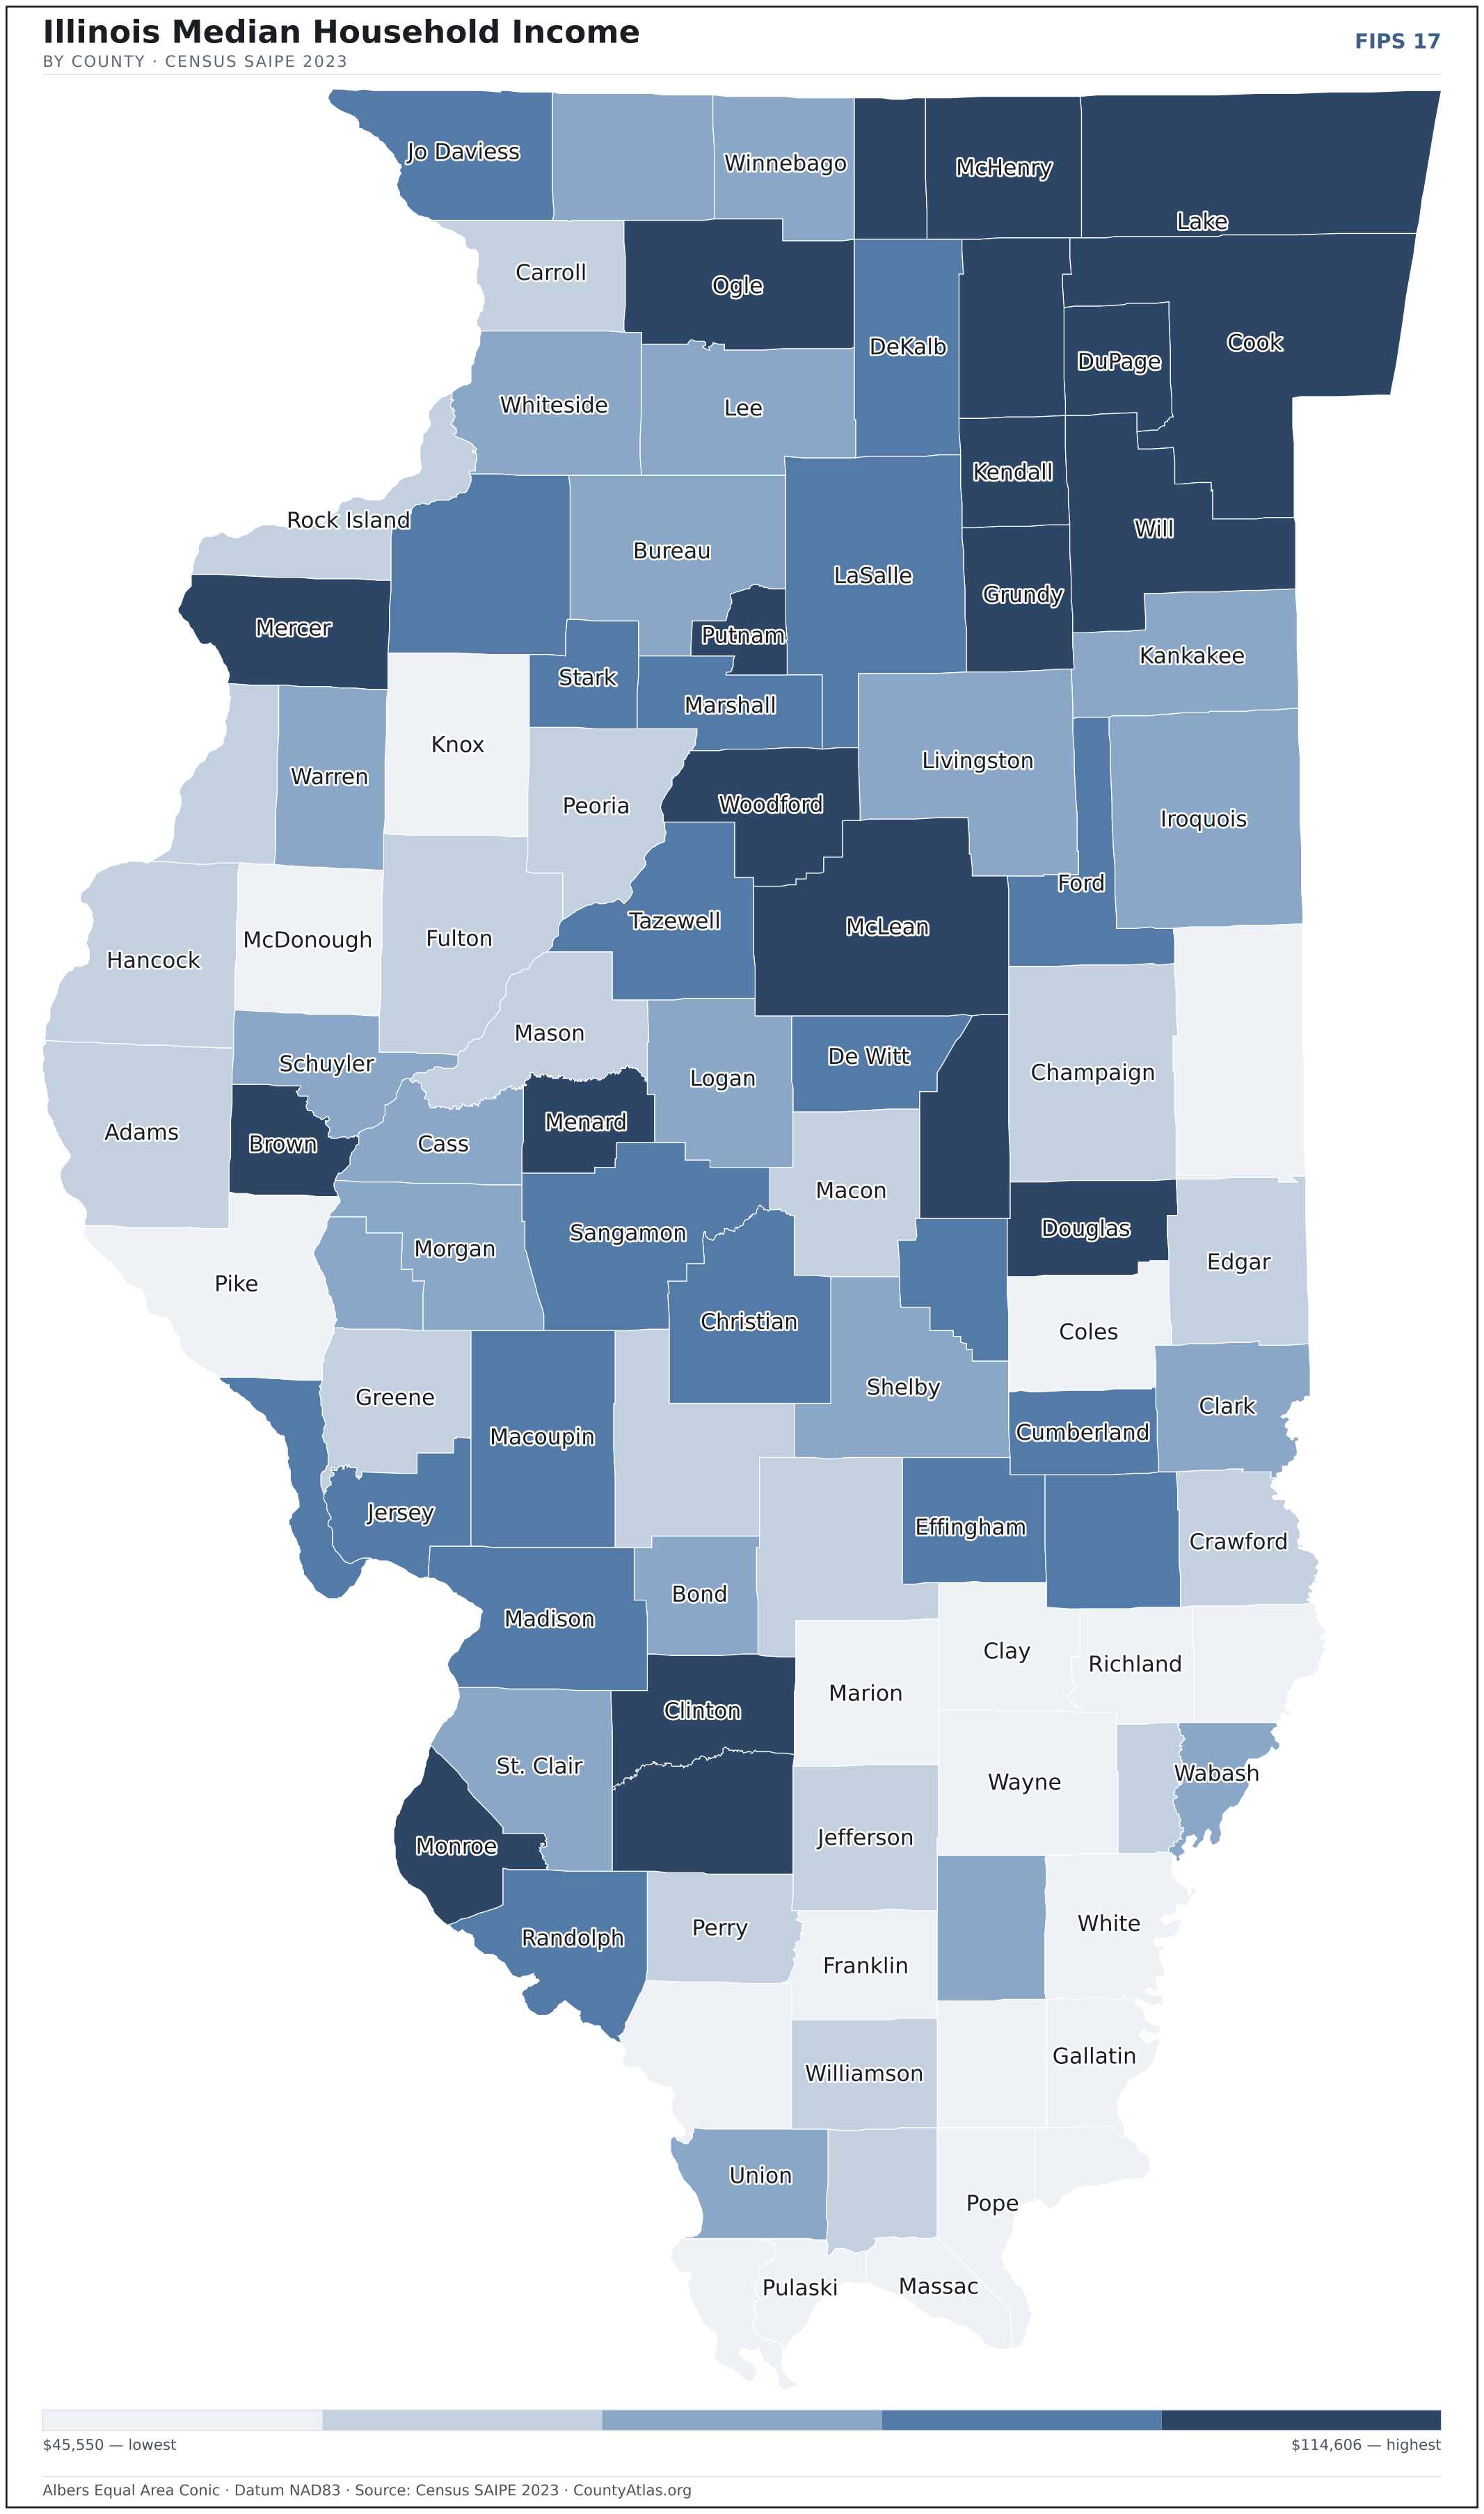
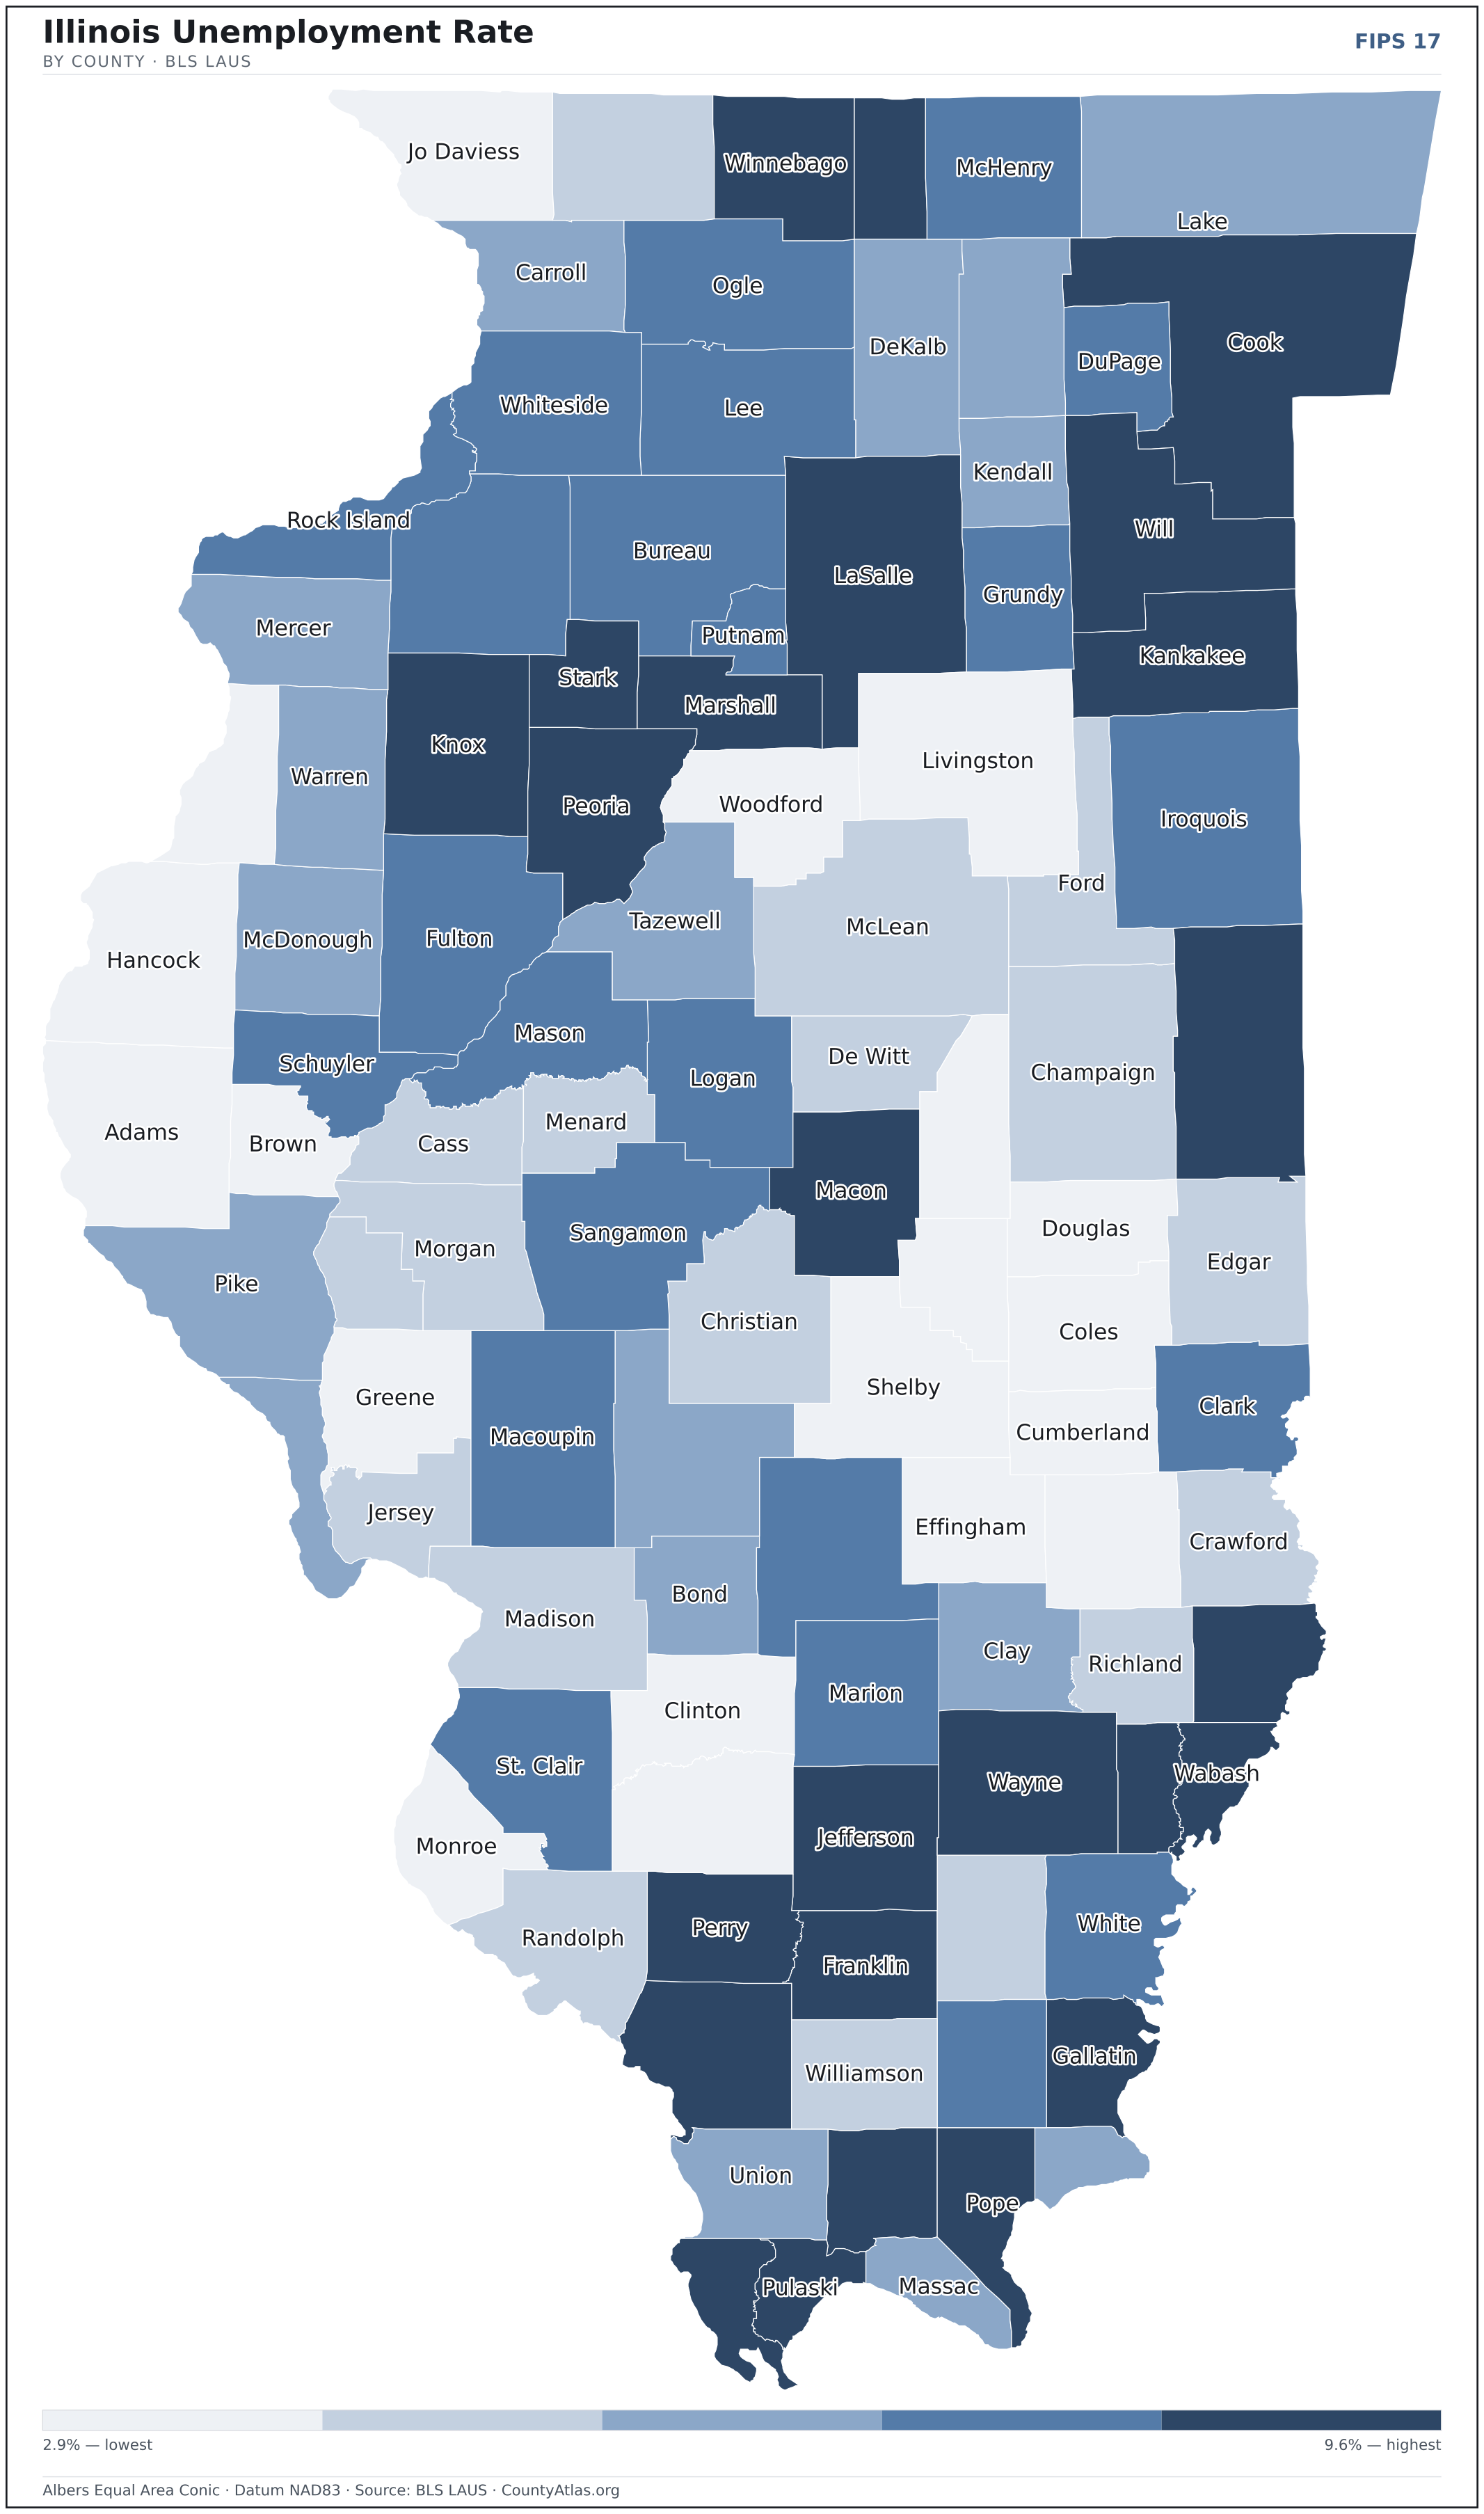
Illinois maps, coloured by the data
Cities in Illinois
Illinois has 1,294 incorporated cities, towns, and villages. The largest is Chicago in Cook County with 2,707,648 residents. Use the search on the map above to find any city and highlight the county it sits in.
| Chicago | Cook County | 2,707,648 |
| Aurora | Kane County | 179,867 |
| Joliet | Will County | 149,785 |
| Naperville | DuPage County | 149,424 |
| Rockford | Winnebago County | 147,649 |
| Elgin | Kane County | 114,106 |
| Springfield | Sangamon County | 113,714 |
| Peoria | Peoria County | 112,126 |
| Waukegan | Lake County | 88,919 |
| Champaign | Champaign County | 88,822 |
| Cicero (town) | Cook County | 83,223 |
| Bloomington | McLean County | 78,703 |
| Schaumburg (village) | Cook County | 76,780 |
| Evanston | Cook County | 76,552 |
| Arlington Heights (village) | Cook County | 76,220 |
| Bolingbrook (village) | Will County | 73,813 |
| Decatur | Macon County | 70,368 |
| Palatine (village) | Cook County | 66,548 |
| Skokie (village) | Cook County | 66,427 |
| Des Plaines | Cook County | 59,408 |
| Orland Park (village) | Cook County | 57,961 |
| Oak Lawn (village) | Cook County | 57,098 |
| Berwyn | Cook County | 55,888 |
| Mount Prospect (village) | Cook County | 55,648 |
| Tinley Park (village) | Cook County | 55,007 |
| Wheaton | DuPage County | 53,453 |
| Oak Park (village) | Cook County | 53,315 |
| Normal (town) | McLean County | 52,908 |
| Hoffman Estates (village) | Cook County | 51,186 |
| Downers Grove (village) | DuPage County | 49,867 |
| Glenview (village) | Cook County | 47,682 |
| Plainfield (village) | Will County | 45,705 |
| Elmhurst | DuPage County | 45,538 |
| Lombard (village) | DuPage County | 43,722 |
| Buffalo Grove (village) | Lake County | 42,824 |
| Moline | Rock Island County | 42,235 |
| Belleville | St. Clair County | 41,722 |
| Romeoville (village) | Will County | 40,996 |
| Bartlett (village) | DuPage County | 40,531 |
| DeKalb | DeKalb County | 40,464 |
| Crystal Lake | McHenry County | 40,436 |
| Carol Stream (village) | DuPage County | 39,427 |
| Park Ridge | Cook County | 39,241 |
| Quincy | Adams County | 39,188 |
| Streamwood (village) | Cook County | 39,055 |
| Wheeling (village) | Cook County | 38,495 |
| Urbana | Champaign County | 38,447 |
| Carpentersville (village) | Kane County | 37,544 |
| Hanover Park (village) | DuPage County | 36,850 |
| Rock Island | Rock Island County | 36,758 |
Showing the 50 most populous — and 1,244 more. Search the map above for any Illinois city or village.
A city can span more than one county; each is listed in its primary county — the one its center falls in.
Which Illinois county is the richest, largest, most crowded? The answers
- Illinois’s highest median household income is in Kendall County ($114,606); the lowest is in Alexander County ($45,550). Census SAIPE 2023
- Illinois’s most populous county is Cook County (5,087,072); the least populous is Hardin County (3,569) — a 1,425× spread. Census PEP 2023
- Illinois’s largest county by land area is McLean County (1,183 sq mi); the smallest is Putnam County (160 sq mi). Census TIGER
- Illinois’s highest population density is in Cook County (5,384/sq mi); the lowest is in Pope County (10/sq mi). Census PEP 2023 · TIGER
- Illinois’s highest poverty rate is in Alexander County (25.8%); the lowest is in Monroe County (4.9%). Census SAIPE 2023
- In Illinois, unemployment is highest in Edwards County (9.6%) and lowest in Brown County (2.9%), for May 2026. BLS LAUS
- Illinois’s highest median age is in Hardin County (55.0); the lowest is in Champaign County (30.9). Census ACS 2019–2023
- Illinois’s highest share of bachelor’s degrees is in DuPage County (51.4% of adults); the lowest is in Pulaski County (11.9%). Census ACS 2019–2023
Every figure is a current official estimate from the source named — not a crowd-sourced or copied value. Suppressed estimates (coefficient of variation ≥ 0.30) are omitted, never guessed. See the full methodology.
Illinois counties: common questions
How many counties are in Illinois?
Illinois has 102 counties covering 55,514 sq mi and about 12.5M residents. Every one is on the map above and in the table below.
What is the largest county in Illinois?
It depends on the measure. By land area it’s McLean County (1,183 sq mi); by population it’s Cook County (5,087,072 residents).
What county is Chicago in?
Chicago (population 2,707,648) is in Cook County. Use the search on the map to find any Illinois city’s county.
What is the richest county in Illinois?
By median household income, Kendall County is the richest at $114,606; the poorest is Alexander County at $45,550 (Census SAIPE 2023).
What is the most populous county in Illinois?
Cook County, with 5,087,072 residents — about 40.5% of Illinois’s people, and 1,425× the least populous, Hardin County (3,569).
Sources & vintages
- Population — PEP Vintage 2023 (July 1, 2023) — pep/charv
- Median household income & poverty — SAIPE 2023
- Unemployment — BLS LAUS May 2026 (preliminary)
- Geometry & boundaries — Census TIGERweb
- Cities & city population — Census TIGERweb Incorporated Places + ACS 5-year 2019–2023
Data current through .