CountyAtlas Indiana
Indiana County Map with Cities — All 92 Counties
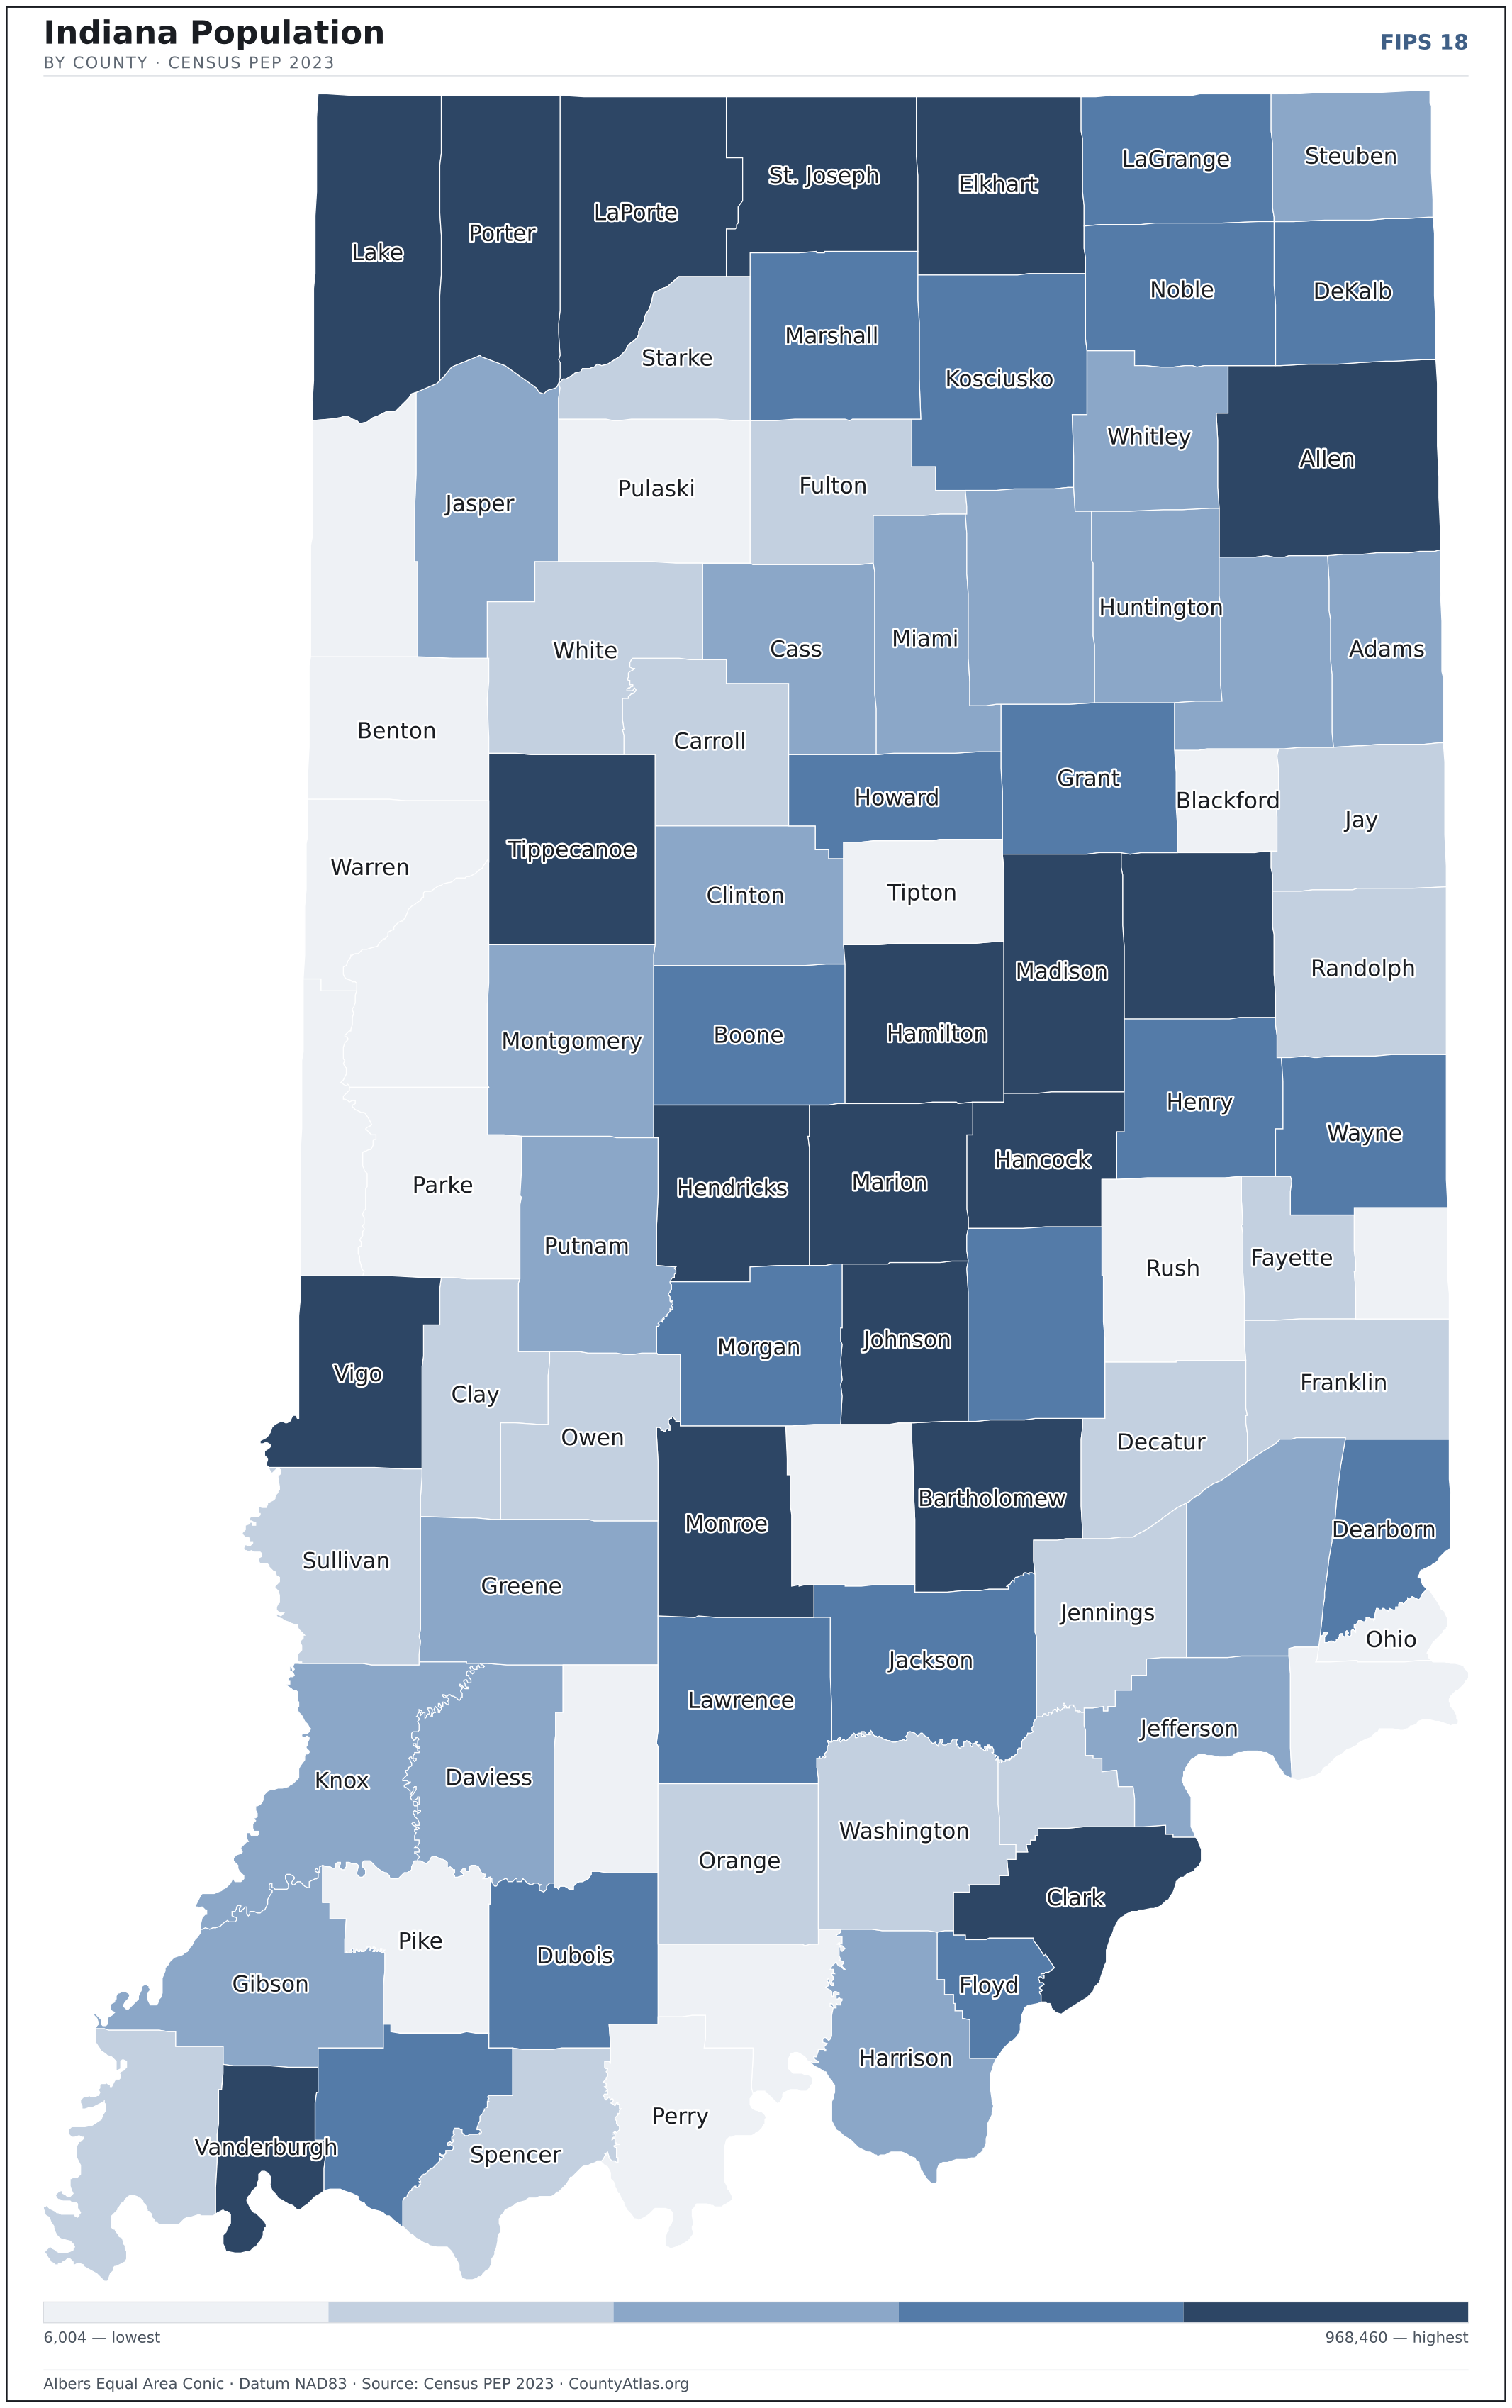
All 92 of Indiana's counties, mapped from official U.S. Census boundaries with population, income, and unemployment for every one. Colour the map by any measure, tap a county for its data, or download a print-ready copy.
Tap any county for its population, income, and more.
Indiana at a glance
- Scale. Indiana is divided into 92 counties across 35,825 sq mi of land — an average of 389 sq mi each. Census TIGER
- People. Its counties are home to 6,862,199 residents — an average of 74,589 each, or 192 per square mile statewide. Census PEP 2023
- Water. Another 596 sq mi is water — 1.6% of the state’s area, led by Lake County. Census TIGER
Indiana’s 92 counties, by the numbers
Every county’s population, median household income, unemployment, density, and land area — sortable by any column, so you can find yours or rank by what matters to you. A few patterns run through the data:
- Concentrated. Half of Indiana’s 6,862,199 residents live in just 10 of 92 counties, and the five largest hold 36.5% of the total. Census PEP 2023
- Income tracks poverty. The gap from richest to poorest runs 2.4×, and the 10 highest-income counties average 7.2% in poverty against 16.7% for the 10 lowest. Census SAIPE 2023
- Mostly small. Half of Indiana’s counties have fewer than 34,830 residents, and half report a median household income below $66,685 — a few metros lift the statewide totals well above both. Census PEP 2023 · SAIPE 2023
- Lopsided density. Only 20 of 92 counties are denser than Indiana’s statewide average of 192 people per square mile — the rest are more rural. Census PEP 2023 · TIGER
| Adams County | 36,288 | $66,567 | 3.0% | 107/sq mi | 339 sq mi | Decatur |
| Allen County | 394,545 | $66,194 | 3.0% | 600/sq mi | 657 sq mi | Fort Wayne |
| Bartholomew County | 84,003 | $79,870 | 3.1% | 206/sq mi | 407 sq mi | Columbus |
| Benton County | 8,729 | $64,671 | 2.6% | 21/sq mi | 406 sq mi | Fowler |
| Blackford County | 11,893 | $51,799 | 3.5% | 72/sq mi | 165 sq mi | Hartford City |
| Boone County | 76,120 | $103,970 | 2.7% | 180/sq mi | 423 sq mi | Lebanon |
| Brown County | 15,653 | $72,141 | 3.1% | 50/sq mi | 312 sq mi | Nashville |
| Carroll County | 20,525 | $71,740 | 2.7% | 55/sq mi | 372 sq mi | Delphi |
| Cass County | 37,666 | $54,436 | 3.4% | 91/sq mi | 412 sq mi | Logansport |
| Clark County | 125,467 | $71,718 | 3.6% | 337/sq mi | 372 sq mi | Jeffersonville |
| Clay County | 26,460 | $62,834 | 3.1% | 74/sq mi | 358 sq mi | Brazil |
| Clinton County | 32,730 | $66,119 | 2.7% | 81/sq mi | 405 sq mi | Frankfort |
| Crawford County | 10,438 | $56,019 | 3.6% | 34/sq mi | 306 sq mi | English |
| Daviess County | 33,656 | $76,778 | 2.7% | 78/sq mi | 430 sq mi | Washington |
| Dearborn County | 51,215 | $82,578 | 3.2% | 168/sq mi | 305 sq mi | Lawrenceburg |
| Decatur County | 26,399 | $71,150 | 2.9% | 71/sq mi | 373 sq mi | Greensburg |
| DeKalb County | 44,198 | $68,933 | 2.9% | 122/sq mi | 363 sq mi | Auburn |
| Delaware County | 112,321 | $55,704 | 3.7% | 286/sq mi | 392 sq mi | Muncie |
| Dubois County | 43,546 | $74,001 | 2.9% | 102/sq mi | 427 sq mi | Jasper |
| Elkhart County | 206,409 | $69,262 | 3.3% | 446/sq mi | 463 sq mi | Goshen |
| Fayette County | 23,362 | $60,483 | 3.7% | 109/sq mi | 215 sq mi | Connersville |
| Floyd County | 80,809 | $79,008 | 3.5% | 544/sq mi | 148 sq mi | New Albany |
| Fountain County | 16,731 | $63,747 | 2.9% | 42/sq mi | 396 sq mi | Covington |
| Franklin County | 23,096 | $77,456 | 3.1% | 60/sq mi | 384 sq mi | Brookville |
| Fulton County | 20,358 | $60,258 | 3.3% | 55/sq mi | 368 sq mi | Rochester |
| Gibson County | 32,904 | $67,497 | 2.7% | 68/sq mi | 487 sq mi | Princeton |
| Grant County | 66,200 | $53,872 | 3.5% | 160/sq mi | 414 sq mi | Marion |
| Greene County | 31,196 | $59,626 | 3.2% | 58/sq mi | 542 sq mi | Bloomfield |
| Hamilton County | 371,645 | $121,231 | 2.7% | 942/sq mi | 394 sq mi | Noblesville |
| Hancock County | 86,166 | $94,581 | 2.8% | 282/sq mi | 306 sq mi | Greenfield |
| Harrison County | 40,006 | $75,443 | 3.5% | 83/sq mi | 484 sq mi | Corydon |
| Hendricks County | 186,387 | $95,323 | 2.7% | 458/sq mi | 407 sq mi | Danville |
| Henry County | 48,929 | $62,048 | 3.0% | 125/sq mi | 392 sq mi | New Castle |
| Howard County | 83,831 | $61,548 | 4.8% | 286/sq mi | 293 sq mi | Kokomo |
| Huntington County | 36,781 | $67,462 | 2.7% | 96/sq mi | 383 sq mi | Huntington |
| Jackson County | 46,460 | $69,753 | 2.9% | 91/sq mi | 510 sq mi | Brownstown |
| Jasper County | 33,535 | $75,027 | 3.3% | 60/sq mi | 560 sq mi | Rensselaer |
| Jay County | 20,032 | $61,030 | 2.9% | 52/sq mi | 384 sq mi | Portland |
| Jefferson County | 33,056 | $62,153 | 3.3% | 92/sq mi | 361 sq mi | Madison |
| Jennings County | 27,622 | $61,695 | 2.8% | 73/sq mi | 377 sq mi | Vernon |
| Johnson County | 167,819 | $91,676 | 2.8% | 524/sq mi | 320 sq mi | Franklin |
| Knox County | 36,070 | $57,242 | 3.1% | 70/sq mi | 516 sq mi | Vincennes |
| Kosciusko County | 80,364 | $72,726 | 3.0% | 151/sq mi | 531 sq mi | Warsaw |
| LaGrange County | 40,907 | $81,738 | 2.8% | 108/sq mi | 380 sq mi | Lagrange |
| Lake County | 500,598 | $69,182 | 4.3% | 1,003/sq mi | 499 sq mi | Crown Point |
| LaPorte County | 111,706 | $64,204 | 3.4% | 187/sq mi | 598 sq mi | La Porte |
| Lawrence County | 45,084 | $64,958 | 3.1% | 100/sq mi | 449 sq mi | Bedford |
| Madison County | 132,504 | $62,000 | 3.3% | 293/sq mi | 452 sq mi | Anderson |
| Marion County | 968,460 | $66,653 | 3.3% | 2,446/sq mi | 396 sq mi | Indianapolis city (balance) |
| Marshall County | 46,352 | $70,390 | 3.0% | 104/sq mi | 444 sq mi | Plymouth |
| Martin County | 9,897 | $60,862 | 2.9% | 29/sq mi | 336 sq mi | Shoals |
| Miami County | 35,402 | $59,297 | 3.5% | 95/sq mi | 374 sq mi | Peru |
| Monroe County | 139,342 | $60,553 | 3.3% | 353/sq mi | 395 sq mi | Bloomington |
| Montgomery County | 38,573 | $69,928 | 2.7% | 76/sq mi | 505 sq mi | Crawfordsville |
| Morgan County | 73,227 | $74,193 | 3.0% | 181/sq mi | 404 sq mi | Martinsville |
| Newton County | 13,960 | $70,836 | 3.2% | 35/sq mi | 402 sq mi | Kentland |
| Noble County | 47,430 | $66,072 | 3.1% | 115/sq mi | 411 sq mi | Albion |
| Ohio County | 6,004 | $70,757 | 3.2% | 70/sq mi | 86 sq mi | Rising Sun |
| Orange County | 19,638 | $59,750 | 3.1% | 49/sq mi | 398 sq mi | Paoli |
| Owen County | 21,532 | $62,247 | 3.2% | 56/sq mi | 385 sq mi | Spencer |
| Parke County | 16,484 | $70,989 | 3.4% | 37/sq mi | 445 sq mi | Rockville |
| Perry County | 19,209 | $63,098 | 3.1% | 50/sq mi | 382 sq mi | Tell City |
| Pike County | 12,106 | $66,716 | 3.2% | 36/sq mi | 334 sq mi | Petersburg |
| Porter County | 175,335 | $79,398 | 3.5% | 419/sq mi | 418 sq mi | Valparaiso |
| Posey County | 25,040 | $76,228 | 2.9% | 61/sq mi | 409 sq mi | Mount Vernon |
| Pulaski County | 12,385 | $70,303 | 2.3% | 29/sq mi | 434 sq mi | Winamac |
| Putnam County | 37,567 | $73,137 | 3.0% | 78/sq mi | 481 sq mi | Greencastle |
| Randolph County | 24,216 | $58,725 | 3.1% | 54/sq mi | 452 sq mi | Winchester |
| Ripley County | 29,227 | $66,942 | 2.9% | 65/sq mi | 446 sq mi | Versailles |
| Rush County | 16,847 | $65,326 | 3.0% | 41/sq mi | 408 sq mi | Rushville |
| Scott County | 24,657 | $62,584 | 3.8% | 130/sq mi | 190 sq mi | Scottsburg |
| Shelby County | 45,231 | $71,548 | 2.9% | 110/sq mi | 411 sq mi | Shelbyville |
| Spencer County | 19,910 | $77,467 | 2.8% | 50/sq mi | 397 sq mi | Rockport |
| St. Joseph County | 272,848 | $65,977 | 3.6% | 596/sq mi | 458 sq mi | South Bend |
| Starke County | 23,206 | $61,259 | 3.8% | 75/sq mi | 309 sq mi | Knox |
| Steuben County | 34,917 | $71,355 | 3.1% | 113/sq mi | 309 sq mi | Angola |
| Sullivan County | 20,757 | $59,148 | 2.9% | 46/sq mi | 447 sq mi | Sullivan |
| Switzerland County | 10,019 | $60,219 | 3.5% | 45/sq mi | 221 sq mi | Vevay |
| Tippecanoe County | 188,792 | $61,681 | 3.0% | 378/sq mi | 499 sq mi | Lafayette |
| Tipton County | 15,256 | $76,188 | 3.2% | 59/sq mi | 261 sq mi | Tipton |
| Union County | 6,973 | $64,648 | 2.6% | 43/sq mi | 161 sq mi | Liberty |
| Vanderburgh County | 179,810 | $60,923 | 3.2% | 770/sq mi | 233 sq mi | Evansville |
| Vermillion County | 15,417 | $58,743 | 3.5% | 60/sq mi | 257 sq mi | Newport |
| Vigo County | 106,153 | $50,665 | 3.4% | 263/sq mi | 404 sq mi | Terre Haute |
| Wabash County | 30,670 | $60,668 | 3.0% | 74/sq mi | 413 sq mi | Wabash |
| Warren County | 8,518 | $74,750 | 2.8% | 23/sq mi | 365 sq mi | Williamsport |
| Warrick County | 65,867 | $87,293 | 2.9% | 171/sq mi | 385 sq mi | Boonville |
| Washington County | 28,205 | $55,682 | 3.2% | 55/sq mi | 514 sq mi | Salem |
| Wayne County | 66,127 | $52,956 | 3.3% | 165/sq mi | 402 sq mi | Richmond |
| Wells County | 28,555 | $69,833 | 2.5% | 78/sq mi | 368 sq mi | Bluffton |
| White County | 24,917 | $67,077 | 2.9% | 49/sq mi | 505 sq mi | Monticello |
| Whitley County | 34,742 | $76,326 | 2.7% | 104/sq mi | 336 sq mi | Columbia City |
All 92 counties, sortable by any column — click a heading. A suppressed estimate (coefficient of variation ≥ 0.30) shows a marker, never a guess. County seats are from Wikidata (CC0), each validated to a Census place inside its county; a county with no validated seat is left blank. See the methodology.
Download & print this Indiana map
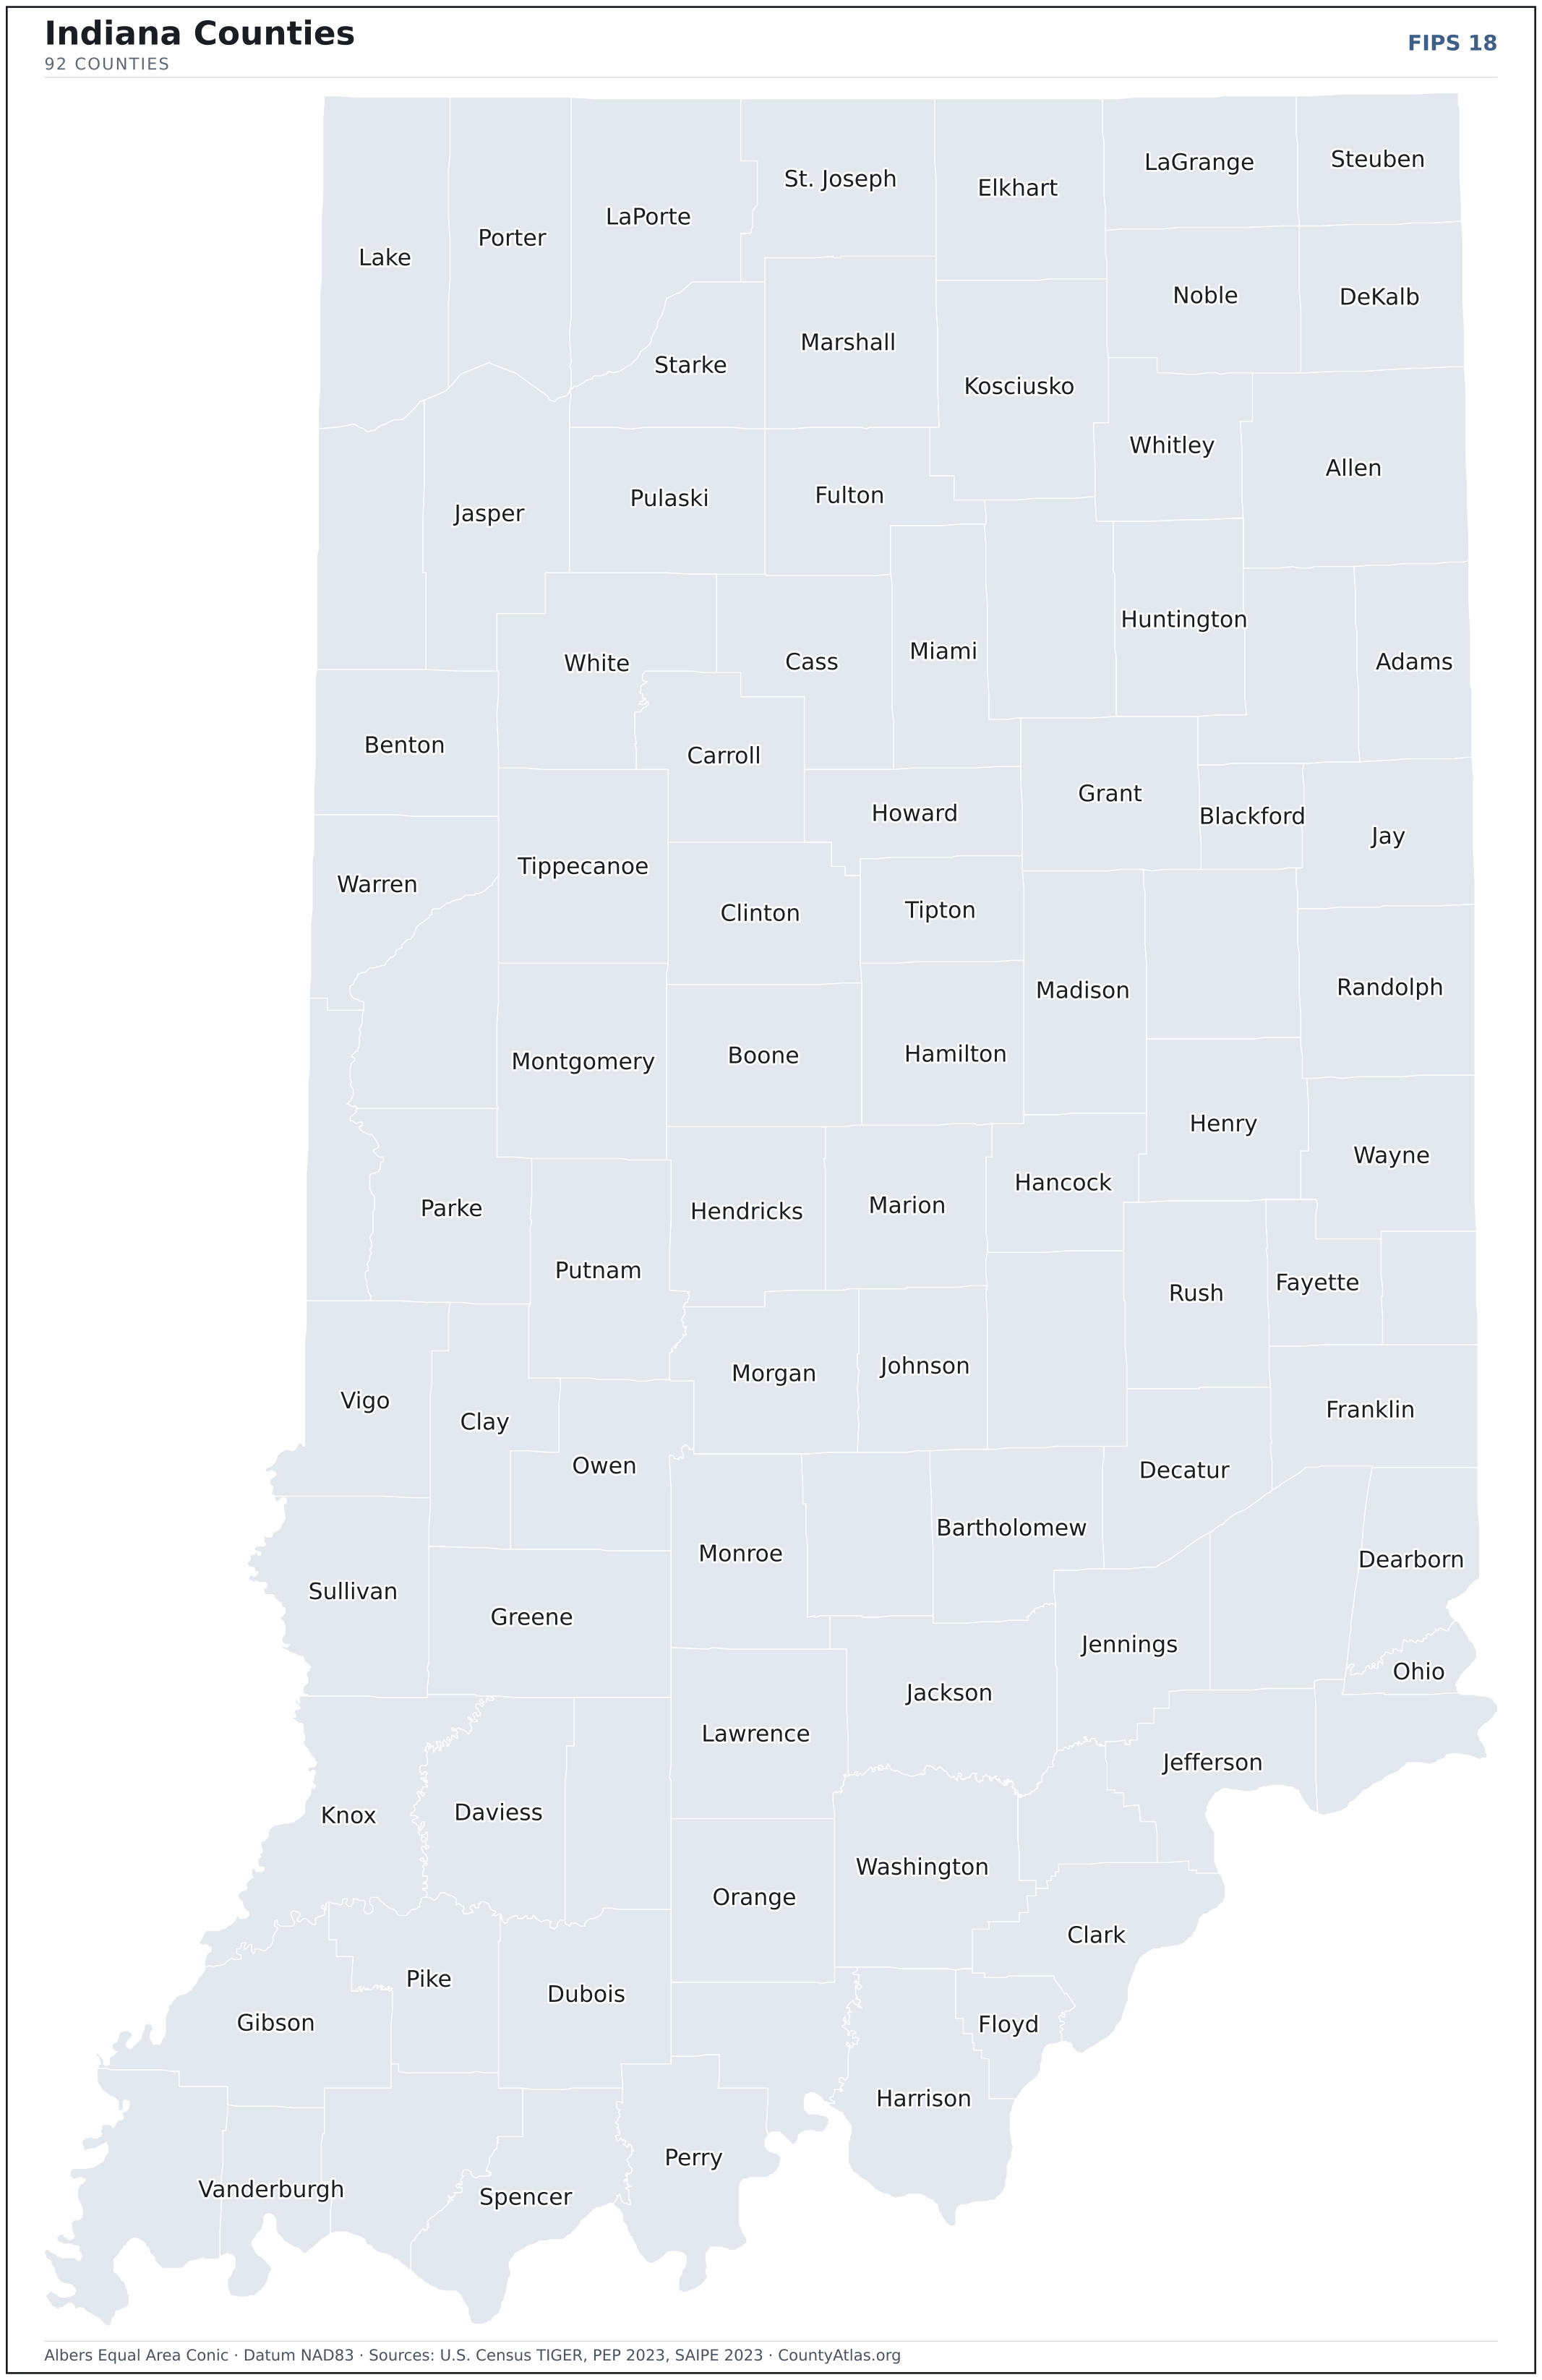
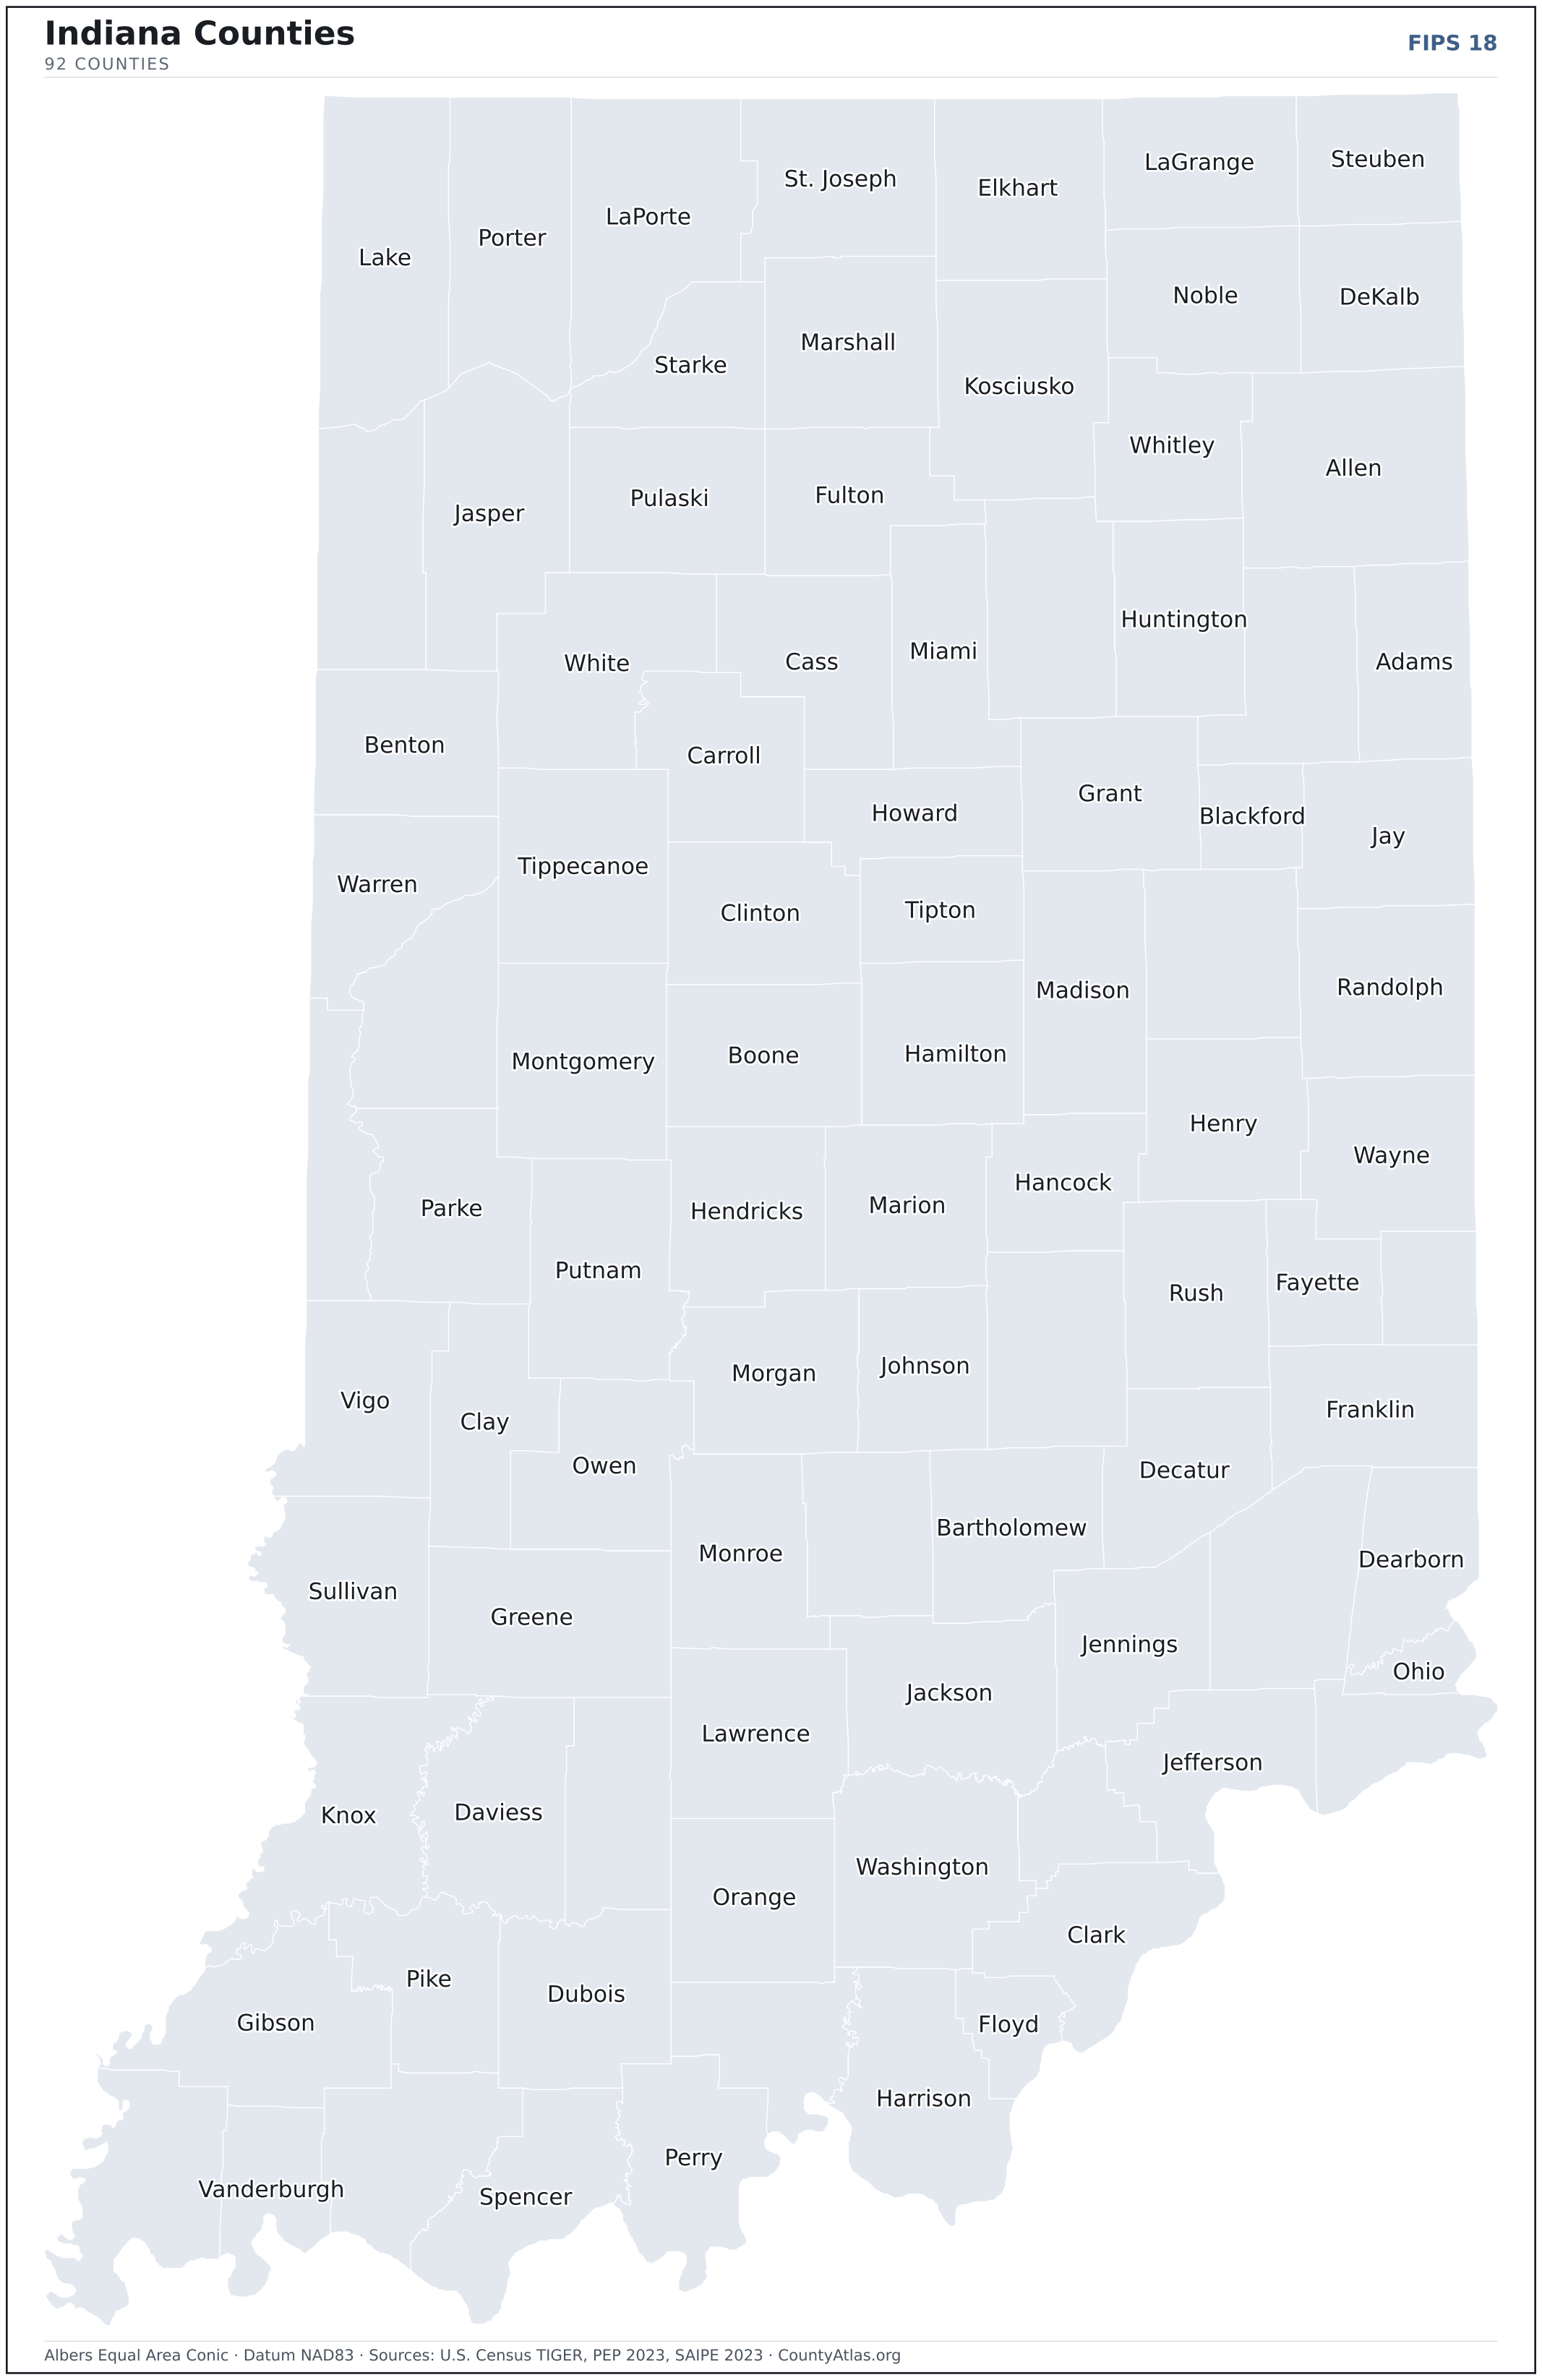
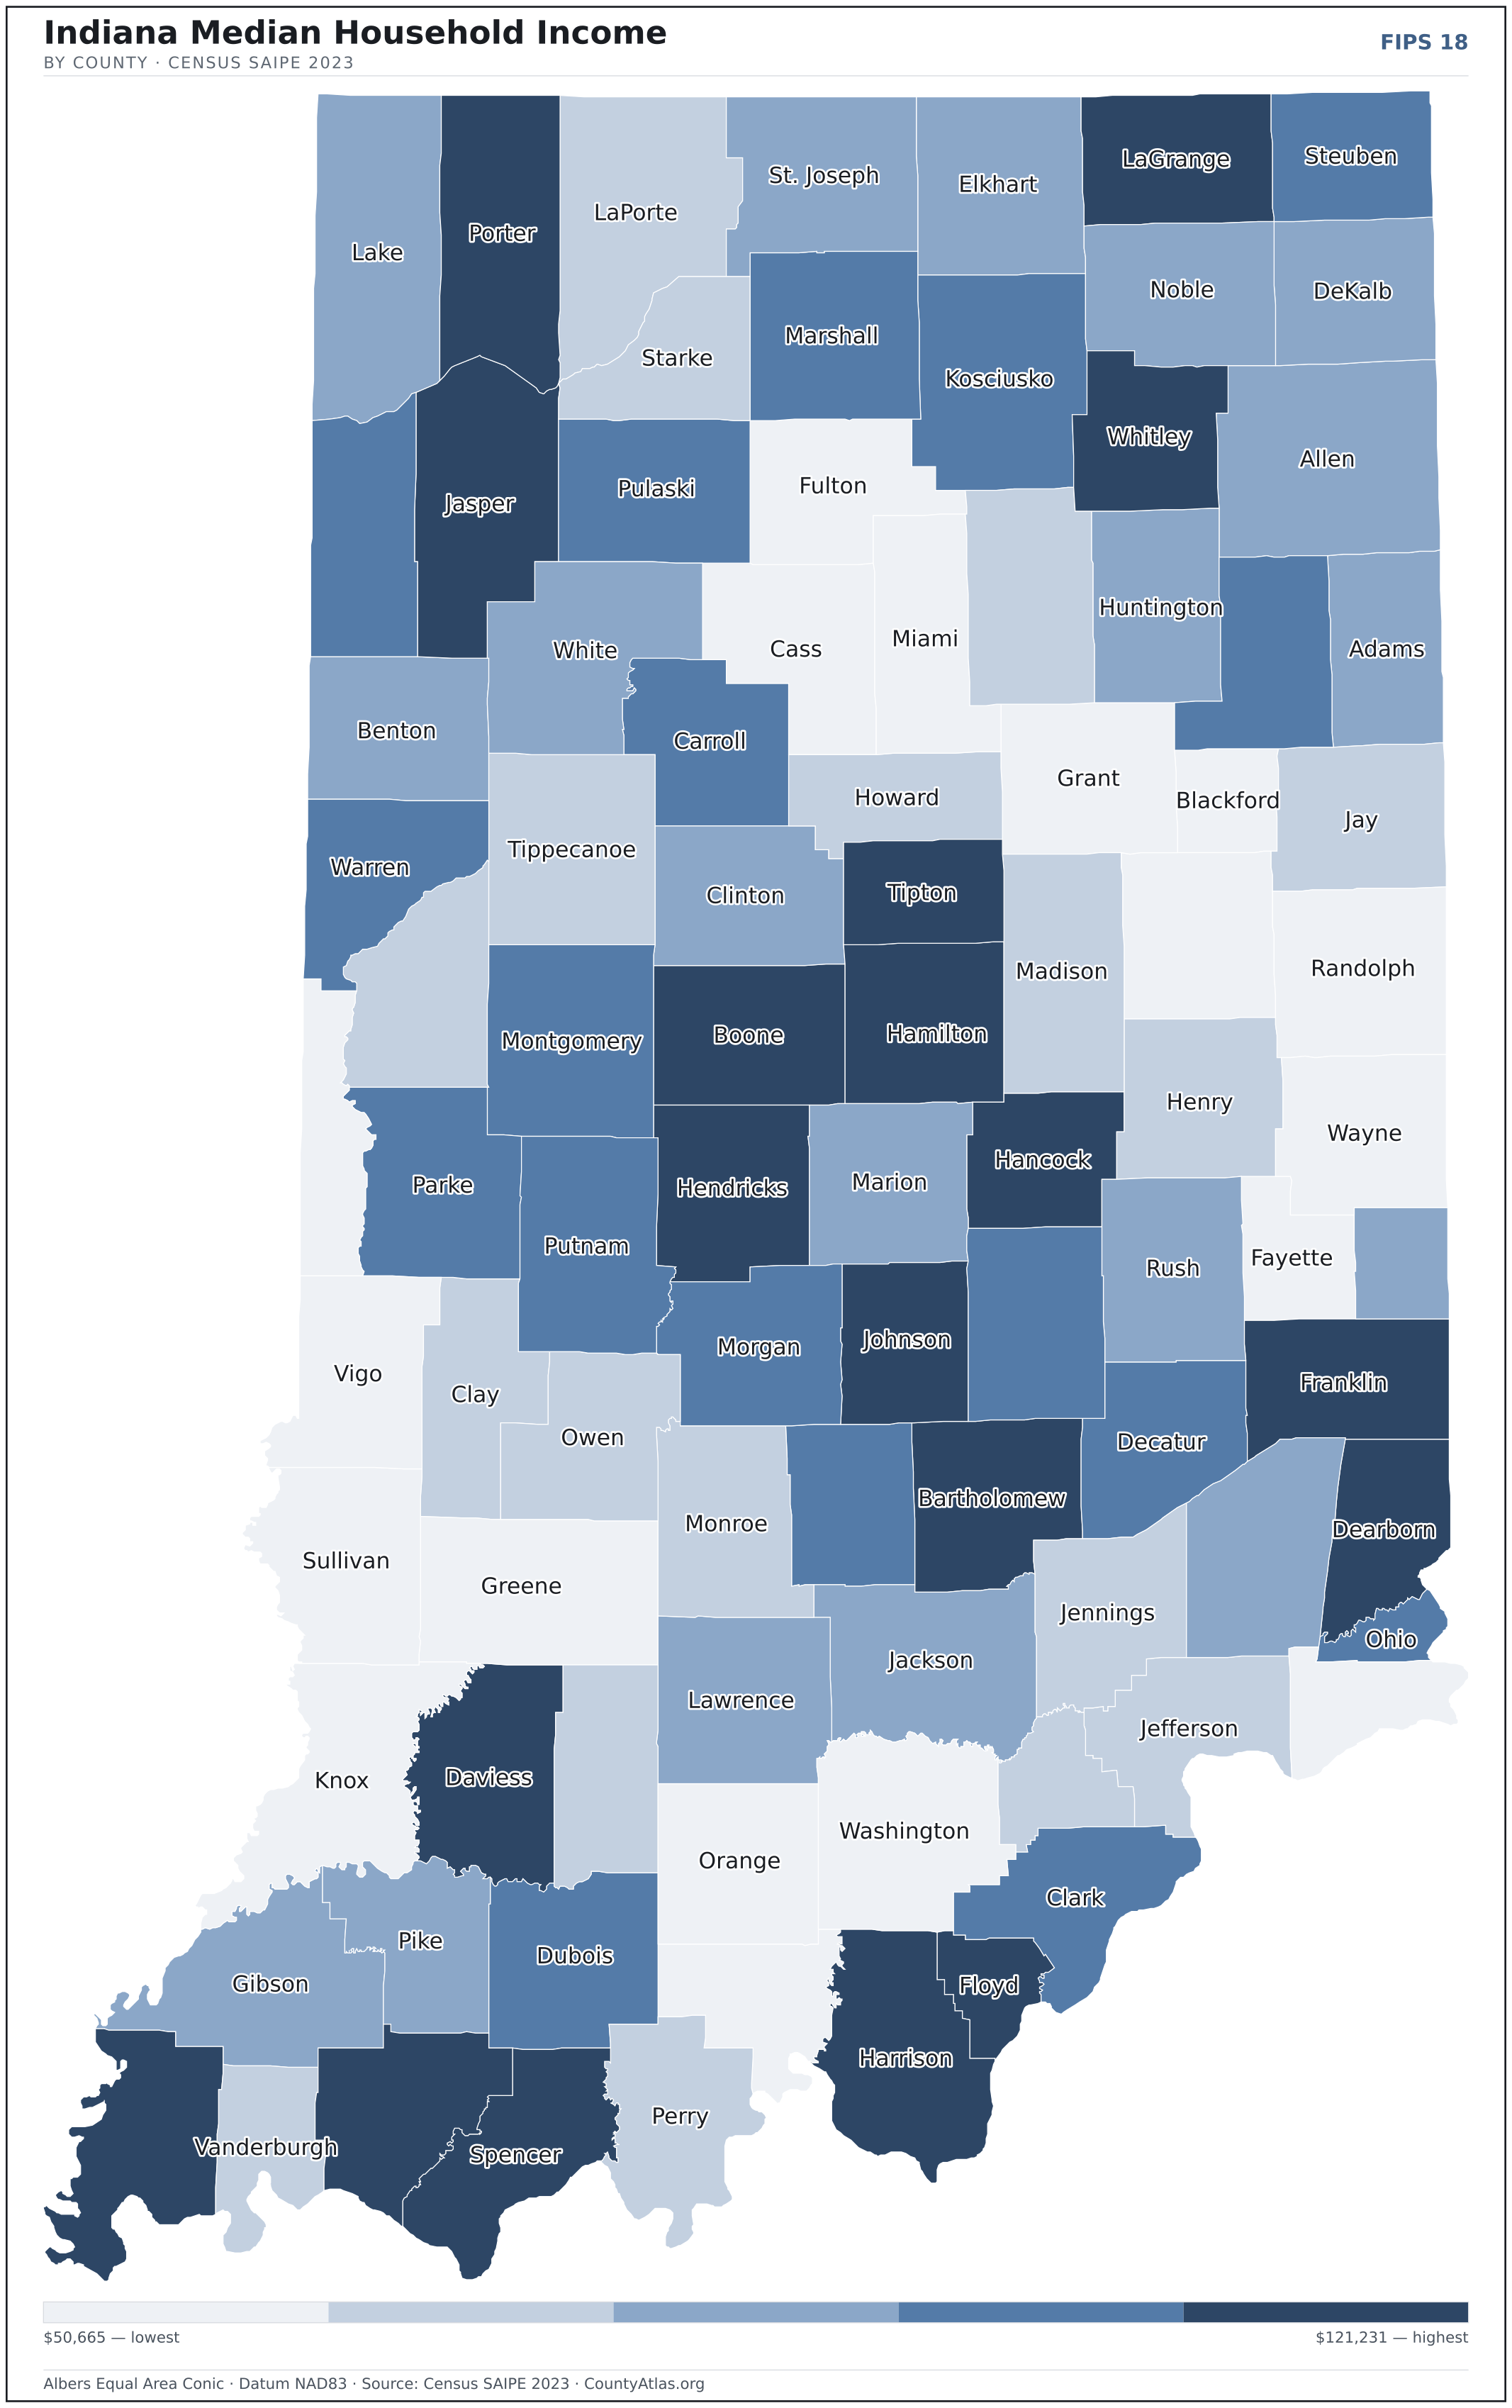
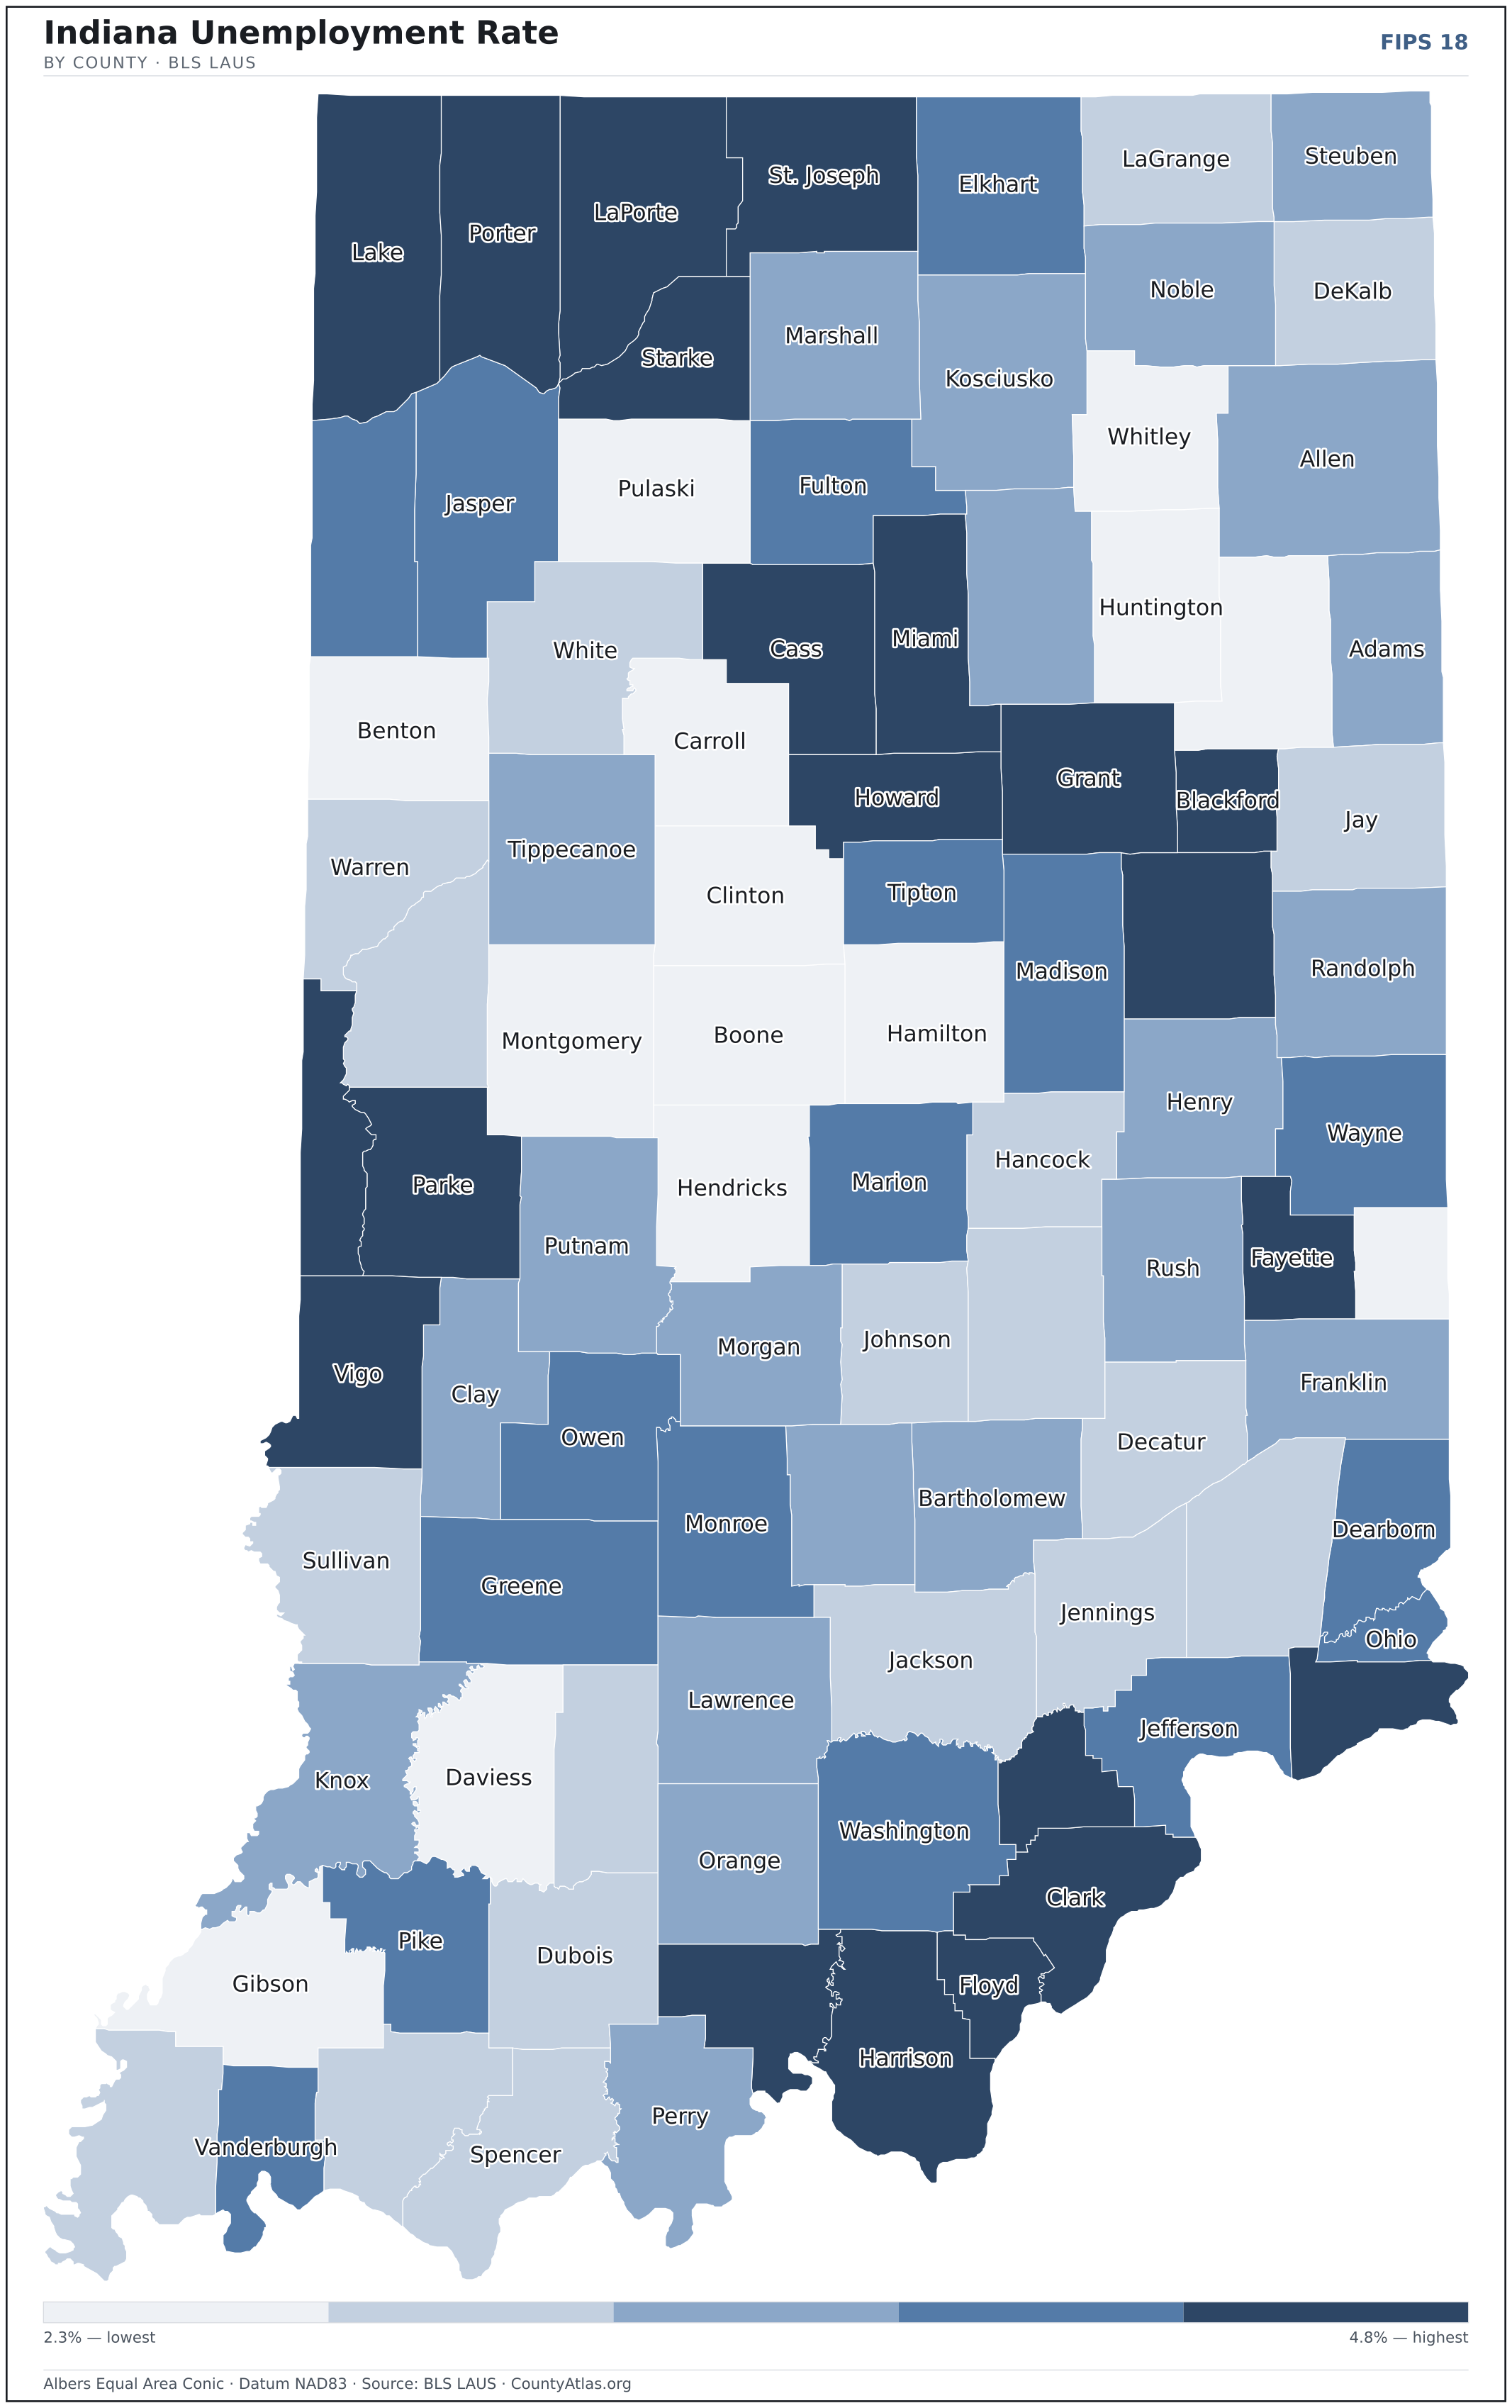
Indiana maps, coloured by the data
Cities in Indiana
Indiana has 566 incorporated cities and towns. The largest is Indianapolis city (balance) in Marion County with 882,043 residents. Use the search on the map above to find any city and highlight the county it sits in.
| Indianapolis city (balance) | Marion County | 882,043 |
| Fort Wayne | Allen County | 266,235 |
| Evansville | Vanderburgh County | 116,441 |
| South Bend | St. Joseph County | 102,866 |
| Fishers | Hamilton County | 100,918 |
| Carmel | Hamilton County | 100,501 |
| Bloomington | Monroe County | 78,791 |
| Hammond | Lake County | 77,098 |
| Noblesville | Hamilton County | 71,940 |
| Lafayette | Tippecanoe County | 70,650 |
| Gary | Lake County | 68,604 |
| Muncie | Delaware County | 64,739 |
| Greenwood | Johnson County | 64,237 |
| Kokomo | Howard County | 59,375 |
| Terre Haute | Vigo County | 58,491 |
| Anderson | Madison County | 54,930 |
| Elkhart | Elkhart County | 53,726 |
| Westfield | Hamilton County | 51,109 |
| Columbus | Bartholomew County | 51,104 |
| Mishawaka | St. Joseph County | 50,907 |
| Jeffersonville | Clark County | 50,176 |
| Lawrence | Marion County | 49,284 |
| West Lafayette | Tippecanoe County | 44,802 |
| Portage | Porter County | 37,951 |
| New Albany | Floyd County | 37,589 |
| Merrillville (town) | Lake County | 36,343 |
| Plainfield (town) | Hendricks County | 35,783 |
| Richmond | Wayne County | 35,551 |
| Valparaiso | Porter County | 34,377 |
| Goshen | Elkhart County | 34,374 |
| Crown Point | Lake County | 34,042 |
| Michigan City | LaPorte County | 31,894 |
| Zionsville (town) | Boone County | 31,442 |
| Brownsburg (town) | Hendricks County | 30,310 |
| Hobart | Lake County | 29,646 |
| Schererville (town) | Lake County | 29,627 |
| Marion | Grant County | 27,384 |
| East Chicago | Lake County | 26,158 |
| Franklin | Johnson County | 25,999 |
| Greenfield | Hancock County | 24,308 |
| Highland (town) | Lake County | 23,749 |
| Munster (town) | Lake County | 23,733 |
| Avon (town) | Hendricks County | 22,683 |
| La Porte | LaPorte County | 22,125 |
| Clarksville (town) | Clark County | 22,121 |
| St. John (town) | Lake County | 21,639 |
| Seymour | Jackson County | 21,536 |
| Shelbyville | Shelby County | 19,866 |
| Logansport | Cass County | 17,766 |
| Lebanon | Boone County | 17,575 |
Showing the 50 most populous — and 516 more. Search the map above for any Indiana city or village.
A city can span more than one county; each is listed in its primary county — the one its center falls in.
Which Indiana county is the richest, largest, most crowded? The answers
- Indiana’s highest median household income is in Hamilton County ($121,231); the lowest is in Vigo County ($50,665). Census SAIPE 2023
- Indiana’s most populous county is Marion County (968,460); the least populous is Ohio County (6,004) — a 161× spread. Census PEP 2023
- Indiana’s largest county by land area is Allen County (657 sq mi); the smallest is Ohio County (86 sq mi). Census TIGER
- Indiana’s highest population density is in Marion County (2,446/sq mi); the lowest is in Benton County (21/sq mi). Census PEP 2023 · TIGER
- Indiana’s highest poverty rate is in Vigo County (20.2%); the lowest is in Boone County (4.7%). Census SAIPE 2023
- In Indiana, unemployment is highest in Howard County (4.8%) and lowest in Pulaski County (2.3%), for May 2026. BLS LAUS
- Indiana’s highest median age is in Brown County (50.9); the lowest is in Tippecanoe County (28.8). Census ACS 2019–2023
- Indiana’s highest share of bachelor’s degrees is in Hamilton County (61.8% of adults); the lowest is in Switzerland County (10.0%). Census ACS 2019–2023
Every figure is a current official estimate from the source named — not a crowd-sourced or copied value. Suppressed estimates (coefficient of variation ≥ 0.30) are omitted, never guessed. See the full methodology.
Indiana counties: common questions
How many counties are in Indiana?
Indiana has 92 counties covering 35,825 sq mi and about 6.9M residents. Every one is on the map above and in the table below.
What is the largest county in Indiana?
It depends on the measure. By land area it’s Allen County (657 sq mi); by population it’s Marion County (968,460 residents).
What county is Indianapolis city (balance) in?
Indianapolis city (balance) (population 882,043) is in Marion County. Use the search on the map to find any Indiana city’s county.
What is the richest county in Indiana?
By median household income, Hamilton County is the richest at $121,231; the poorest is Vigo County at $50,665 (Census SAIPE 2023).
What is the most populous county in Indiana?
Marion County, with 968,460 residents — about 14.1% of Indiana’s people, and 161× the least populous, Ohio County (6,004).
Sources & vintages
- Population — PEP Vintage 2023 (July 1, 2023) — pep/charv
- Median household income & poverty — SAIPE 2023
- Unemployment — BLS LAUS May 2026 (preliminary)
- Geometry & boundaries — Census TIGERweb
- Cities & city population — Census TIGERweb Incorporated Places + ACS 5-year 2019–2023
Data current through .