CountyAtlas Kansas
Kansas County Map with Cities — All 105 Counties
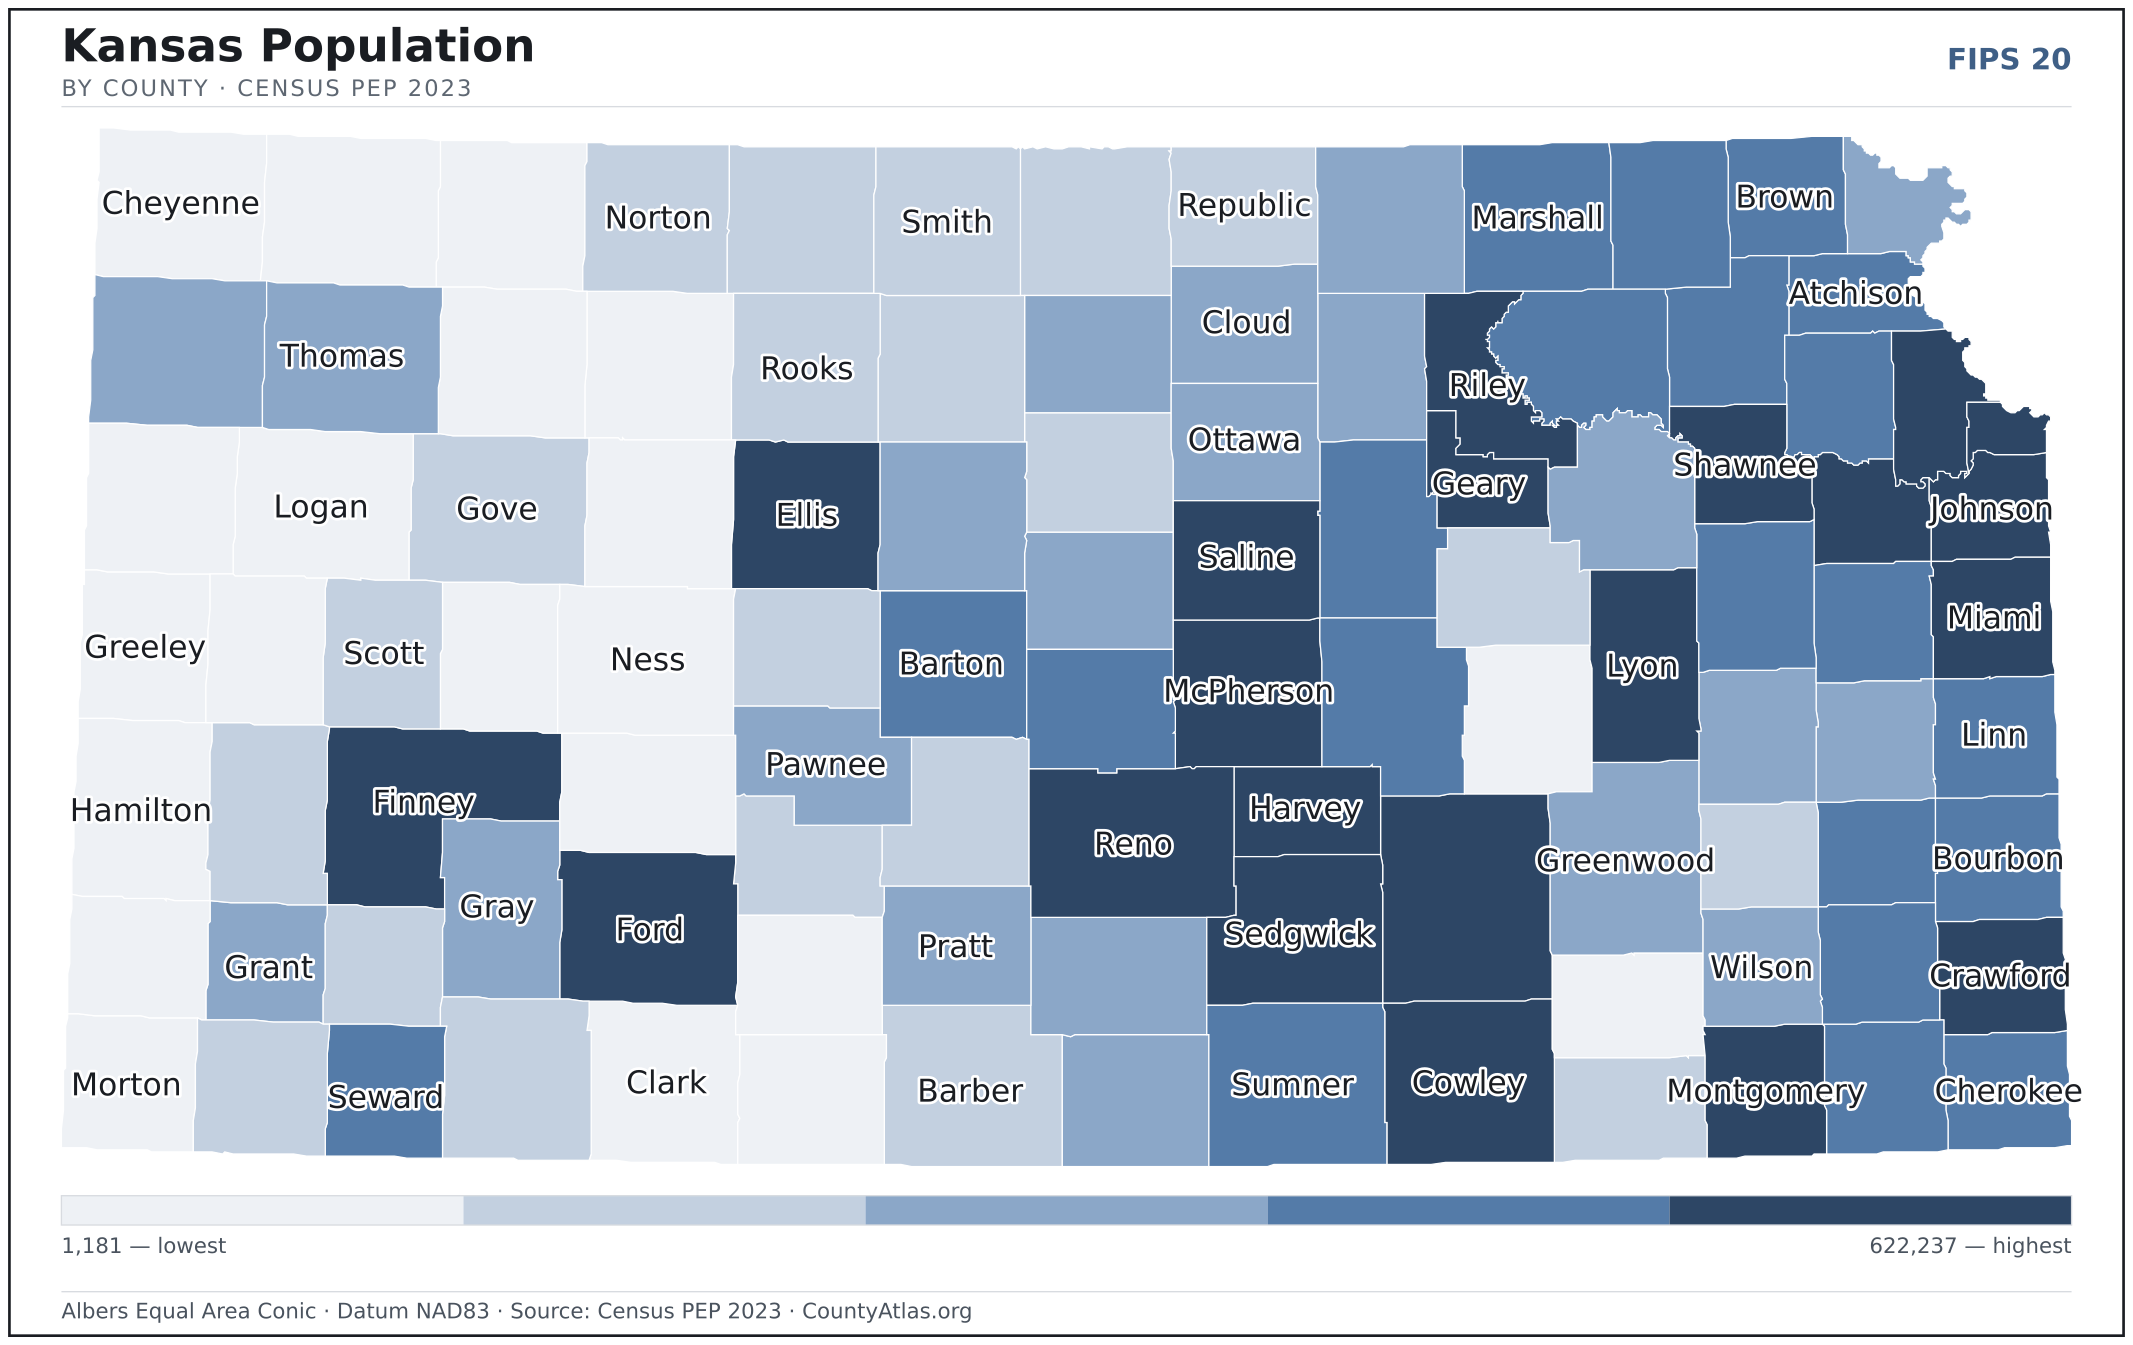
All 105 of Kansas's counties, mapped from official U.S. Census boundaries with population, income, and unemployment for every one. Colour the map by any measure, tap a county for its data, or download a print-ready copy.
Tap any county for its population, income, and more.
Kansas at a glance
- Scale. Kansas is divided into 105 counties across 81,759 sq mi of land — an average of 779 sq mi each. Census TIGER
- People. Its counties are home to 2,940,546 residents — an average of 28,005 each, or 36 per square mile statewide. Census PEP 2023
- Water. Another 519 sq mi is water — 0.6% of the state’s area, led by Coffey County. Census TIGER
Kansas’s 105 counties, by the numbers
Every county’s population, median household income, unemployment, density, and land area — sortable by any column, so you can find yours or rank by what matters to you. A few patterns run through the data:
- Concentrated. Half of Kansas’s 2,940,546 residents live in just 4 of 105 counties, and the five largest hold 54.9% of the total. Census PEP 2023
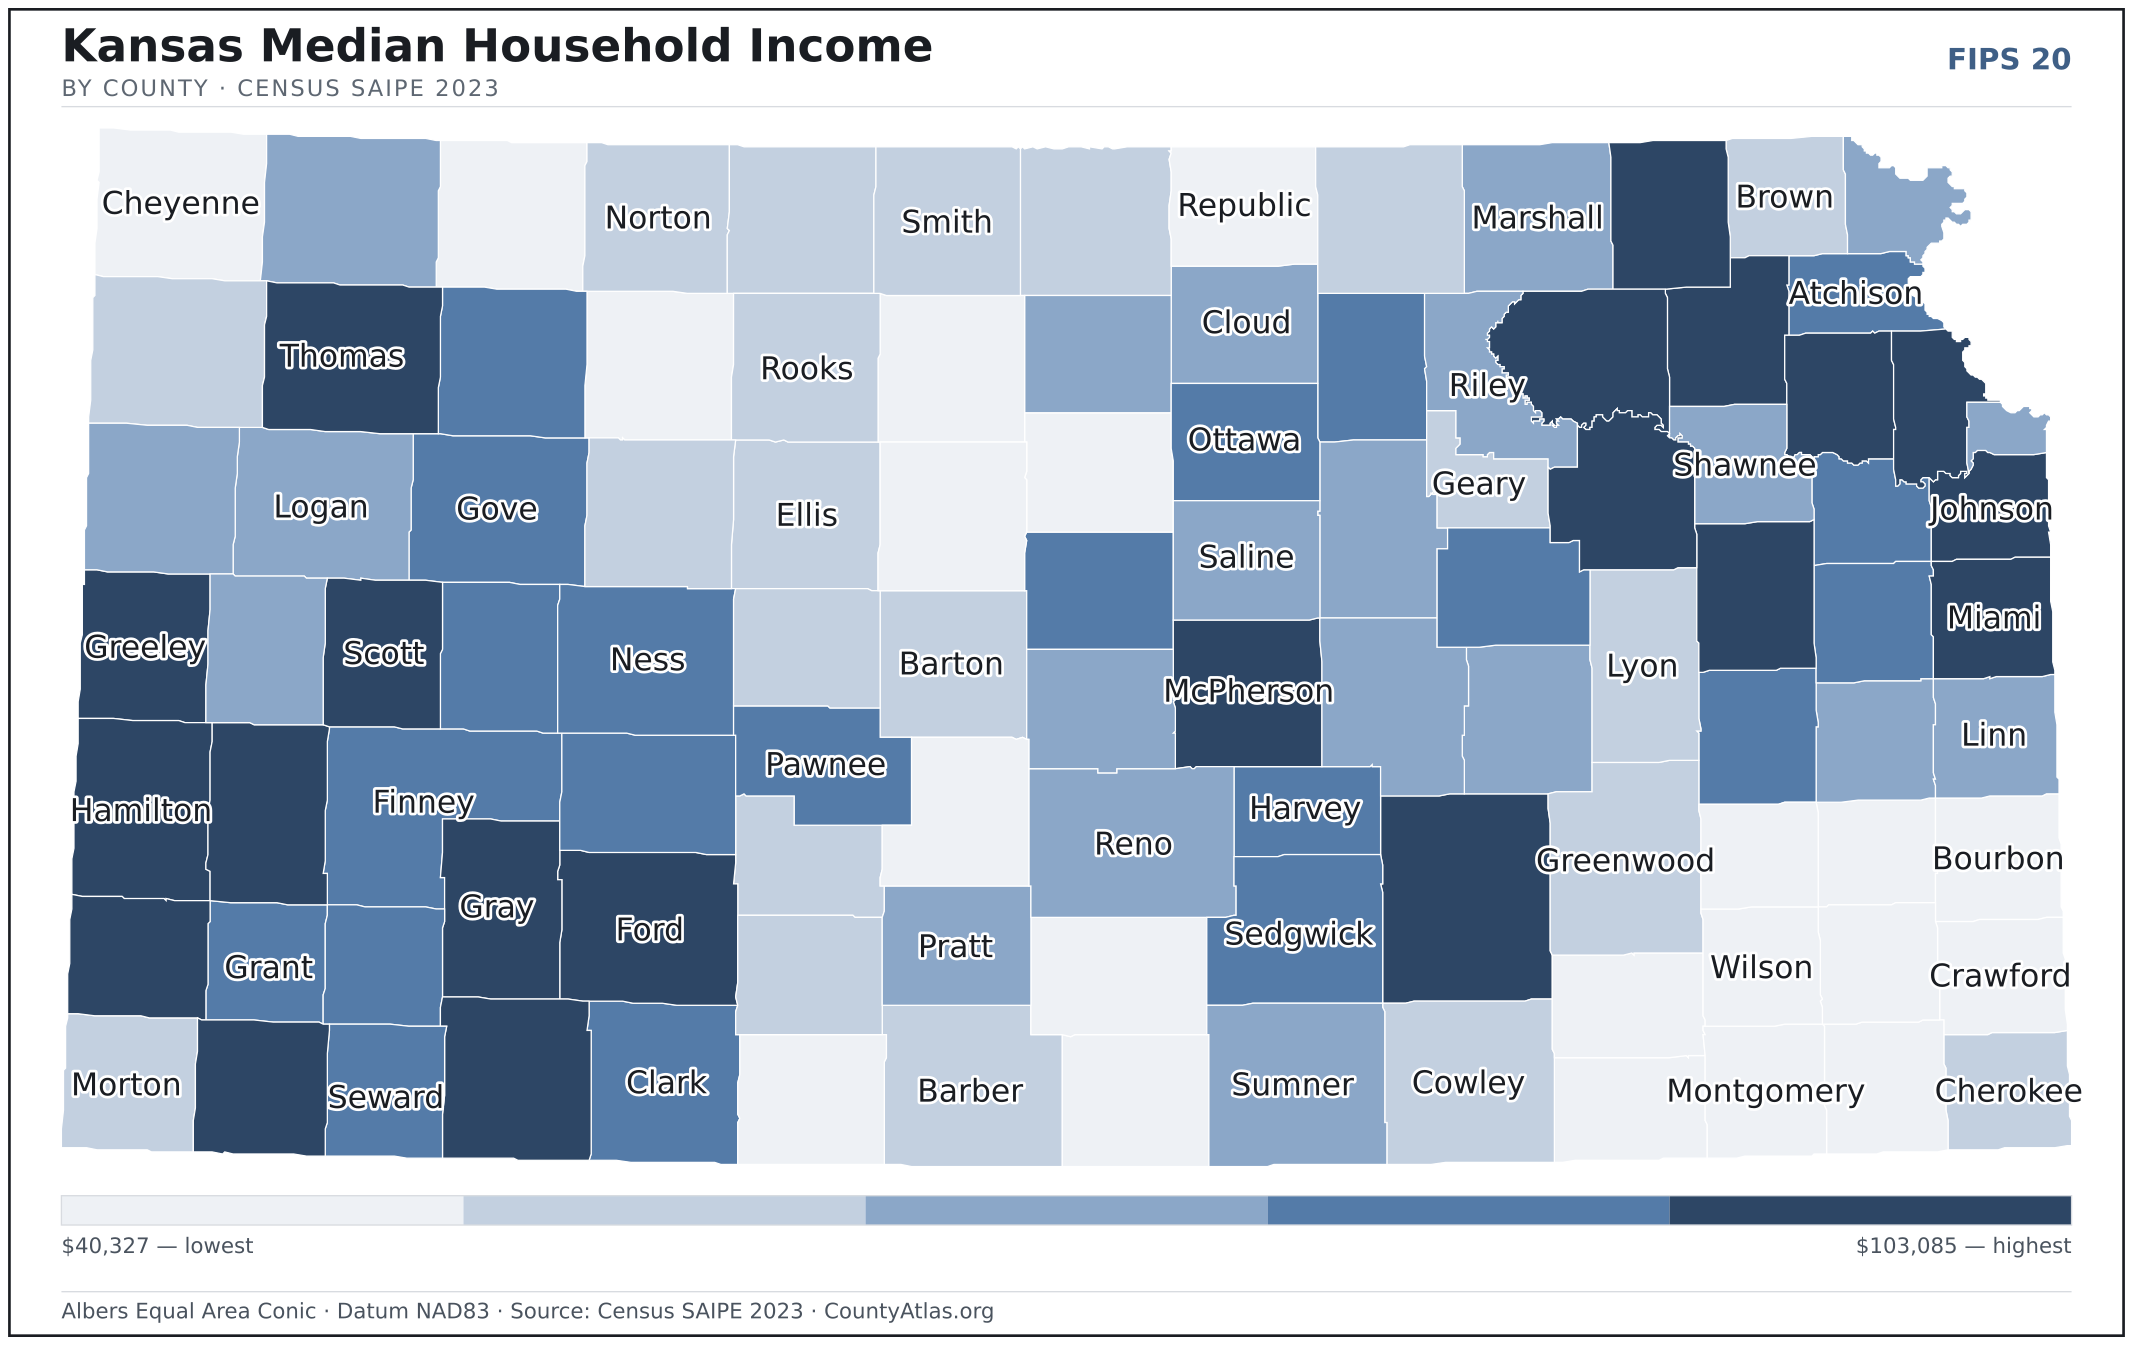
- Income tracks poverty. The gap from richest to poorest runs 2.6×, and the 10 highest-income counties average 8.2% in poverty against 14.8% for the 10 lowest. Census SAIPE 2023
- Mostly small. Half of Kansas’s counties have fewer than 7,057 residents, and half report a median household income below $62,431 — a few metros lift the statewide totals well above both. Census PEP 2023 · SAIPE 2023
- Lopsided density. Only 18 of 105 counties are denser than Kansas’s statewide average of 36 people per square mile — the rest are more rural. Census PEP 2023 · TIGER
| Allen County | 12,412 | $54,761 | 4.4% | 25/sq mi | 500 sq mi | Iola |
| Anderson County | 7,838 | $61,742 | 4.0% | 14/sq mi | 580 sq mi | Garnett |
| Atchison County | 16,016 | $65,818 | 3.8% | 37/sq mi | 431 sq mi | Atchison |
| Barber County | 4,071 | $59,514 | 3.1% | 4/sq mi | 1,134 sq mi | Medicine Lodge |
| Barton County | 24,899 | $58,568 | 3.9% | 28/sq mi | 895 sq mi | Great Bend |
| Bourbon County | 14,408 | $54,428 | 5.3% | 23/sq mi | 635 sq mi | Fort Scott |
| Brown County | 9,250 | $58,989 | 4.3% | 16/sq mi | 571 sq mi | Hiawatha |
| Butler County | 68,632 | $76,742 | 3.8% | 48/sq mi | 1,430 sq mi | El Dorado |
| Chase County | 2,579 | $62,302 | 4.1% | 3/sq mi | 773 sq mi | Cottonwood Falls |
| Chautauqua County | 3,347 | $49,510 | 4.7% | 5/sq mi | 639 sq mi | Sedan |
| Cherokee County | 19,054 | $55,853 | 4.0% | 32/sq mi | 588 sq mi | Columbus |
| Cheyenne County | 2,636 | $52,424 | 3.1% | 3/sq mi | 1,020 sq mi | St. Francis |
| Clark County | 1,847 | $64,998 | 3.0% | 2/sq mi | 975 sq mi | Ashland |
| Clay County | 8,007 | $66,389 | 3.9% | 12/sq mi | 645 sq mi | Clay Center |
| Cloud County | 8,854 | $60,403 | 3.3% | 12/sq mi | 715 sq mi | Concordia |
| Coffey County | 8,251 | $67,933 | 4.3% | 13/sq mi | 627 sq mi | Burlington |
| Comanche County | 1,655 | $51,956 | 3.1% | 2/sq mi | 788 sq mi | Coldwater |
| Cowley County | 34,157 | $57,549 | 4.0% | 30/sq mi | 1,126 sq mi | Winfield |
| Crawford County | 38,764 | $52,285 | 4.0% | 66/sq mi | 590 sq mi | Girard |
| Decatur County | 2,712 | $54,613 | 3.3% | 3/sq mi | 894 sq mi | Oberlin |
| Dickinson County | 18,445 | $63,417 | 3.6% | 22/sq mi | 847 sq mi | Abilene |
| Doniphan County | 7,493 | $63,765 | 3.8% | 19/sq mi | 393 sq mi | Troy |
| Douglas County | 120,553 | $68,561 | 3.6% | 265/sq mi | 456 sq mi | Lawrence |
| Edwards County | 2,733 | $59,055 | 3.4% | 4/sq mi | 622 sq mi | Kinsley |
| Elk County | 2,467 | $48,121 | 4.6% | 4/sq mi | 644 sq mi | Howard |
| Ellis County | 28,810 | $59,048 | 3.0% | 32/sq mi | 900 sq mi | Hays |
| Ellsworth County | 6,357 | $65,396 | 3.1% | 9/sq mi | 716 sq mi | Ellsworth |
| Finney County | 37,466 | $67,640 | 3.1% | 29/sq mi | 1,302 sq mi | Garden City |
| Ford County | 33,980 | $68,766 | 3.0% | 31/sq mi | 1,098 sq mi | Dodge City |
| Franklin County | 26,125 | $67,883 | 3.5% | 46/sq mi | 572 sq mi | Ottawa |
| Geary County | 35,047 | $56,899 | 4.6% | 91/sq mi | 385 sq mi | Junction City |
| Gove County | 2,735 | $65,003 | 3.6% | 3/sq mi | 1,072 sq mi | Gove City |
| Graham County | 2,376 | $53,247 | 4.2% | 3/sq mi | 899 sq mi | Hill City |
| Grant County | 7,147 | $65,399 | 3.4% | 12/sq mi | 575 sq mi | Ulysses |
| Gray County | 5,743 | $77,786 | 2.7% | 7/sq mi | 869 sq mi | Cimarron |
| Greeley County | 1,181 | $70,566 | 3.5% | 2/sq mi | 778 sq mi | Tribune |
| Greenwood County | 5,870 | $59,179 | 4.2% | 5/sq mi | 1,143 sq mi | Eureka |
| Hamilton County | 2,437 | $72,657 | 2.8% | 2/sq mi | 997 sq mi | Syracuse |
| Harper County | 5,435 | $54,423 | 3.6% | 7/sq mi | 801 sq mi | Anthony |
| Harvey County | 33,504 | $67,078 | 3.6% | 62/sq mi | 540 sq mi | Newton |
| Haskell County | 3,630 | $68,202 | 3.0% | 6/sq mi | 578 sq mi | Sublette |
| Hodgeman County | 1,655 | $66,919 | 3.0% | 2/sq mi | 860 sq mi | Jetmore |
| Jackson County | 13,368 | $73,051 | 3.5% | 20/sq mi | 656 sq mi | Holton |
| Jefferson County | 18,327 | $81,301 | 3.6% | 34/sq mi | 533 sq mi | Oskaloosa |
| Jewell County | 2,847 | $56,505 | 4.7% | 3/sq mi | 910 sq mi | Mankato |
| Johnson County | 622,237 | $103,085 | 3.5% | 1,314/sq mi | 474 sq mi | Olathe |
| Kearny County | 3,823 | $71,237 | 3.3% | 4/sq mi | 871 sq mi | Lakin |
| Kingman County | 7,066 | $54,731 | 2.8% | 8/sq mi | 863 sq mi | Kingman |
| Kiowa County | 2,374 | $56,222 | 3.4% | 3/sq mi | 723 sq mi | Greensburg |
| Labette County | 19,728 | $49,874 | 3.8% | 31/sq mi | 645 sq mi | Oswego |
| Lane County | 1,529 | $64,875 | 3.6% | 2/sq mi | 717 sq mi | Dighton |
| Leavenworth County | 83,518 | $83,086 | 4.1% | 180/sq mi | 463 sq mi | Leavenworth |
| Lincoln County | 2,920 | $53,667 | 4.1% | 4/sq mi | 719 sq mi | Lincoln Center |
| Linn County | 9,860 | $62,431 | 4.7% | 17/sq mi | 594 sq mi | Mound City |
| Logan County | 2,665 | $60,216 | 2.8% | 2/sq mi | 1,073 sq mi | Oakley |
| Lyon County | 32,172 | $55,659 | 4.6% | 38/sq mi | 847 sq mi | Emporia |
| Marion County | 11,690 | $62,268 | 3.6% | 12/sq mi | 944 sq mi | Marion |
| Marshall County | 9,933 | $64,514 | 3.4% | 11/sq mi | 900 sq mi | Marysville |
| McPherson County | 30,091 | $78,908 | 3.1% | 33/sq mi | 898 sq mi | McPherson |
| Meade County | 3,911 | $71,572 | 3.1% | 4/sq mi | 978 sq mi | Meade |
| Miami County | 35,320 | $85,620 | 3.5% | 61/sq mi | 576 sq mi | Paola |
| Mitchell County | 5,719 | $60,486 | 4.5% | 8/sq mi | 702 sq mi | Beloit |
| Montgomery County | 30,568 | $53,379 | 4.4% | 47/sq mi | 644 sq mi | Independence |
| Morris County | 5,334 | $65,283 | 3.2% | 8/sq mi | 695 sq mi | Council Grove |
| Morton County | 2,580 | $58,093 | 3.8% | 4/sq mi | 730 sq mi | Elkhart |
| Nemaha County | 10,114 | $74,744 | 2.8% | 14/sq mi | 717 sq mi | Seneca |
| Neosho County | 15,420 | $53,085 | 3.7% | 27/sq mi | 571 sq mi | Erie |
| Ness County | 2,618 | $64,935 | 2.8% | 2/sq mi | 1,075 sq mi | Ness City |
| Norton County | 5,330 | $57,738 | 3.1% | 6/sq mi | 878 sq mi | Norton |
| Osage County | 15,824 | $69,666 | 3.7% | 22/sq mi | 706 sq mi | Lyndon |
| Osborne County | 3,427 | $54,638 | 4.0% | 4/sq mi | 893 sq mi | Osborne |
| Ottawa County | 5,818 | $66,956 | 3.2% | 8/sq mi | 721 sq mi | Minneapolis |
| Pawnee County | 6,126 | $64,704 | 3.0% | 8/sq mi | 754 sq mi | Larned |
| Phillips County | 4,761 | $59,453 | 3.2% | 5/sq mi | 886 sq mi | Phillipsburg |
| Pottawatomie County | 26,382 | $84,434 | 3.4% | 31/sq mi | 841 sq mi | Westmoreland |
| Pratt County | 9,082 | $61,078 | 3.3% | 12/sq mi | 735 sq mi | Pratt |
| Rawlins County | 2,463 | $63,255 | 2.8% | 2/sq mi | 1,069 sq mi | Atwood |
| Reno County | 61,497 | $62,470 | 3.9% | 49/sq mi | 1,255 sq mi | Hutchinson |
| Republic County | 4,627 | $54,981 | 3.2% | 6/sq mi | 717 sq mi | Belleville |
| Rice County | 9,260 | $62,922 | 3.6% | 13/sq mi | 726 sq mi | Lyons |
| Riley County | 71,402 | $63,076 | 3.6% | 117/sq mi | 610 sq mi | Manhattan |
| Rooks County | 4,778 | $59,998 | 3.3% | 5/sq mi | 891 sq mi | Stockton |
| Rush County | 2,830 | $55,709 | 3.3% | 4/sq mi | 718 sq mi | La Crosse |
| Russell County | 6,723 | $55,415 | 3.6% | 8/sq mi | 886 sq mi | Russell |
| Saline County | 53,098 | $63,587 | 3.3% | 74/sq mi | 720 sq mi | Salina |
| Scott County | 4,922 | $73,436 | 3.0% | 7/sq mi | 718 sq mi | Scott City |
| Sedgwick County | 528,469 | $67,435 | 4.0% | 530/sq mi | 997 sq mi | Wichita |
| Seward County | 21,067 | $66,540 | 3.6% | 33/sq mi | 640 sq mi | Liberal |
| Shawnee County | 177,746 | $63,612 | 3.9% | 327/sq mi | 544 sq mi | Topeka |
| Sheridan County | 2,423 | $65,350 | 2.4% | 3/sq mi | 896 sq mi | Hoxie |
| Sherman County | 5,844 | $57,628 | 3.3% | 6/sq mi | 1,056 sq mi | Goodland |
| Smith County | 3,590 | $55,568 | 3.5% | 4/sq mi | 895 sq mi | Smith Center |
| Stafford County | 3,909 | $54,808 | 3.2% | 5/sq mi | 792 sq mi | St. John |
| Stanton County | 1,901 | $74,063 | 3.7% | 3/sq mi | 680 sq mi | Johnson City |
| Stevens County | 5,077 | $68,600 | 2.8% | 7/sq mi | 727 sq mi | Hugoton |
| Sumner County | 22,334 | $63,049 | 3.8% | 19/sq mi | 1,182 sq mi | Wellington |
| Thomas County | 7,865 | $69,774 | 2.8% | 7/sq mi | 1,075 sq mi | Colby |
| Trego County | 2,731 | $56,168 | 3.4% | 3/sq mi | 889 sq mi | WaKeeney |
| Wabaunsee County | 7,057 | $69,893 | 3.4% | 9/sq mi | 794 sq mi | Alma |
| Wallace County | 1,509 | $61,157 | 3.6% | 2/sq mi | 914 sq mi | Sharon Springs |
| Washington County | 5,504 | $58,302 | 3.0% | 6/sq mi | 895 sq mi | Washington |
| Wichita County | 2,082 | $61,825 | 2.5% | 3/sq mi | 719 sq mi | Leoti |
| Wilson County | 8,382 | $54,164 | 5.4% | 15/sq mi | 570 sq mi | Fredonia |
| Woodson County | 3,115 | $40,327 | 5.1% | 6/sq mi | 498 sq mi | Yates Center |
| Wyandotte County | 165,281 | $61,088 | 4.4% | 1,090/sq mi | 152 sq mi | Kansas City |
All 105 counties, sortable by any column — click a heading. A suppressed estimate (coefficient of variation ≥ 0.30) shows a marker, never a guess. County seats are from Wikidata (CC0), each validated to a Census place inside its county; a county with no validated seat is left blank. See the methodology.
Download & print this Kansas map
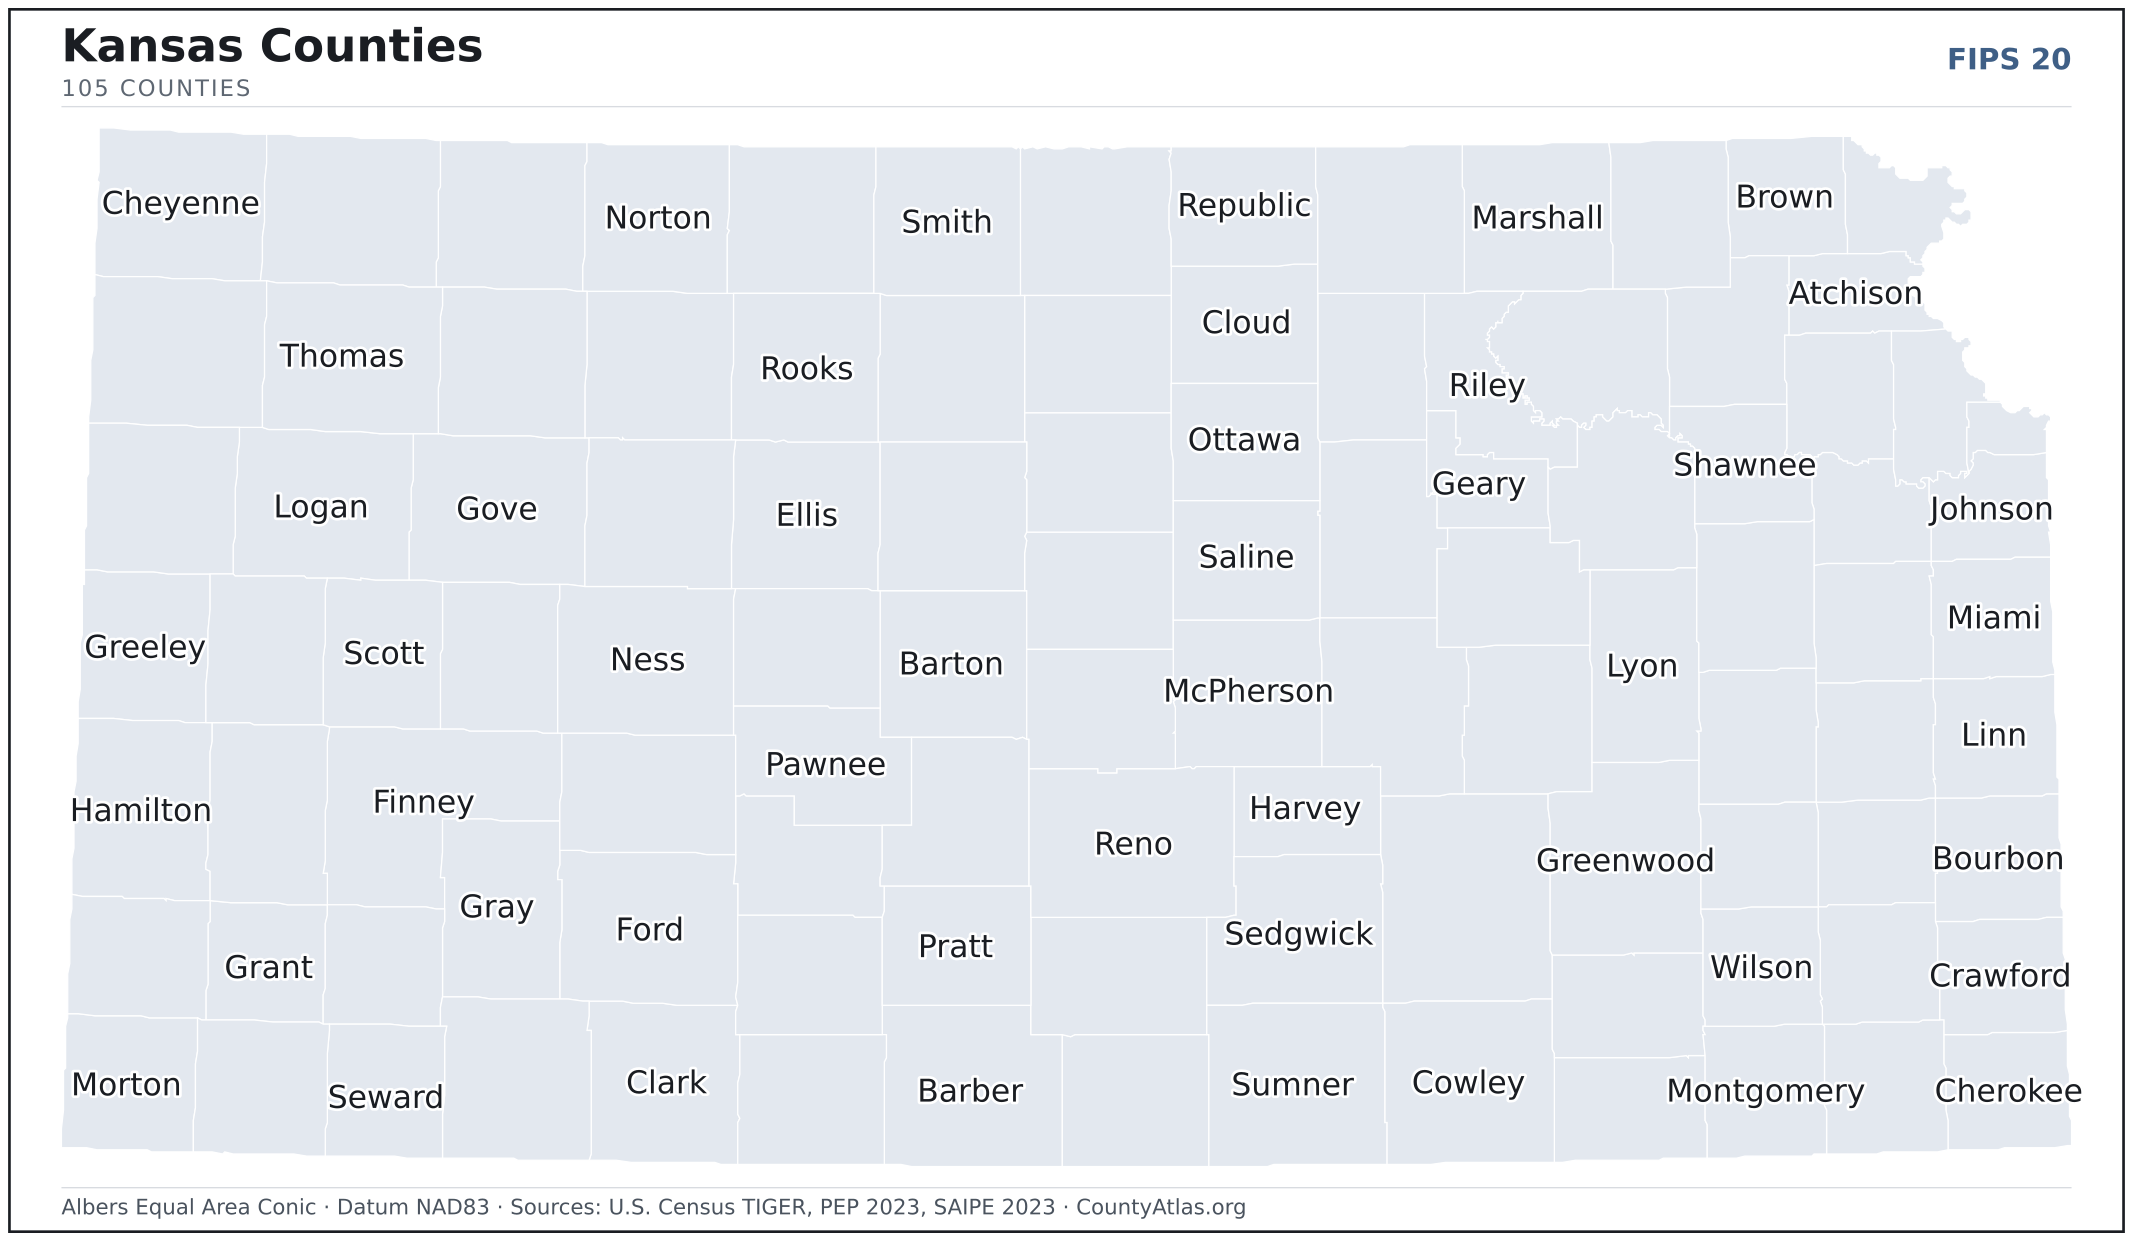
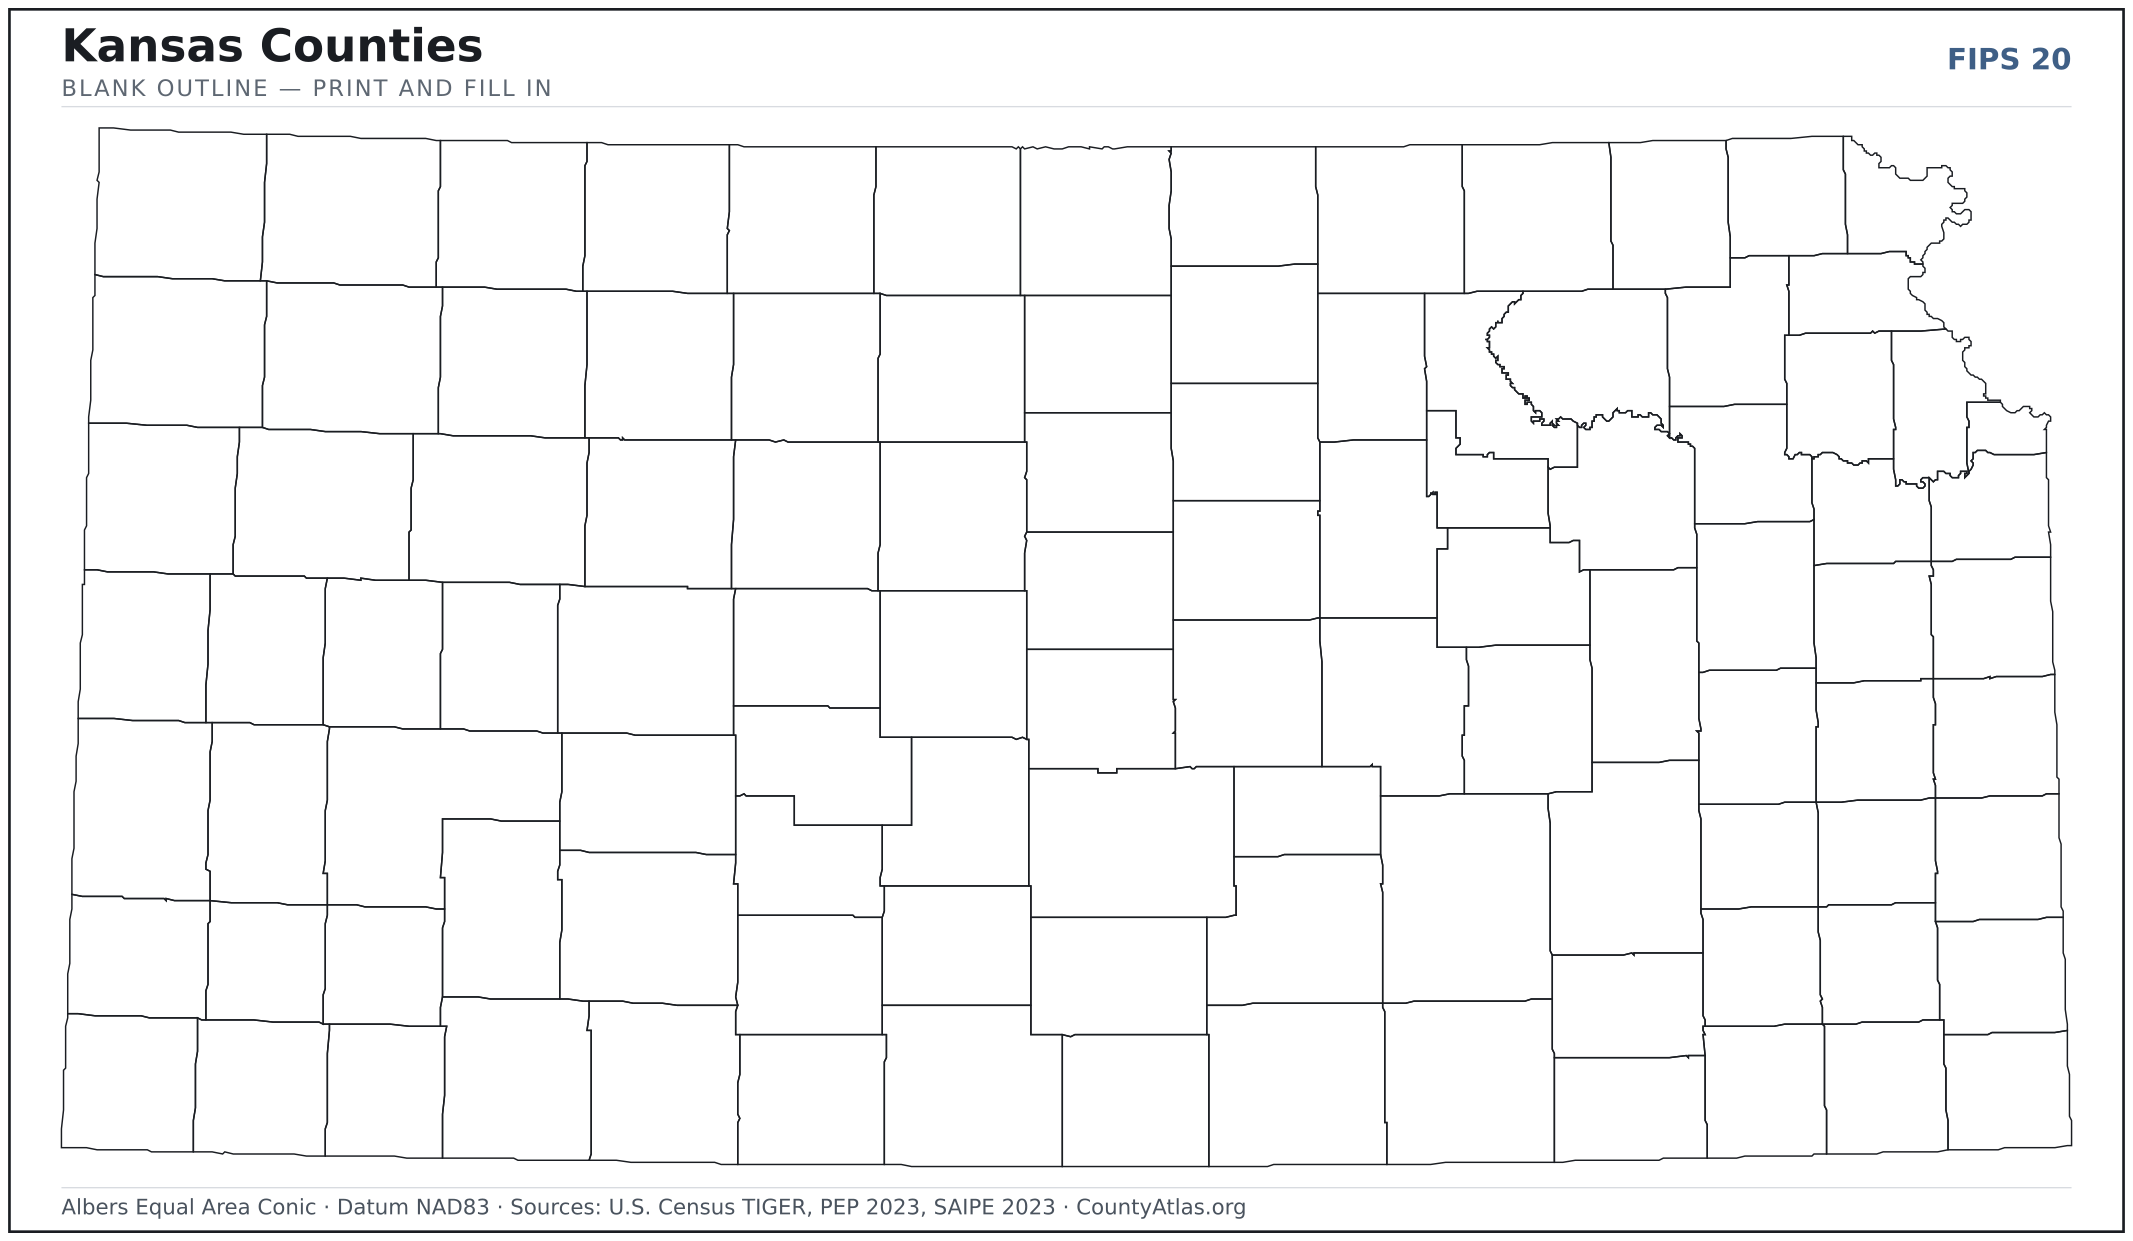
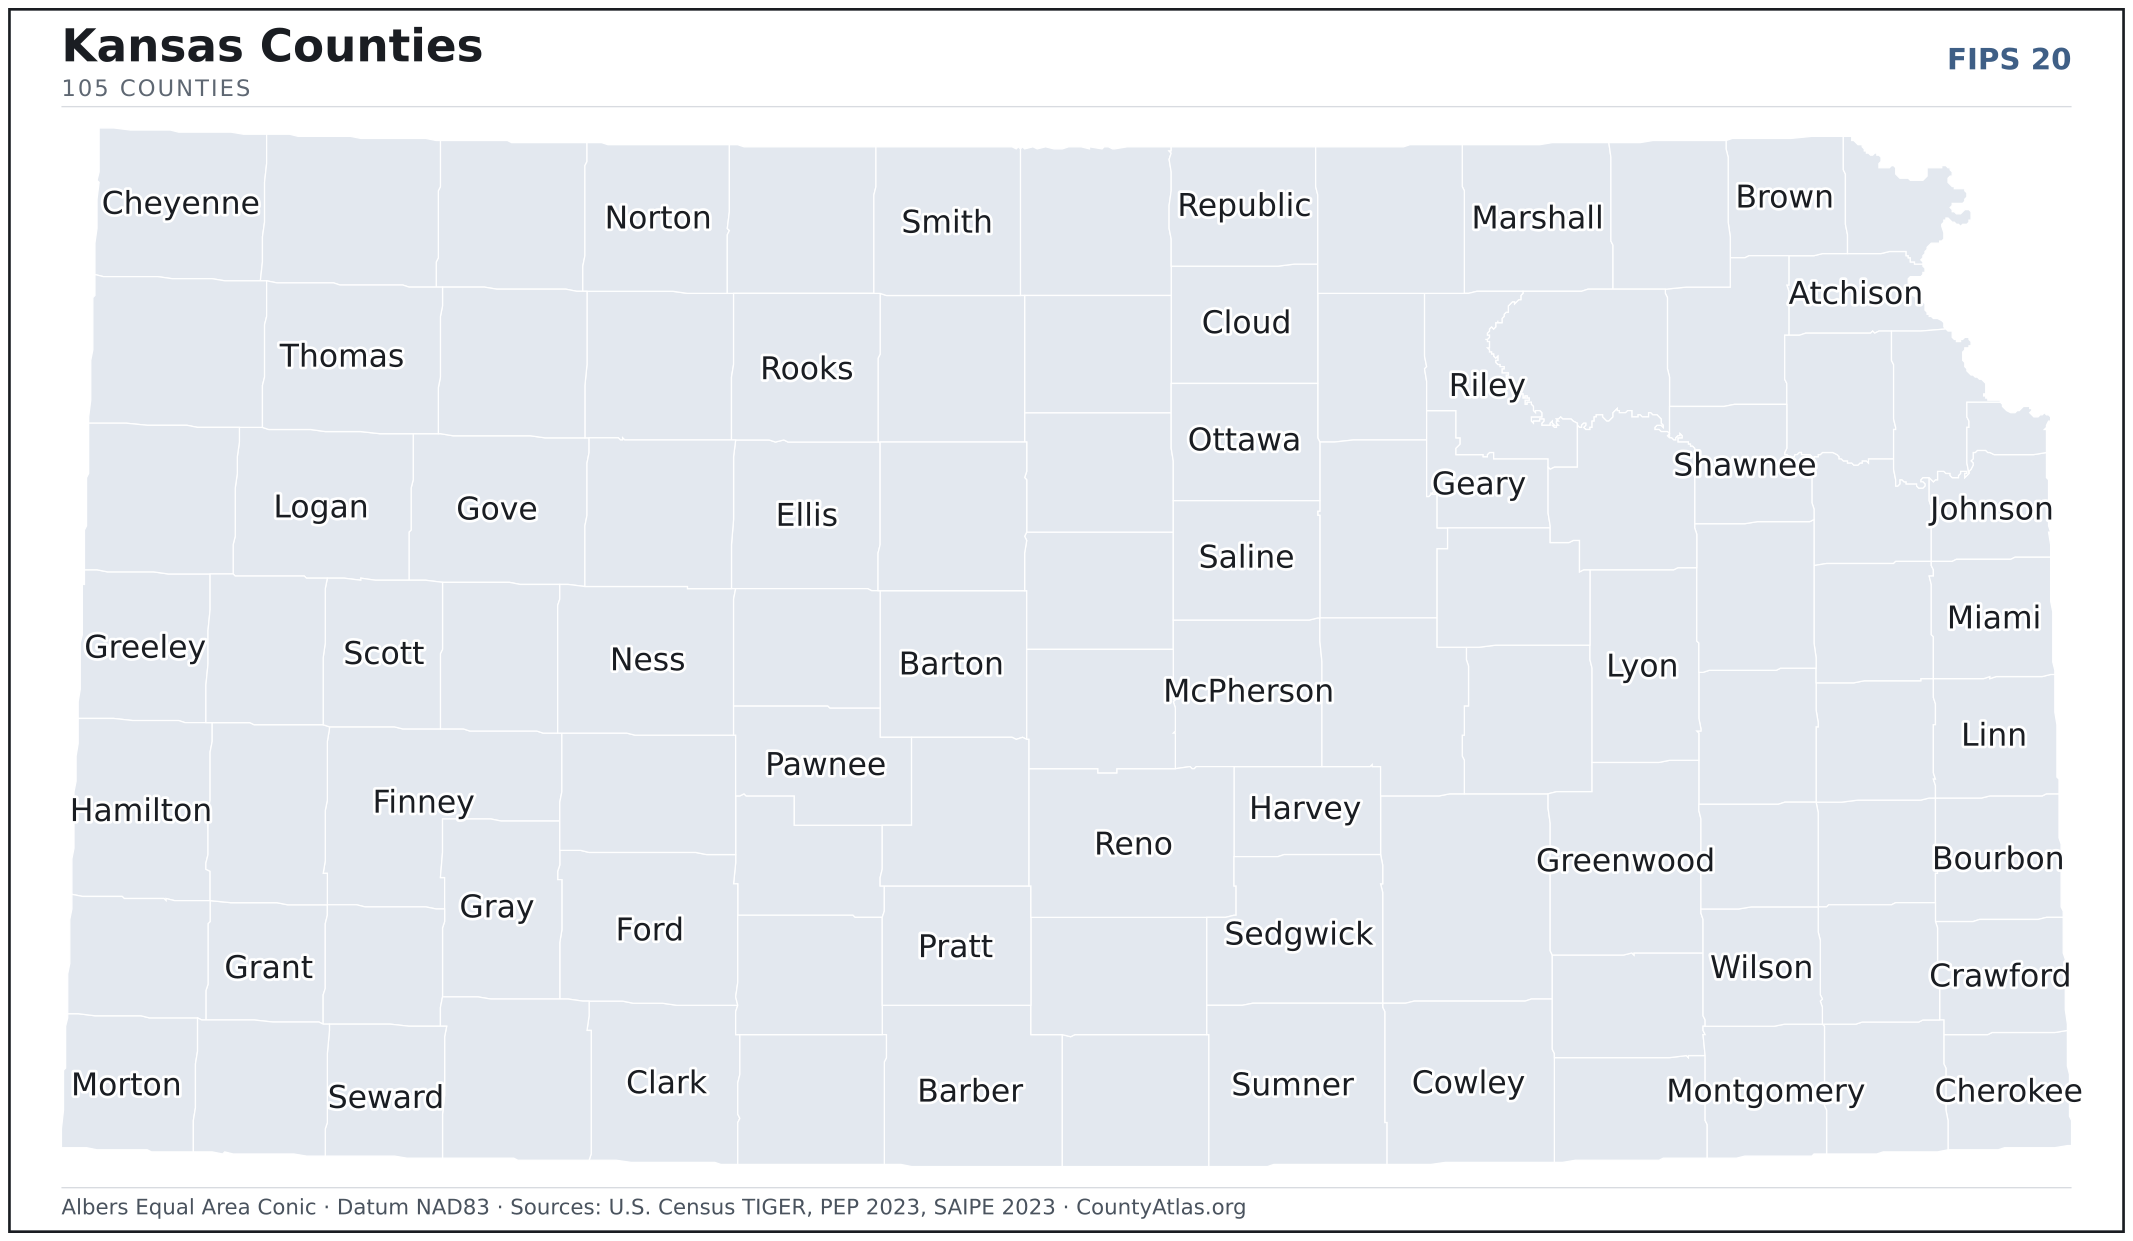
Kansas maps, coloured by the data
Cities in Kansas
Kansas has 626 incorporated cities. The largest is Wichita in Sedgwick County with 396,488 residents. Use the search on the map above to find any city and highlight the county it sits in.
| Wichita | Sedgwick County | 396,488 |
| Overland Park | Johnson County | 197,199 |
| Kansas City | Wyandotte County | 154,776 |
| Olathe | Johnson County | 143,720 |
| Topeka | Shawnee County | 126,103 |
| Lawrence | Douglas County | 95,459 |
| Shawnee | Johnson County | 68,175 |
| Lenexa | Johnson County | 57,986 |
| Manhattan | Riley County | 53,951 |
| Salina | Saline County | 46,432 |
| Hutchinson | Reno County | 39,837 |
| Leavenworth | Leavenworth County | 37,176 |
| Leawood | Johnson County | 33,844 |
| Garden City | Finney County | 27,781 |
| Dodge City | Ford County | 27,652 |
| Derby | Sedgwick County | 25,801 |
| Emporia | Lyon County | 24,098 |
| Gardner | Johnson County | 24,020 |
| Prairie Village | Johnson County | 22,937 |
| Junction City | Geary County | 22,431 |
| Hays | Ellis County | 21,078 |
| Pittsburg | Crawford County | 20,606 |
| Liberal | Seward County | 19,107 |
| Newton | Harvey County | 18,443 |
| Andover | Butler County | 15,508 |
| Great Bend | Barton County | 14,596 |
| McPherson | McPherson County | 13,956 |
| El Dorado | Butler County | 12,882 |
| Ottawa | Franklin County | 12,632 |
| Arkansas City | Cowley County | 11,909 |
| Winfield | Cowley County | 11,731 |
| Lansing | Leavenworth County | 11,229 |
| Haysville | Sedgwick County | 11,117 |
| Merriam | Johnson County | 11,036 |
| Atchison | Atchison County | 10,795 |
| Mission | Johnson County | 9,928 |
| Parsons | Labette County | 9,482 |
| Augusta | Butler County | 9,252 |
| Valley Center | Sedgwick County | 8,937 |
| Coffeyville | Montgomery County | 8,752 |
| Spring Hill | Johnson County | 8,691 |
| Bel Aire | Sedgwick County | 8,654 |
| Chanute | Neosho County | 8,629 |
| Independence | Montgomery County | 8,469 |
| Bonner Springs | Wyandotte County | 7,735 |
| Park City | Sedgwick County | 7,726 |
| Wellington | Sumner County | 7,643 |
| Fort Scott | Bourbon County | 7,551 |
| Basehor | Leavenworth County | 7,229 |
| Roeland Park | Johnson County | 6,800 |
Showing the 50 most populous — and 576 more. Search the map above for any Kansas city or village.
A city can span more than one county; each is listed in its primary county — the one its center falls in.
Which Kansas county is the richest, largest, most crowded? The answers
- Kansas’s highest median household income is in Johnson County ($103,085); the lowest is in Woodson County ($40,327). Census SAIPE 2023
- Kansas’s most populous county is Johnson County (622,237); the least populous is Greeley County (1,181) — a 527× spread. Census PEP 2023
- Kansas’s largest county by land area is Butler County (1,430 sq mi); the smallest is Wyandotte County (152 sq mi). Census TIGER
- Kansas’s highest population density is in Johnson County (1,314/sq mi); the lowest is in Greeley County (2/sq mi). Census PEP 2023 · TIGER
- Kansas’s highest poverty rate is in Riley County (18.0%); the lowest is in Johnson County (5.3%). Census SAIPE 2023
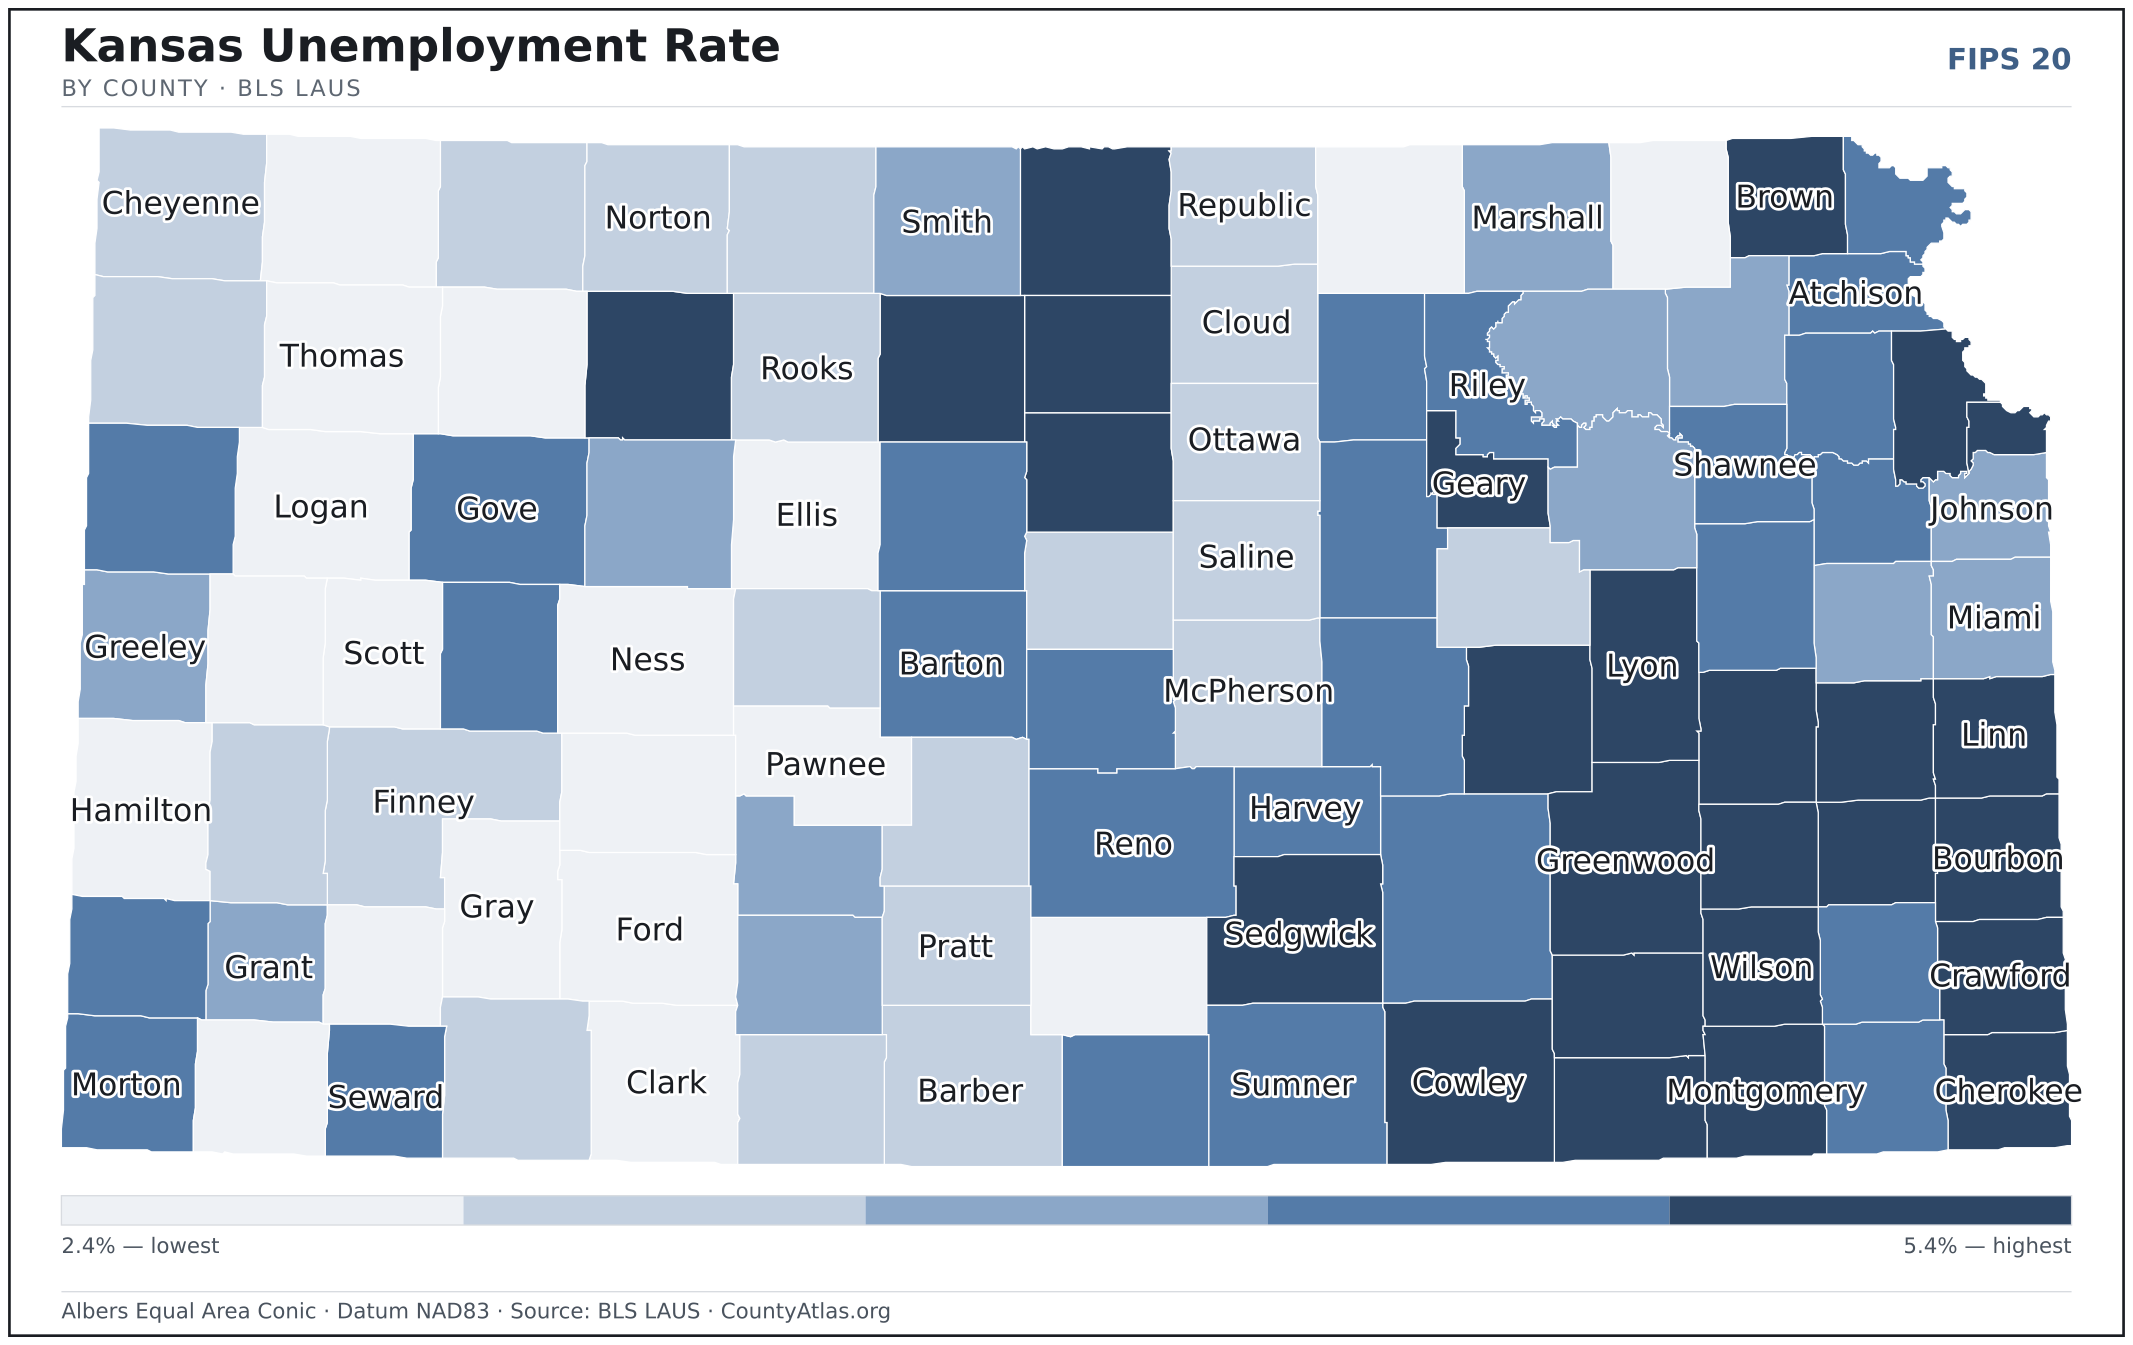
- In Kansas, unemployment is highest in Wilson County (5.4%) and lowest in Sheridan County (2.4%), for May 2026. BLS LAUS
- Kansas’s highest median age is in Decatur County (52.1); the lowest is in Riley County (25.2). Census ACS 2019–2023
- Kansas’s highest share of bachelor’s degrees is in Johnson County (56.9% of adults); the lowest is in Seward County (12.7%). Census ACS 2019–2023
Every figure is a current official estimate from the source named — not a crowd-sourced or copied value. Suppressed estimates (coefficient of variation ≥ 0.30) are omitted, never guessed. See the full methodology.
Kansas counties: common questions
How many counties are in Kansas?
Kansas has 105 counties covering 81,759 sq mi and about 2.9M residents. Every one is on the map above and in the table below.
What is the largest county in Kansas?
It depends on the measure. By land area it’s Butler County (1,430 sq mi); by population it’s Johnson County (622,237 residents).
What county is Wichita in?
Wichita (population 396,488) is in Sedgwick County. Use the search on the map to find any Kansas city’s county.
What is the richest county in Kansas?
By median household income, Johnson County is the richest at $103,085; the poorest is Woodson County at $40,327 (Census SAIPE 2023).
What is the most populous county in Kansas?
Johnson County, with 622,237 residents — about 21.2% of Kansas’s people, and 527× the least populous, Greeley County (1,181).
Sources & vintages
- Population — PEP Vintage 2023 (July 1, 2023) — pep/charv
- Median household income & poverty — SAIPE 2023
- Unemployment — BLS LAUS May 2026 (preliminary)
- Geometry & boundaries — Census TIGERweb
- Cities & city population — Census TIGERweb Incorporated Places + ACS 5-year 2019–2023
Data current through .