CountyAtlas Kentucky
Kentucky County Map with Cities — All 120 Counties
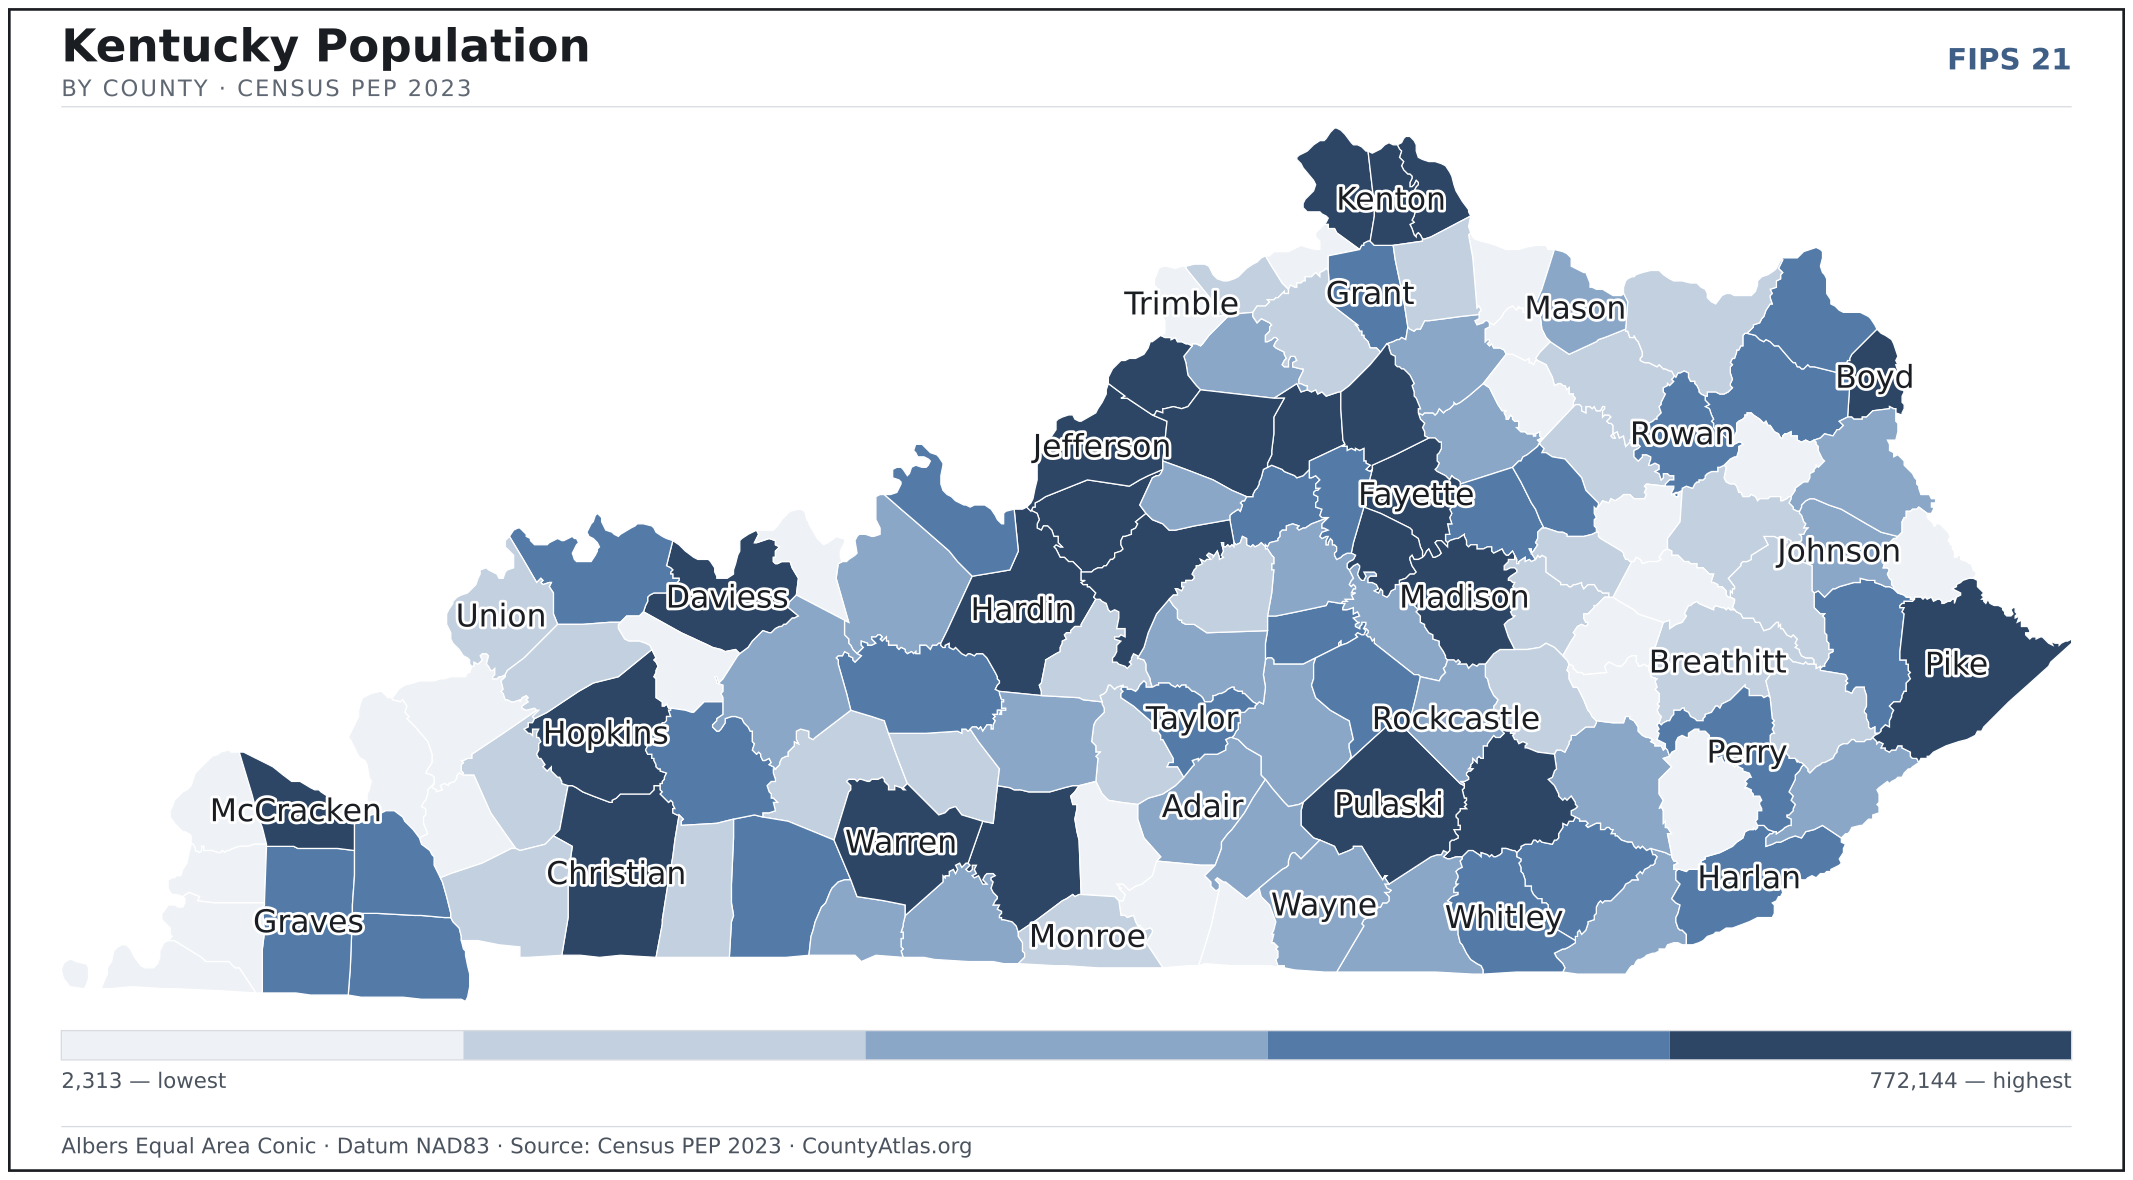
All 120 of Kentucky's counties, mapped from official U.S. Census boundaries with population, income, and unemployment for every one. Colour the map by any measure, tap a county for its data, or download a print-ready copy.
Tap any county for its population, income, and more.
Kentucky at a glance
- Scale. Kentucky is divided into 120 counties across 39,486 sq mi of land — an average of 329 sq mi each. Census TIGER
- People. Its counties are home to 4,526,154 residents — an average of 37,718 each, or 115 per square mile statewide. Census PEP 2023
- Water. Another 920 sq mi is water — 2.3% of the state’s area, led by Lyon County. Census TIGER
Kentucky’s 120 counties, by the numbers
Every county’s population, median household income, unemployment, density, and land area — sortable by any column, so you can find yours or rank by what matters to you. A few patterns run through the data:
- Concentrated. Half of Kentucky’s 4,526,154 residents live in just 14 of 120 counties, and the five largest hold 34.2% of the total. Census PEP 2023
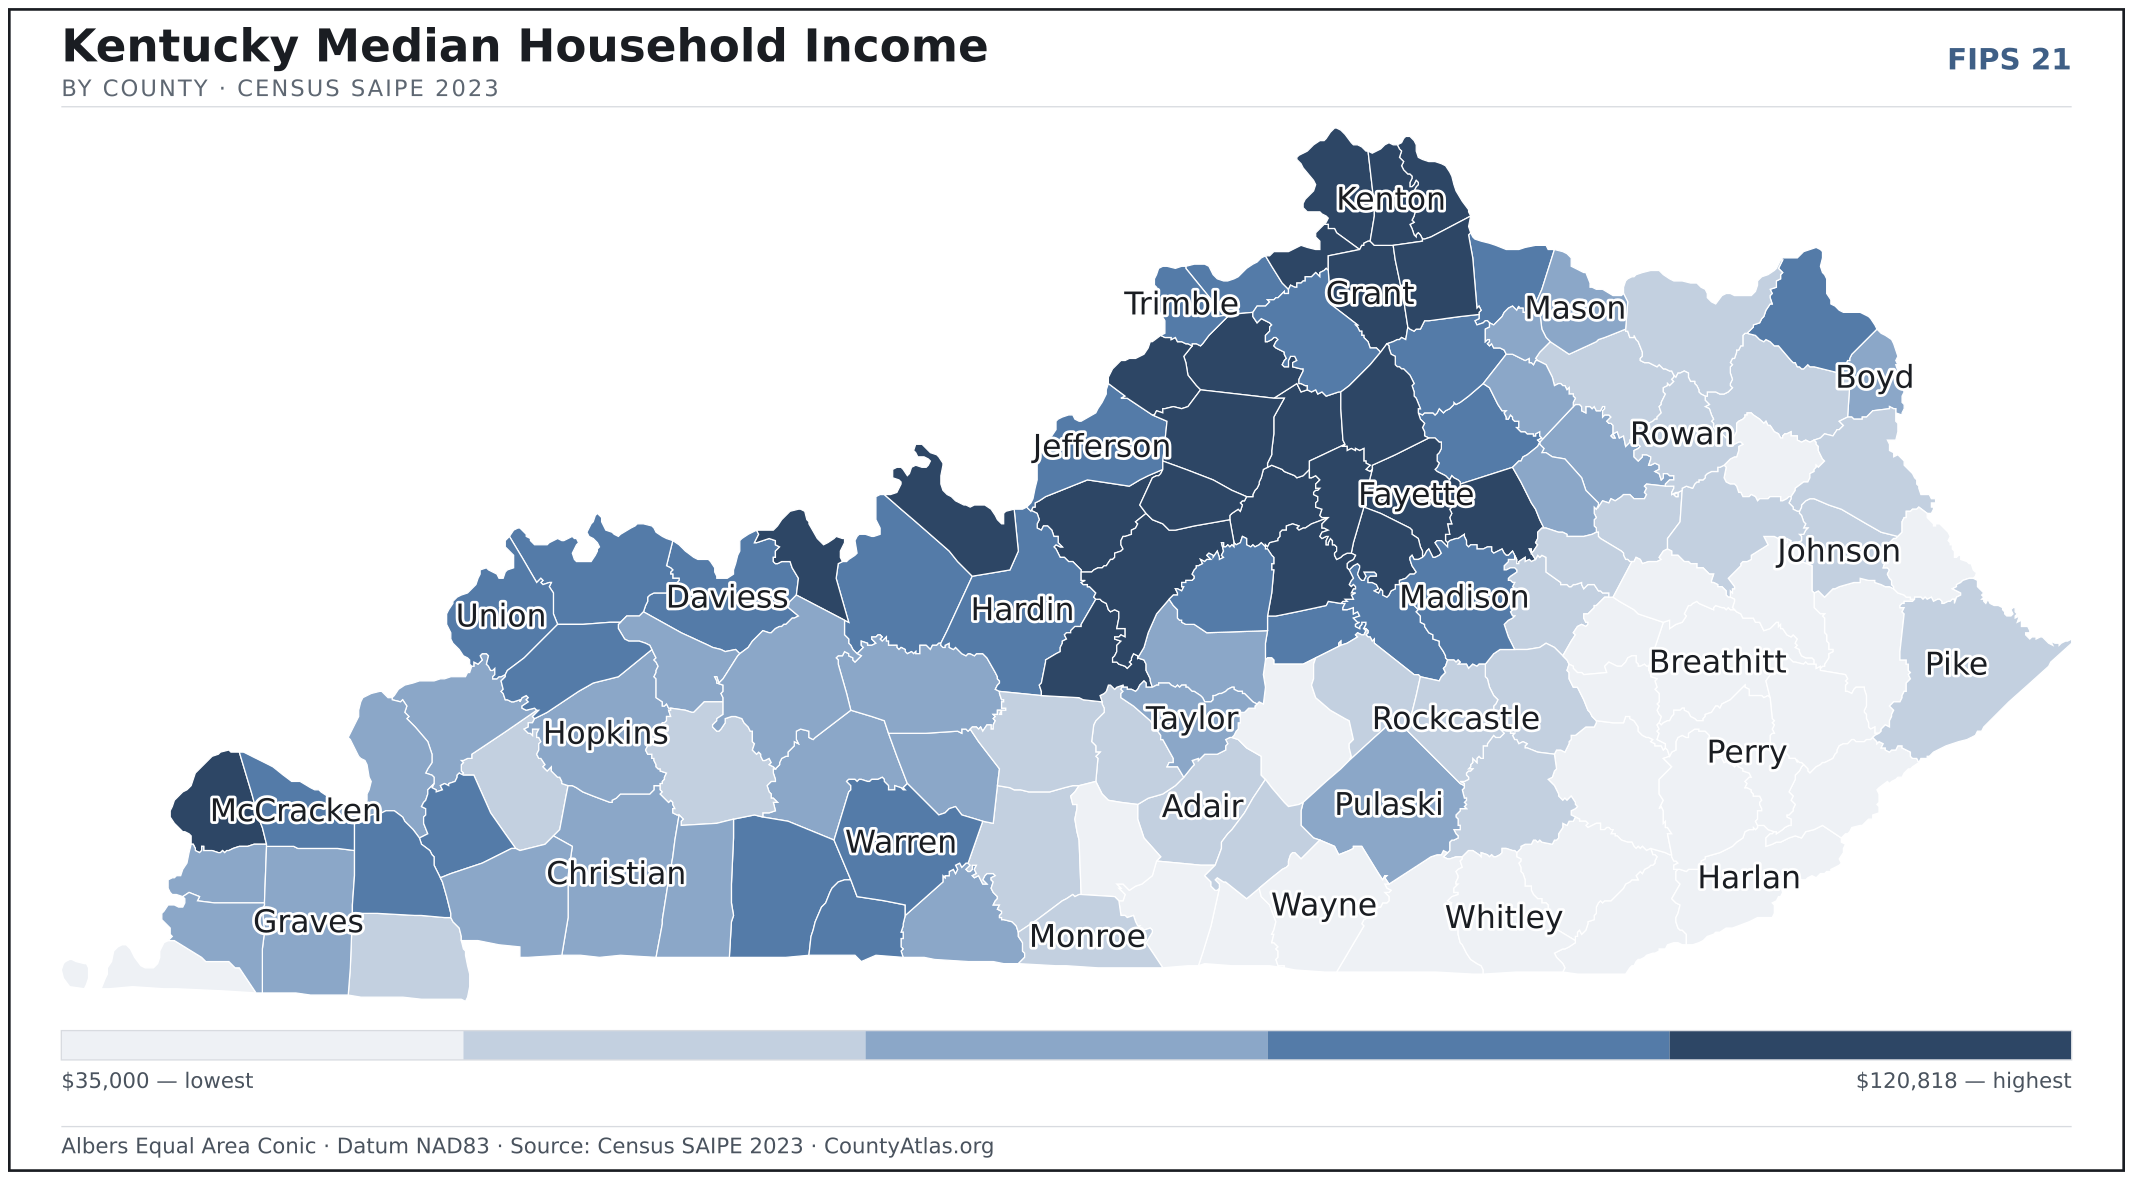
- Income tracks poverty. The gap from richest to poorest runs 3.5×, and the 10 highest-income counties average 9.1% in poverty against 32.9% for the 10 lowest. Census SAIPE 2023
- Mostly small. Half of Kentucky’s counties have fewer than 19,686 residents, and half report a median household income below $55,510 — a few metros lift the statewide totals well above both. Census PEP 2023 · SAIPE 2023
- Lopsided density. Only 23 of 120 counties are denser than Kentucky’s statewide average of 115 people per square mile — the rest are more rural. Census PEP 2023 · TIGER
| Adair County | 19,264 | $45,974 | 4.6% | 48/sq mi | 405 sq mi | Columbia |
| Allen County | 21,788 | $56,483 | 4.5% | 63/sq mi | 344 sq mi | Scottsville |
| Anderson County | 24,613 | $78,336 | 4.3% | 122/sq mi | 202 sq mi | Lawrenceburg |
| Ballard County | 7,582 | $69,716 | 5.0% | 31/sq mi | 247 sq mi | Wickliffe |
| Barren County | 45,008 | $51,068 | 4.9% | 92/sq mi | 487 sq mi | Glasgow |
| Bath County | 12,975 | $54,247 | 5.6% | 47/sq mi | 278 sq mi | Owingsville |
| Bell County | 23,317 | $35,566 | 6.1% | 65/sq mi | 359 sq mi | Pineville |
| Boone County | 140,496 | $89,313 | 4.1% | 570/sq mi | 246 sq mi | Burlington |
| Bourbon County | 20,134 | $61,530 | 4.6% | 69/sq mi | 290 sq mi | Paris |
| Boyd County | 47,826 | $57,112 | 5.4% | 299/sq mi | 160 sq mi | Catlettsburg |
| Boyle County | 30,988 | $62,541 | 4.7% | 172/sq mi | 180 sq mi | Danville |
| Bracken County | 8,426 | $64,458 | 4.6% | 42/sq mi | 203 sq mi | Brooksville |
| Breathitt County | 12,953 | $40,093 | 5.9% | 26/sq mi | 492 sq mi | Jackson |
| Breckinridge County | 21,124 | $59,267 | 5.5% | 37/sq mi | 570 sq mi | Hardinsburg |
| Bullitt County | 84,863 | $75,402 | 5.3% | 286/sq mi | 297 sq mi | Shepherdsville |
| Butler County | 12,375 | $56,395 | 5.2% | 29/sq mi | 426 sq mi | Morgantown |
| Caldwell County | 12,551 | $52,719 | 4.3% | 36/sq mi | 345 sq mi | Princeton |
| Calloway County | 38,280 | $51,424 | 5.0% | 99/sq mi | 385 sq mi | Murray |
| Campbell County | 93,702 | $80,573 | 4.1% | 619/sq mi | 151 sq mi | Alexandria; Newport |
| Carlisle County | 4,704 | $58,639 | 4.6% | 25/sq mi | 189 sq mi | Bardwell |
| Carroll County | 10,987 | $62,710 | 4.4% | 85/sq mi | 129 sq mi | Carrollton |
| Carter County | 26,366 | $50,853 | 6.8% | 64/sq mi | 410 sq mi | Grayson |
| Casey County | 15,918 | $42,914 | 5.0% | 36/sq mi | 444 sq mi | Liberty |
| Christian County | 72,032 | $54,934 | 5.9% | 100/sq mi | 718 sq mi | Hopkinsville |
| Clark County | 37,304 | $72,386 | 4.2% | 148/sq mi | 252 sq mi | Winchester |
| Clay County | 19,648 | $36,330 | 6.3% | 42/sq mi | 469 sq mi | Manchester |
| Clinton County | 9,148 | $39,877 | 5.5% | 46/sq mi | 197 sq mi | Albany |
| Crittenden County | 8,974 | $53,894 | 5.1% | 25/sq mi | 360 sq mi | Marion |
| Cumberland County | 6,000 | $43,127 | 4.1% | 20/sq mi | 305 sq mi | Burkesville |
| Daviess County | 103,458 | $63,213 | 4.2% | 226/sq mi | 458 sq mi | Owensboro |
| Edmonson County | 12,448 | $56,545 | 5.5% | 41/sq mi | 303 sq mi | Brownsville |
| Elliott County | 7,245 | $43,501 | 7.8% | 31/sq mi | 234 sq mi | Sandy Hook |
| Estill County | 13,936 | $45,129 | 6.0% | 55/sq mi | 253 sq mi | Irvine |
| Fayette County | 320,154 | $67,320 | 4.0% | 1,128/sq mi | 284 sq mi | Lexington |
| Fleming County | 15,442 | $50,804 | 5.3% | 44/sq mi | 349 sq mi | Flemingsburg |
| Floyd County | 34,423 | $40,604 | 6.2% | 88/sq mi | 393 sq mi | Prestonsburg |
| Franklin County | 51,644 | $66,920 | 4.1% | 248/sq mi | 208 sq mi | Frankfort |
| Fulton County | 6,338 | $41,088 | 5.6% | 31/sq mi | 206 sq mi | Hickman |
| Gallatin County | 8,792 | $66,789 | 4.5% | 89/sq mi | 98 sq mi | Warsaw |
| Garrard County | 17,829 | $62,980 | 4.6% | 78/sq mi | 230 sq mi | Lancaster |
| Grant County | 25,619 | $68,309 | 4.4% | 99/sq mi | 258 sq mi | Williamstown |
| Graves County | 36,461 | $53,947 | 4.3% | 66/sq mi | 552 sq mi | Mayfield |
| Grayson County | 26,825 | $54,543 | 6.2% | 54/sq mi | 500 sq mi | Leitchfield |
| Green County | 11,468 | $48,153 | 5.2% | 40/sq mi | 286 sq mi | Greensburg |
| Greenup County | 35,221 | $59,151 | 5.8% | 102/sq mi | 344 sq mi | Greenup |
| Hancock County | 8,920 | $70,998 | 4.7% | 48/sq mi | 188 sq mi | Hawesville |
| Hardin County | 112,273 | $65,472 | 5.6% | 180/sq mi | 624 sq mi | Elizabethtown |
| Harlan County | 25,324 | $36,916 | 6.4% | 54/sq mi | 466 sq mi | Harlan |
| Harrison County | 19,415 | $63,689 | 4.3% | 63/sq mi | 306 sq mi | Cynthiana |
| Hart County | 19,724 | $51,921 | 4.9% | 48/sq mi | 413 sq mi | Munfordville |
| Henderson County | 44,119 | $58,742 | 4.8% | 101/sq mi | 436 sq mi | Henderson |
| Henry County | 15,973 | $66,530 | 4.6% | 56/sq mi | 286 sq mi | New Castle |
| Hickman County | 4,447 | $56,348 | 4.9% | 18/sq mi | 242 sq mi | Clinton |
| Hopkins County | 44,929 | $55,080 | 5.2% | 83/sq mi | 542 sq mi | Madisonville |
| Jackson County | 13,104 | $44,713 | 7.6% | 38/sq mi | 345 sq mi | McKee |
| Jefferson County | 772,144 | $64,977 | 5.0% | 2,027/sq mi | 381 sq mi | Louisville |
| Jessamine County | 55,017 | $75,155 | 4.2% | 320/sq mi | 172 sq mi | Nicholasville |
| Johnson County | 22,116 | $45,126 | 6.3% | 84/sq mi | 262 sq mi | Paintsville |
| Kenton County | 171,321 | $79,604 | 4.1% | 1,068/sq mi | 160 sq mi | Covington; Independence |
| Knott County | 13,659 | $42,345 | 6.4% | 39/sq mi | 352 sq mi | Hindman |
| Knox County | 29,794 | $37,640 | 6.3% | 77/sq mi | 386 sq mi | Barbourville |
| Larue County | 15,303 | $66,310 | 5.0% | 59/sq mi | 261 sq mi | Hodgenville |
| Laurel County | 63,296 | $52,093 | 5.9% | 146/sq mi | 434 sq mi | London |
| Lawrence County | 16,000 | $46,200 | 6.9% | 38/sq mi | 416 sq mi | Louisa |
| Lee County | 7,293 | $37,939 | 5.3% | 35/sq mi | 209 sq mi | Beattyville |
| Leslie County | 9,864 | $39,855 | 5.3% | 25/sq mi | 401 sq mi | Hyden |
| Letcher County | 20,423 | $41,737 | 5.5% | 60/sq mi | 338 sq mi | Whitesburg |
| Lewis County | 12,973 | $46,340 | 8.1% | 27/sq mi | 483 sq mi | Vanceburg |
| Lincoln County | 24,776 | $51,359 | 5.2% | 74/sq mi | 333 sq mi | Stanford |
| Livingston County | 8,892 | $57,586 | 5.4% | 28/sq mi | 313 sq mi | Smithland |
| Logan County | 28,283 | $61,186 | 5.1% | 51/sq mi | 552 sq mi | Russellville |
| Lyon County | 9,187 | $63,989 | 5.0% | 43/sq mi | 214 sq mi | Eddyville |
| Madison County | 96,735 | $65,438 | 5.3% | 221/sq mi | 438 sq mi | Richmond |
| Magoffin County | 11,228 | $40,162 | 7.9% | 36/sq mi | 308 sq mi | Salyersville |
| Marion County | 19,834 | $54,466 | 5.3% | 58/sq mi | 344 sq mi | Lebanon |
| Marshall County | 31,744 | $61,426 | 5.2% | 105/sq mi | 302 sq mi | Benton |
| Martin County | 10,928 | $35,522 | 9.8% | 48/sq mi | 230 sq mi | Inez |
| Mason County | 16,841 | $56,706 | 5.5% | 70/sq mi | 240 sq mi | Maysville |
| McCracken County | 67,428 | $60,801 | 4.7% | 271/sq mi | 249 sq mi | Paducah |
| McCreary County | 17,050 | $36,348 | 6.0% | 40/sq mi | 427 sq mi | Whitley City |
| McLean County | 9,054 | $58,403 | 5.1% | 36/sq mi | 253 sq mi | Calhoun |
| Meade County | 30,131 | $69,228 | 5.3% | 99/sq mi | 305 sq mi | Brandenburg |
| Menifee County | 6,286 | $44,734 | 6.1% | 31/sq mi | 204 sq mi | Frenchburg |
| Mercer County | 23,097 | $67,348 | 4.9% | 93/sq mi | 249 sq mi | Harrodsburg |
| Metcalfe County | 10,482 | $40,690 | 4.5% | 36/sq mi | 290 sq mi | Edmonton |
| Monroe County | 11,306 | $44,605 | 4.8% | 34/sq mi | 329 sq mi | Tompkinsville |
| Montgomery County | 28,527 | $54,848 | 5.0% | 145/sq mi | 197 sq mi | Mount Sterling |
| Morgan County | 14,283 | $44,587 | 5.8% | 37/sq mi | 381 sq mi | West Liberty |
| Muhlenberg County | 30,568 | $52,291 | 5.9% | 65/sq mi | 467 sq mi | Greenville |
| Nelson County | 47,730 | $65,928 | 4.8% | 114/sq mi | 419 sq mi | Bardstown |
| Nicholas County | 7,686 | $52,978 | 4.9% | 39/sq mi | 195 sq mi | Carlisle |
| Ohio County | 23,626 | $55,512 | 5.2% | 40/sq mi | 587 sq mi | Hartford |
| Oldham County | 70,183 | $120,818 | 4.1% | 375/sq mi | 187 sq mi | La Grange |
| Owen County | 11,313 | $64,868 | 4.6% | 32/sq mi | 350 sq mi | Owenton |
| Owsley County | 4,001 | $35,000 | 5.4% | 20/sq mi | 197 sq mi | Booneville |
| Pendleton County | 14,810 | $71,116 | 4.2% | 53/sq mi | 277 sq mi | Falmouth |
| Perry County | 27,133 | $42,519 | 4.9% | 80/sq mi | 340 sq mi | Hazard |
| Pike County | 55,973 | $46,402 | 6.9% | 71/sq mi | 786 sq mi | Pikeville |
| Powell County | 12,972 | $46,014 | 4.8% | 72/sq mi | 179 sq mi | Stanton |
| Pulaski County | 66,191 | $54,487 | 5.1% | 101/sq mi | 658 sq mi | Somerset |
| Robertson County | 2,313 | $55,507 | 5.3% | 23/sq mi | 100 sq mi | Mount Olivet |
| Rockcastle County | 16,190 | $49,406 | 5.4% | 51/sq mi | 317 sq mi | Mount Vernon |
| Rowan County | 24,409 | $51,712 | 5.3% | 87/sq mi | 280 sq mi | Morehead |
| Russell County | 18,279 | $47,397 | 4.5% | 72/sq mi | 253 sq mi | Jamestown |
| Scott County | 60,168 | $81,956 | 4.0% | 213/sq mi | 282 sq mi | Georgetown |
| Shelby County | 49,515 | $76,693 | 4.2% | 130/sq mi | 380 sq mi | Shelbyville |
| Simpson County | 20,195 | $60,371 | 4.9% | 86/sq mi | 234 sq mi | Franklin |
| Spencer County | 20,531 | $97,726 | 5.0% | 110/sq mi | 187 sq mi | Taylorsville |
| Taylor County | 26,443 | $52,832 | 5.0% | 99/sq mi | 266 sq mi | Campbellsville |
| Todd County | 12,494 | $57,288 | 4.0% | 33/sq mi | 375 sq mi | Elkton |
| Trigg County | 14,369 | $57,844 | 5.2% | 33/sq mi | 441 sq mi | Cadiz |
| Trimble County | 8,607 | $65,885 | 4.3% | 58/sq mi | 148 sq mi | Bedford |
| Union County | 13,106 | $60,771 | 4.5% | 38/sq mi | 343 sq mi | Morganfield |
| Warren County | 142,229 | $62,108 | 4.3% | 263/sq mi | 542 sq mi | Bowling Green |
| Washington County | 12,267 | $59,071 | 4.2% | 41/sq mi | 297 sq mi | Springfield |
| Wayne County | 19,580 | $42,721 | 6.8% | 43/sq mi | 458 sq mi | Monticello |
| Webster County | 12,726 | $59,260 | 4.9% | 38/sq mi | 332 sq mi | Dixon |
| Whitley County | 36,825 | $43,910 | 4.6% | 84/sq mi | 438 sq mi | Williamsburg |
| Wolfe County | 6,282 | $40,949 | 8.5% | 28/sq mi | 222 sq mi | Campton |
| Woodford County | 27,268 | $78,344 | 3.7% | 144/sq mi | 190 sq mi | Versailles |
All 120 counties, sortable by any column — click a heading. A suppressed estimate (coefficient of variation ≥ 0.30) shows a marker, never a guess. County seats are from Wikidata (CC0), each validated to a Census place inside its county; a county with no validated seat is left blank. See the methodology.
Download & print this Kentucky map
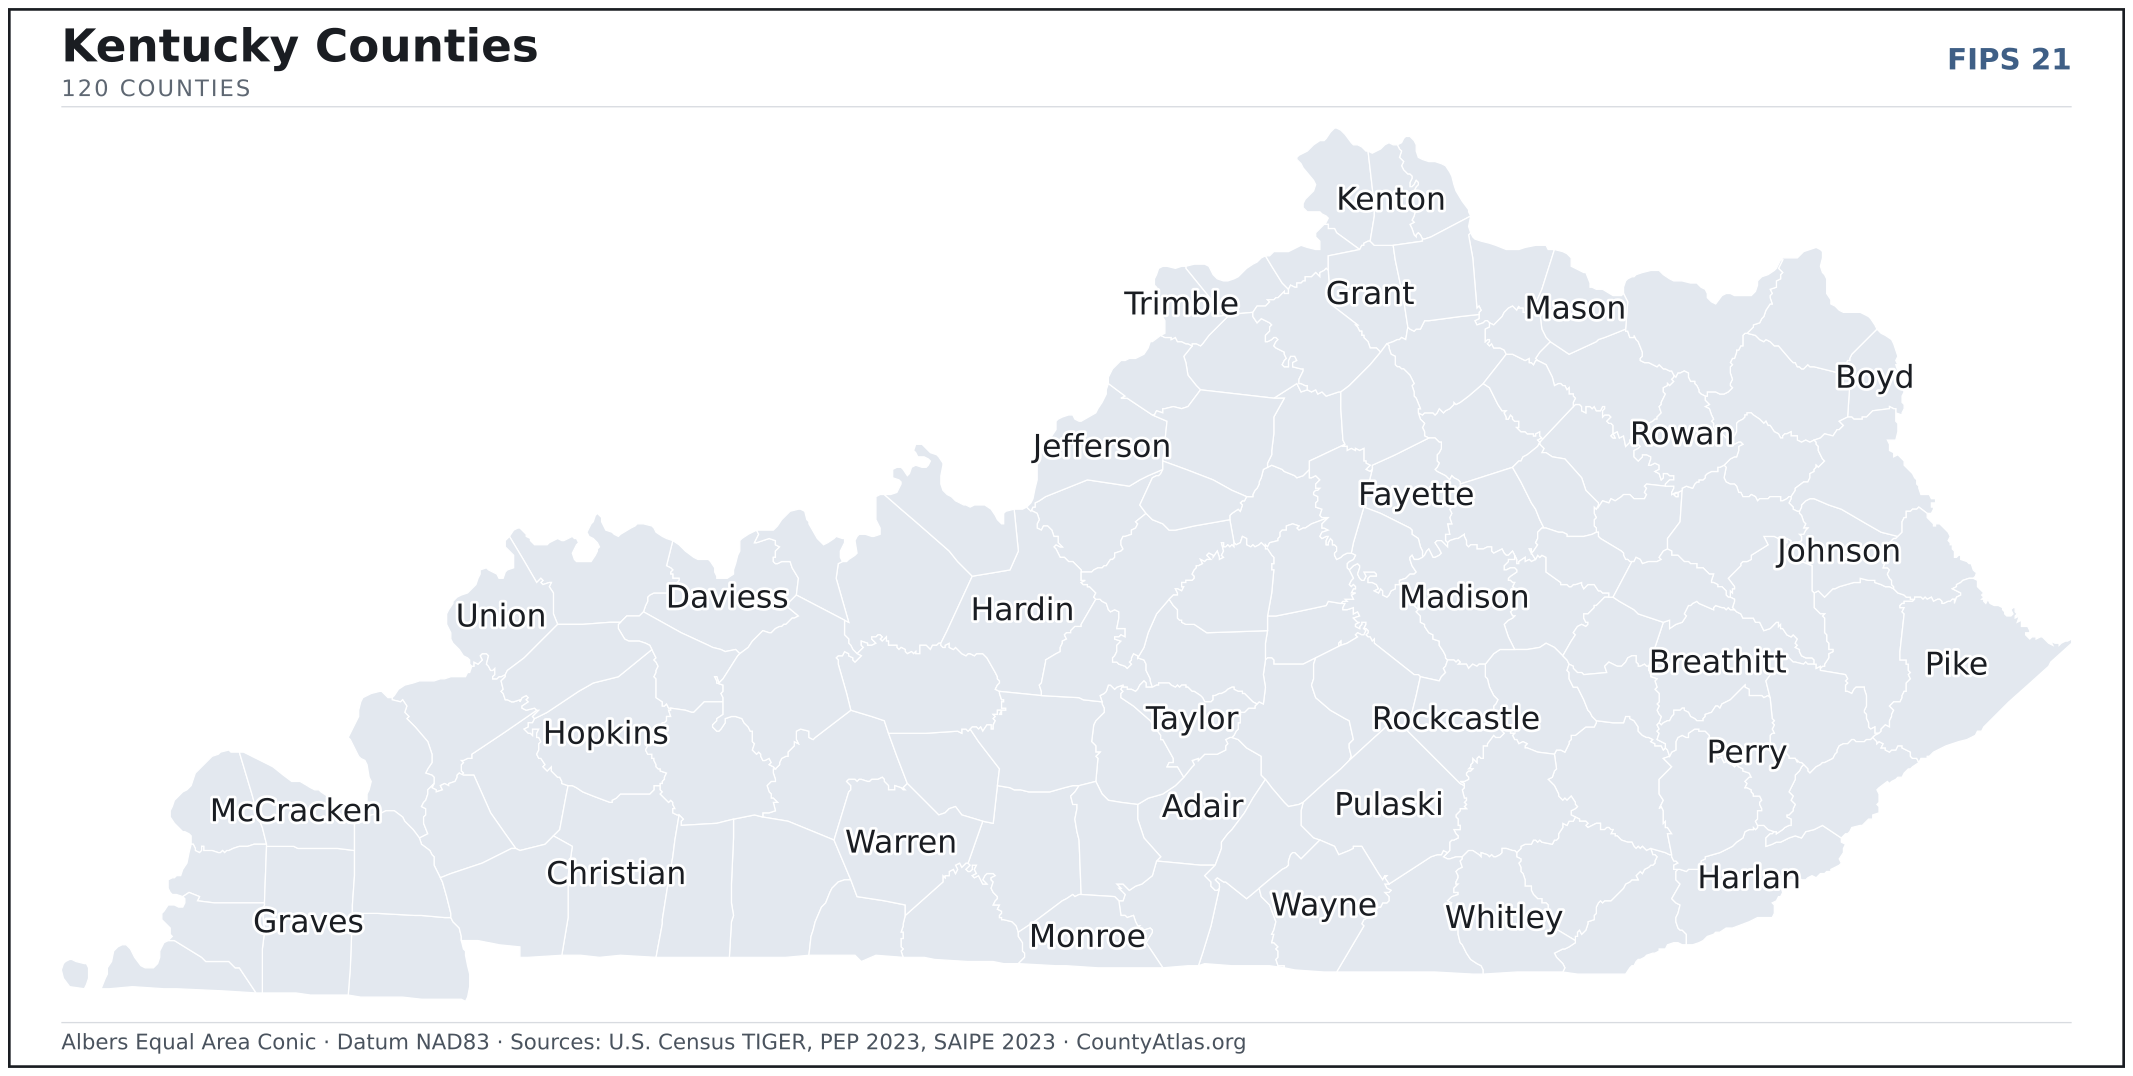
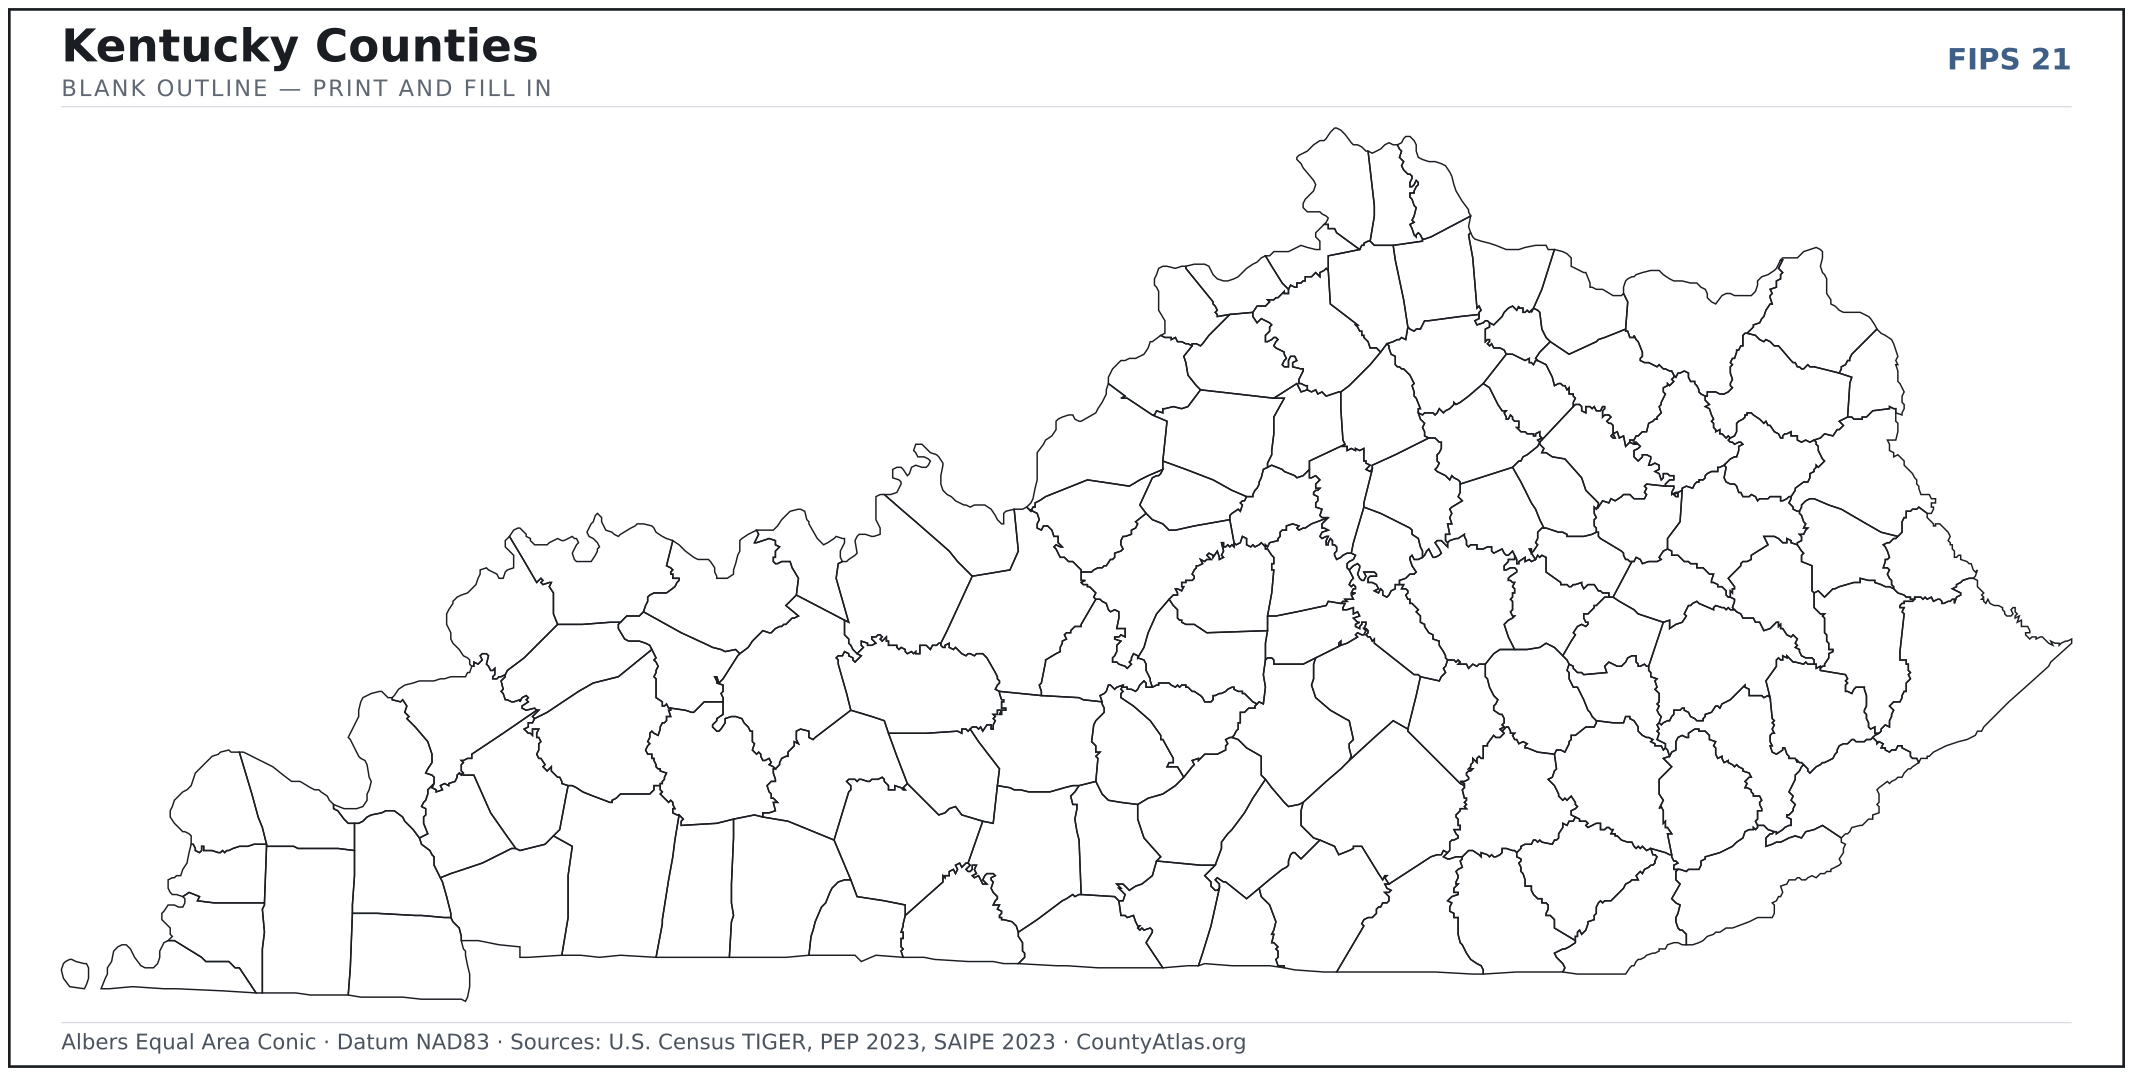
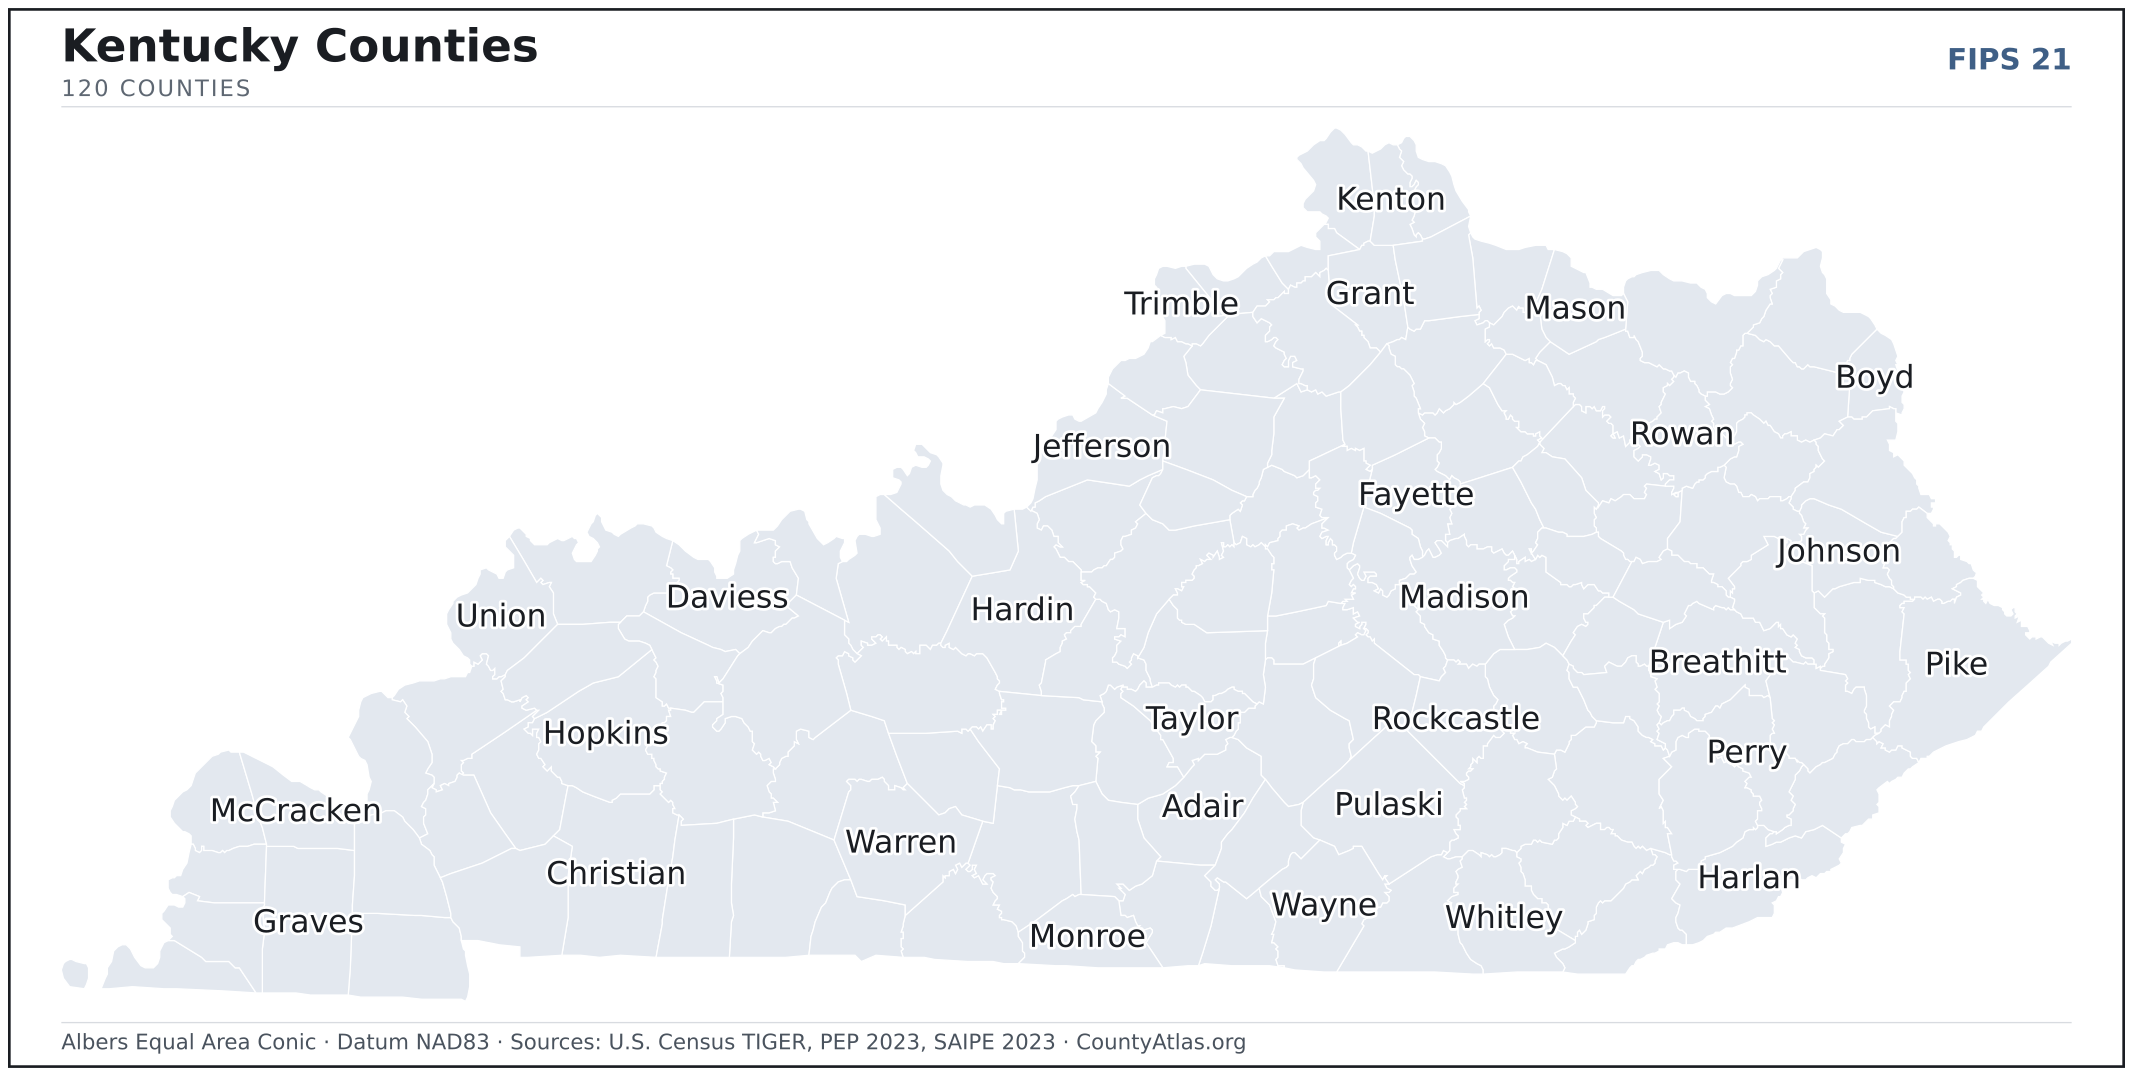
Kentucky maps, coloured by the data
Cities in Kentucky
Kentucky has 415 incorporated urban countys and cities. The largest is Louisville/Jefferson County metro government (balance) in Jefferson County with 627,210 residents. Use the search on the map above to find any city and highlight the county it sits in.
| Louisville/Jefferson County metro government (balance) | Jefferson County | 627,210 |
| Lexington-Fayette (urban county) | Fayette County | 321,122 |
| Bowling Green | Warren County | 73,638 |
| Owensboro | Daviess County | 60,112 |
| Covington | Kenton County | 40,902 |
| Georgetown | Scott County | 38,206 |
| Richmond | Madison County | 35,498 |
| Florence | Boone County | 32,334 |
| Elizabethtown | Hardin County | 31,870 |
| Nicholasville | Jessamine County | 31,625 |
| Hopkinsville | Christian County | 31,011 |
| Independence | Kenton County | 29,024 |
| Jeffersontown | Jefferson County | 28,988 |
| Frankfort | Franklin County | 28,452 |
| Henderson | Henderson County | 27,994 |
| Paducah | McCracken County | 26,894 |
| Radcliff | Hardin County | 22,967 |
| Ashland | Boyd County | 21,405 |
| Erlanger | Kenton County | 19,677 |
| Madisonville | Hopkins County | 19,442 |
| Winchester | Clark County | 19,133 |
| Mount Washington | Bullitt County | 18,228 |
| Murray | Calloway County | 17,888 |
| St. Matthews | Jefferson County | 17,491 |
| Shelbyville | Shelby County | 17,436 |
| Fort Thomas | Campbell County | 17,242 |
| Danville | Boyle County | 17,235 |
| Berea | Madison County | 15,557 |
| Shively | Jefferson County | 15,556 |
| Glasgow | Barren County | 15,141 |
| Shepherdsville | Bullitt County | 14,351 |
| Newport | Campbell County | 14,039 |
| Bardstown | Nelson County | 13,673 |
| Somerset | Pulaski County | 12,108 |
| Lawrenceburg | Anderson County | 11,838 |
| Campbellsville | Taylor County | 11,523 |
| Lyndon | Jefferson County | 10,956 |
| Alexandria | Campbell County | 10,430 |
| Versailles | Woodford County | 10,382 |
| Franklin | Simpson County | 10,254 |
| La Grange | Oldham County | 10,188 |
| Paris | Bourbon County | 10,107 |
| Mayfield | Graves County | 9,905 |
| Middletown | Jefferson County | 9,622 |
| Middlesborough | Bell County | 9,258 |
| Elsmere | Kenton County | 9,151 |
| Harrodsburg | Mercer County | 9,126 |
| Maysville | Mason County | 8,778 |
| Hillview | Bullitt County | 8,735 |
| Fort Mitchell | Kenton County | 8,676 |
Showing the 50 most populous — and 365 more. Search the map above for any Kentucky city or village.
A city can span more than one county; each is listed in its primary county — the one its center falls in.
Which Kentucky county is the richest, largest, most crowded? The answers
- Kentucky’s highest median household income is in Oldham County ($120,818); the lowest is in Owsley County ($35,000). Census SAIPE 2023
- Kentucky’s most populous county is Jefferson County (772,144); the least populous is Robertson County (2,313) — a 334× spread. Census PEP 2023
- Kentucky’s largest county by land area is Pike County (786 sq mi); the smallest is Gallatin County (98 sq mi). Census TIGER
- Kentucky’s highest population density is in Jefferson County (2,027/sq mi); the lowest is in Hickman County (18/sq mi). Census PEP 2023 · TIGER
- Kentucky’s highest poverty rate is in Martin County (48.1%); the lowest is in Oldham County (5.8%). Census SAIPE 2023
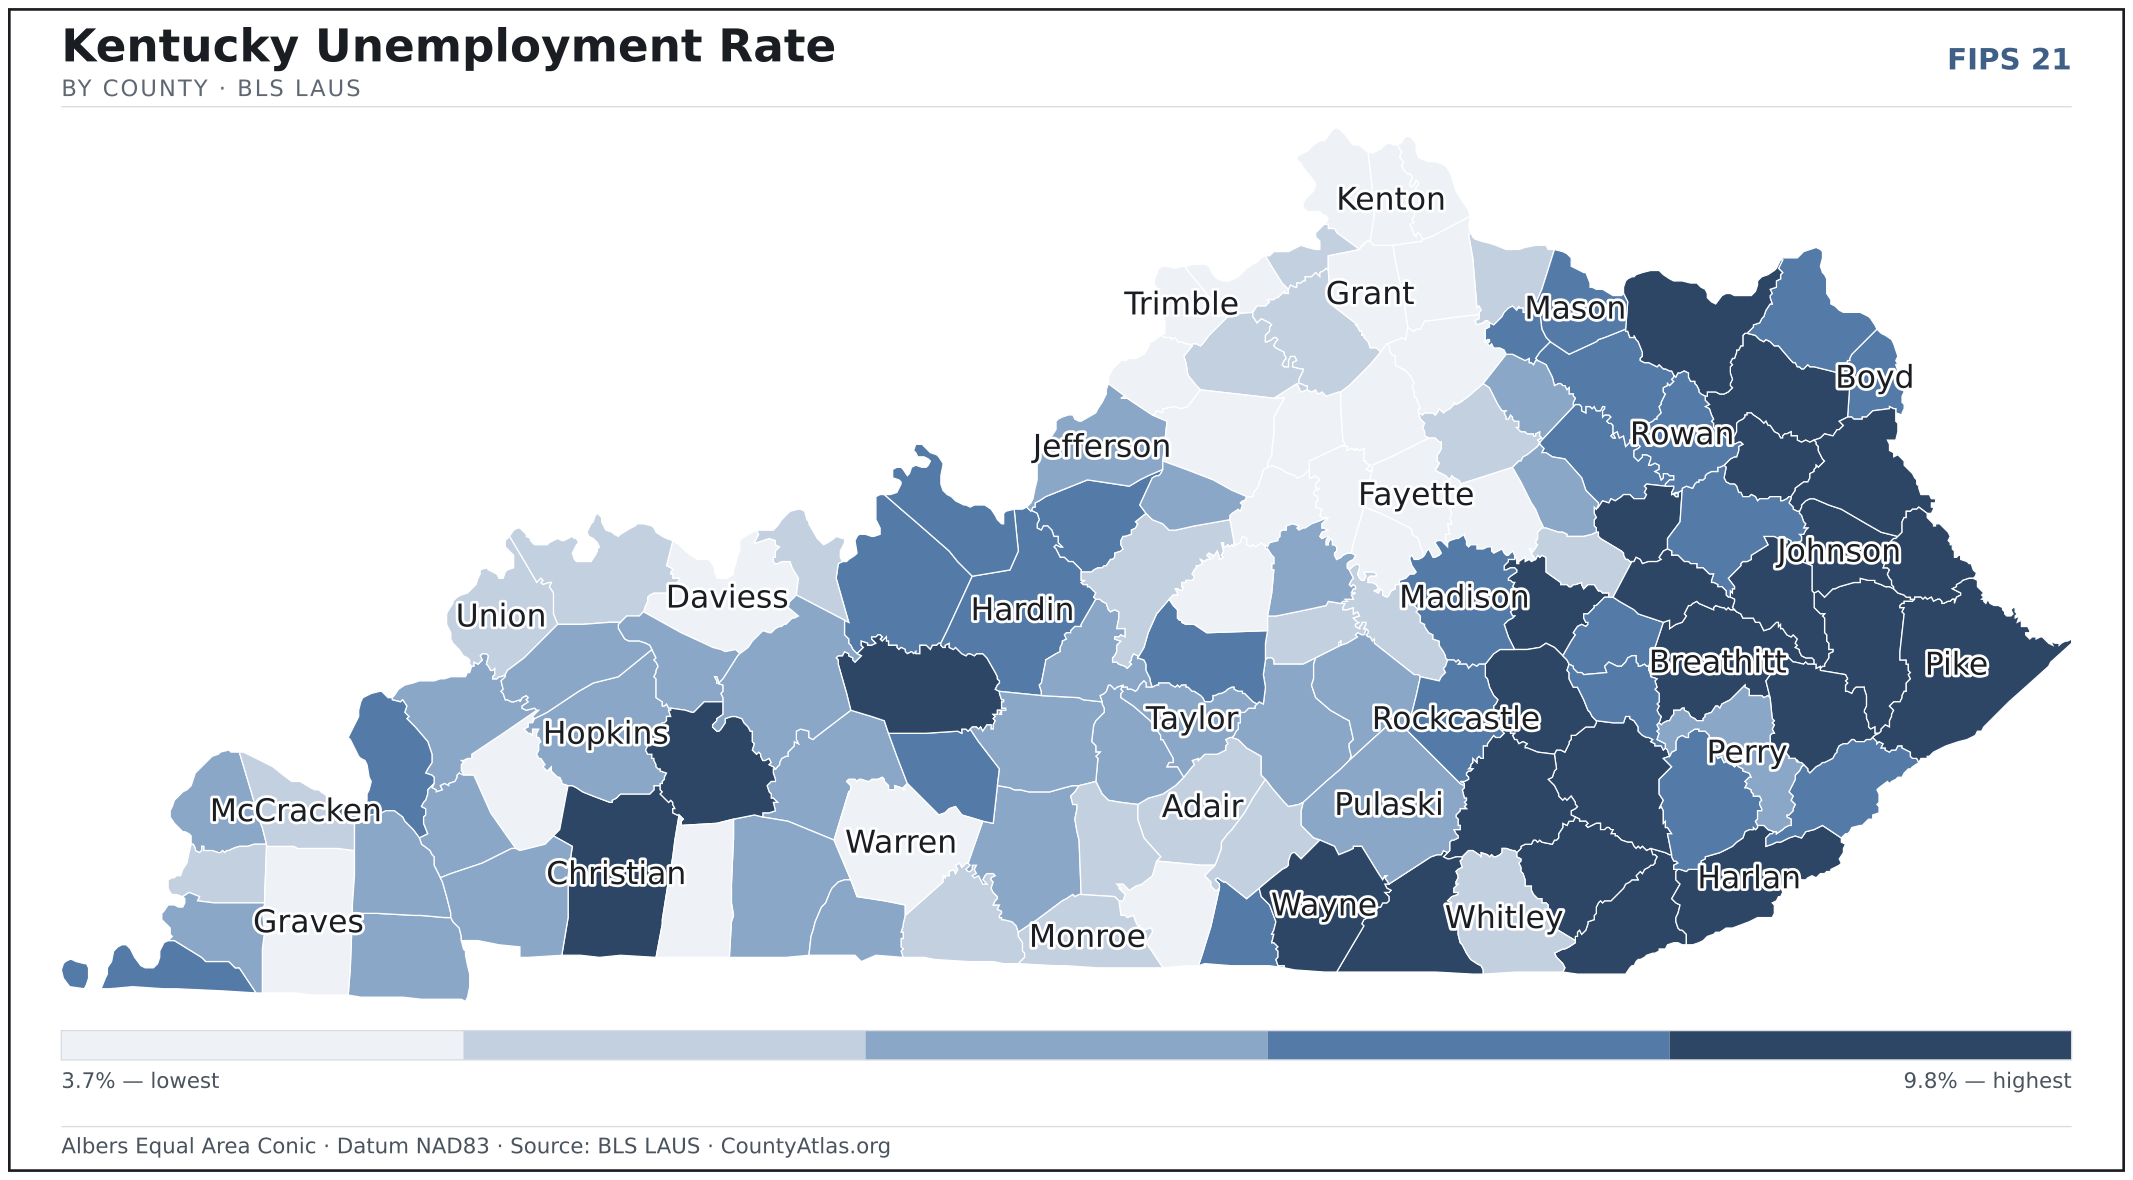
- In Kentucky, unemployment is highest in Martin County (9.8%) and lowest in Woodford County (3.7%), for May 2026. BLS LAUS
- Kentucky’s highest median age is in Owsley County (47.9); the lowest is in Christian County (28.6). Census ACS 2019–2023
- Kentucky’s highest share of bachelor’s degrees is in Fayette County (47.3% of adults); the lowest is in Elliott County (6.2%). Census ACS 2019–2023
Every figure is a current official estimate from the source named — not a crowd-sourced or copied value. Suppressed estimates (coefficient of variation ≥ 0.30) are omitted, never guessed. See the full methodology.
Kentucky counties: common questions
How many counties are in Kentucky?
Kentucky has 120 counties covering 39,486 sq mi and about 4.5M residents. Every one is on the map above and in the table below.
What is the largest county in Kentucky?
It depends on the measure. By land area it’s Pike County (786 sq mi); by population it’s Jefferson County (772,144 residents).
What county is Louisville/Jefferson County metro government (balance) in?
Louisville/Jefferson County metro government (balance) (population 627,210) is in Jefferson County. Use the search on the map to find any Kentucky city’s county.
What is the richest county in Kentucky?
By median household income, Oldham County is the richest at $120,818; the poorest is Owsley County at $35,000 (Census SAIPE 2023).
What is the most populous county in Kentucky?
Jefferson County, with 772,144 residents — about 17.1% of Kentucky’s people, and 334× the least populous, Robertson County (2,313).
Sources & vintages
- Population — PEP Vintage 2023 (July 1, 2023) — pep/charv
- Median household income & poverty — SAIPE 2023
- Unemployment — BLS LAUS May 2026 (preliminary)
- Geometry & boundaries — Census TIGERweb
- Cities & city population — Census TIGERweb Incorporated Places + ACS 5-year 2019–2023
Data current through .