CountyAtlas Massachusetts
Massachusetts County Map with Cities — All 14 Counties
All 14 of Massachusetts's counties, mapped from official U.S. Census boundaries with population, income, and unemployment for every one. Colour the map by any measure, tap a county for its data, or download a print-ready copy.
Tap any county for its population, income, and more.
Massachusetts at a glance
- Scale. Massachusetts is divided into 14 counties across 7,801 sq mi of land — an average of 557 sq mi each. Census TIGER
- People. Its counties are home to 7,001,399 residents — an average of 500,100 each, or 898 per square mile statewide. Census PEP 2023
- Water. Another 2,753 sq mi is water — 26.1% of the state’s area, led by Barnstable County. Census TIGER
Massachusetts’s 14 counties, by the numbers
Every county’s population, median household income, unemployment, density, and land area — sortable by any column, so you can find yours or rank by what matters to you. A few patterns run through the data:
- Concentrated. Half of Massachusetts’s 7,001,399 residents live in just 4 of 14 counties, and the five largest hold 68.5% of the total. Census PEP 2023
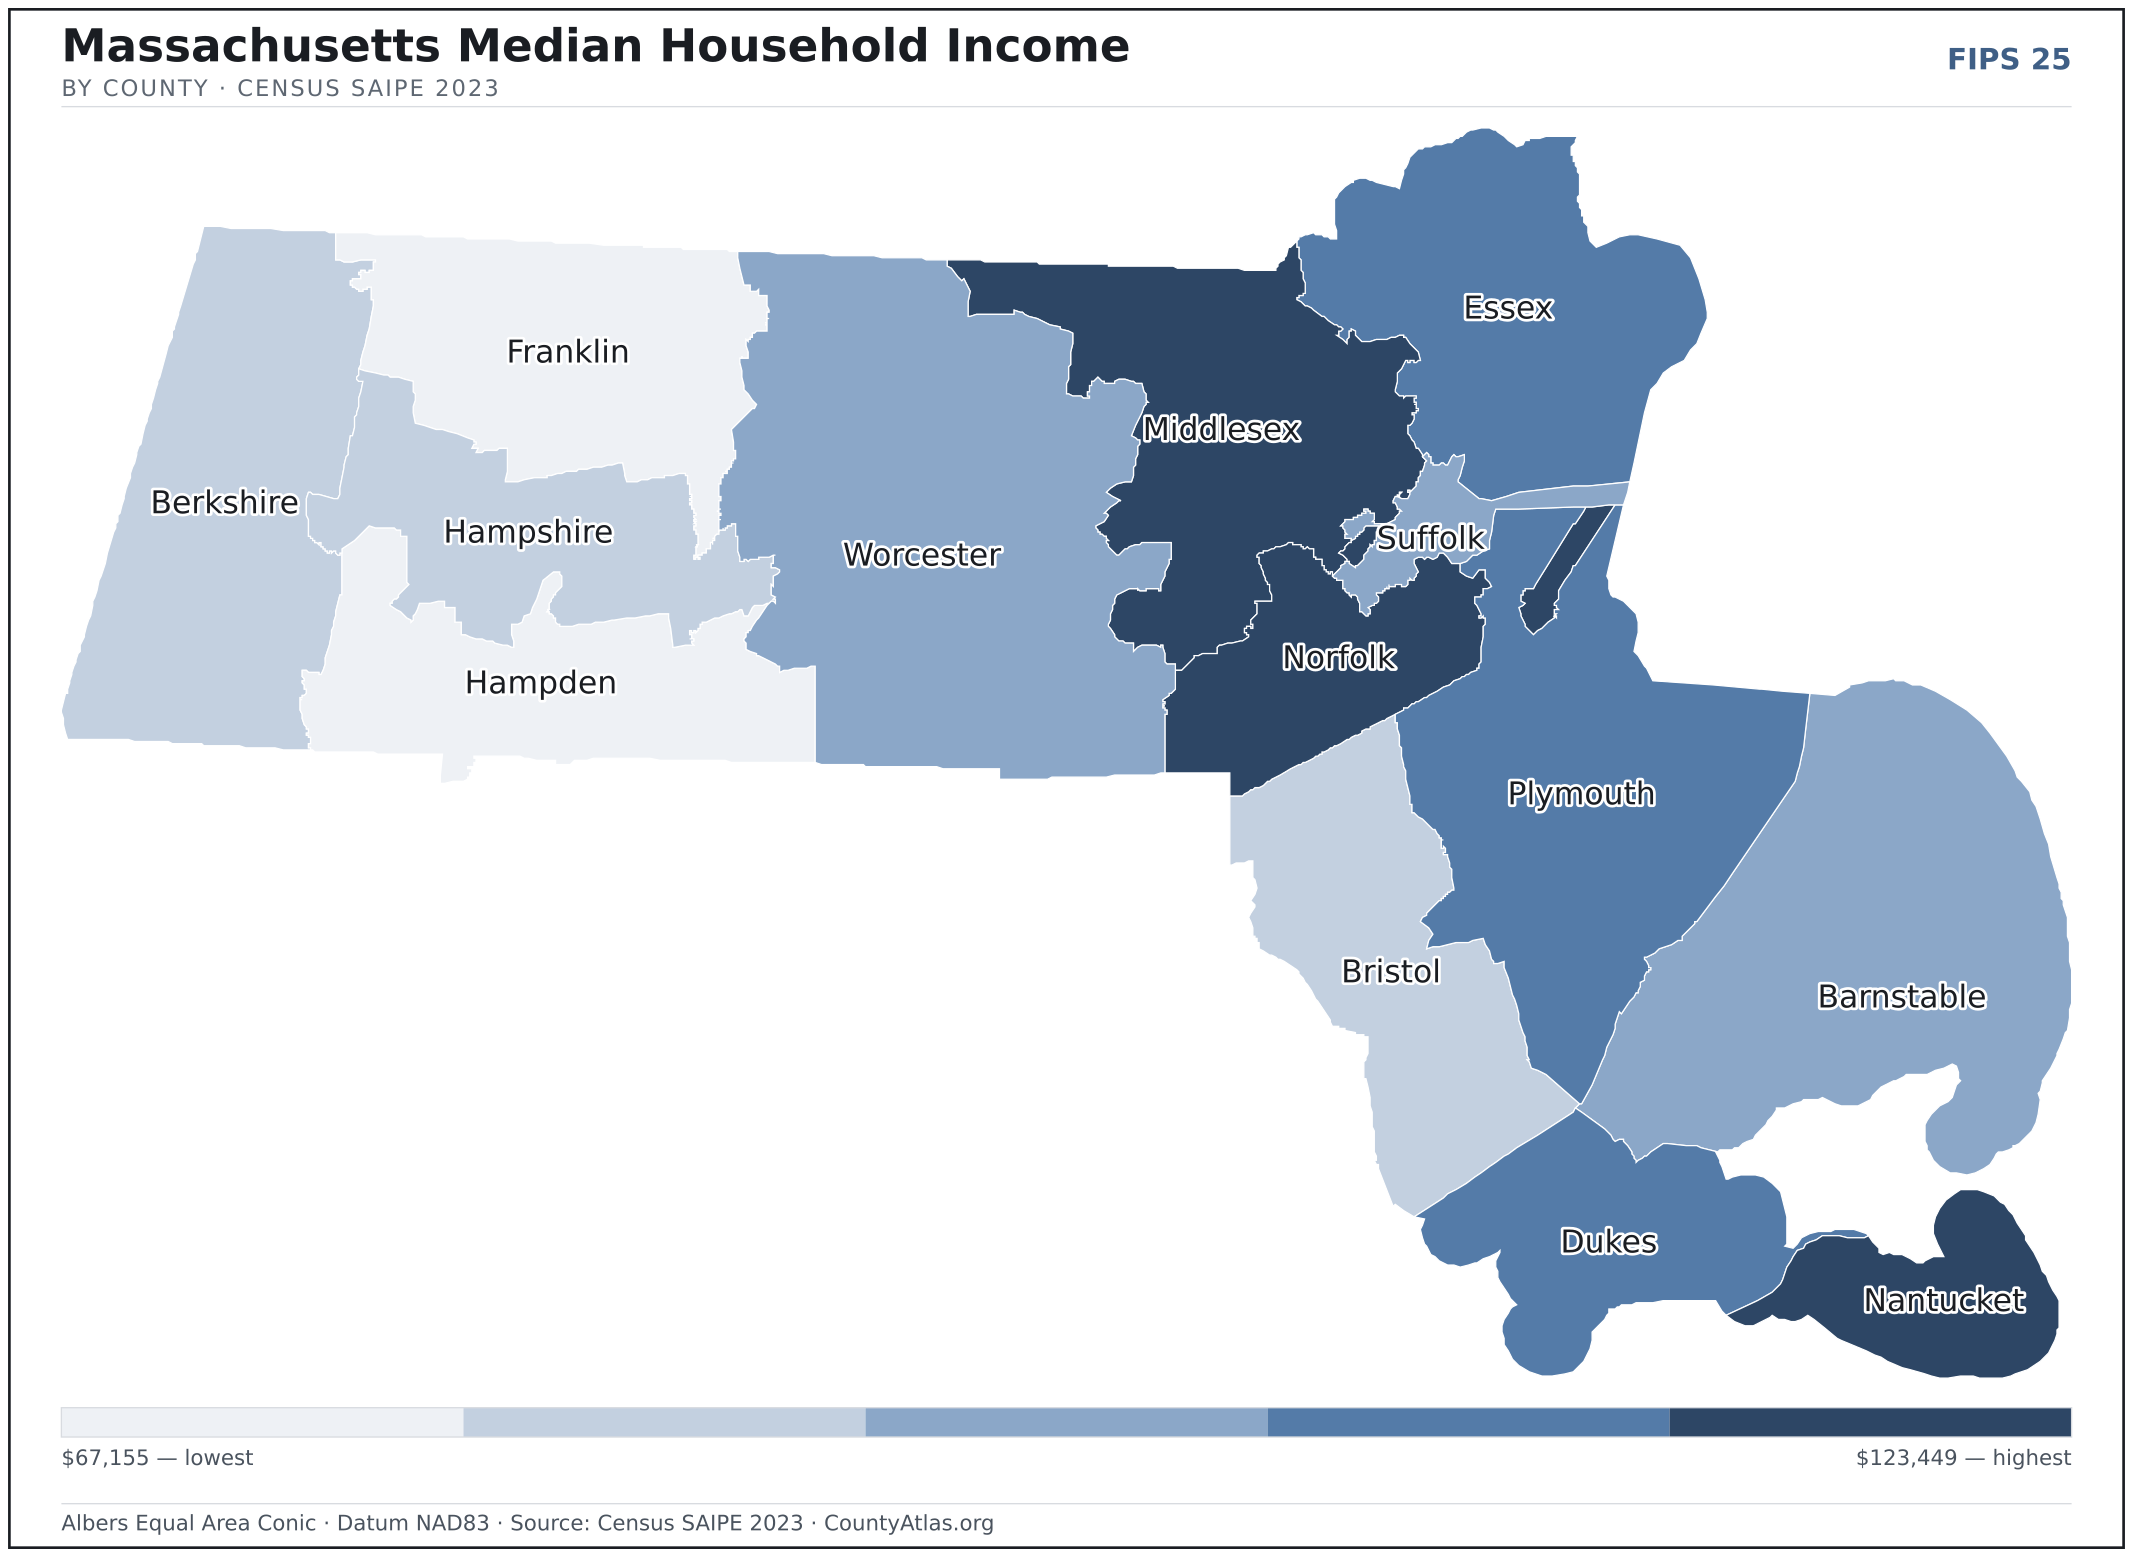
- Income tracks poverty. The gap from richest to poorest runs 1.8×, and the 7 highest-income counties average 8.4% in poverty against 13.0% for the 7 lowest. Census SAIPE 2023
- Mostly small. Half of Massachusetts’s counties have fewer than 497,800 residents, and half report a median household income below $92,474 — a few metros lift the statewide totals well above both. Census PEP 2023 · SAIPE 2023
- Lopsided density. Only 5 of 14 counties are denser than Massachusetts’s statewide average of 898 people per square mile — the rest are more rural. Census PEP 2023 · TIGER
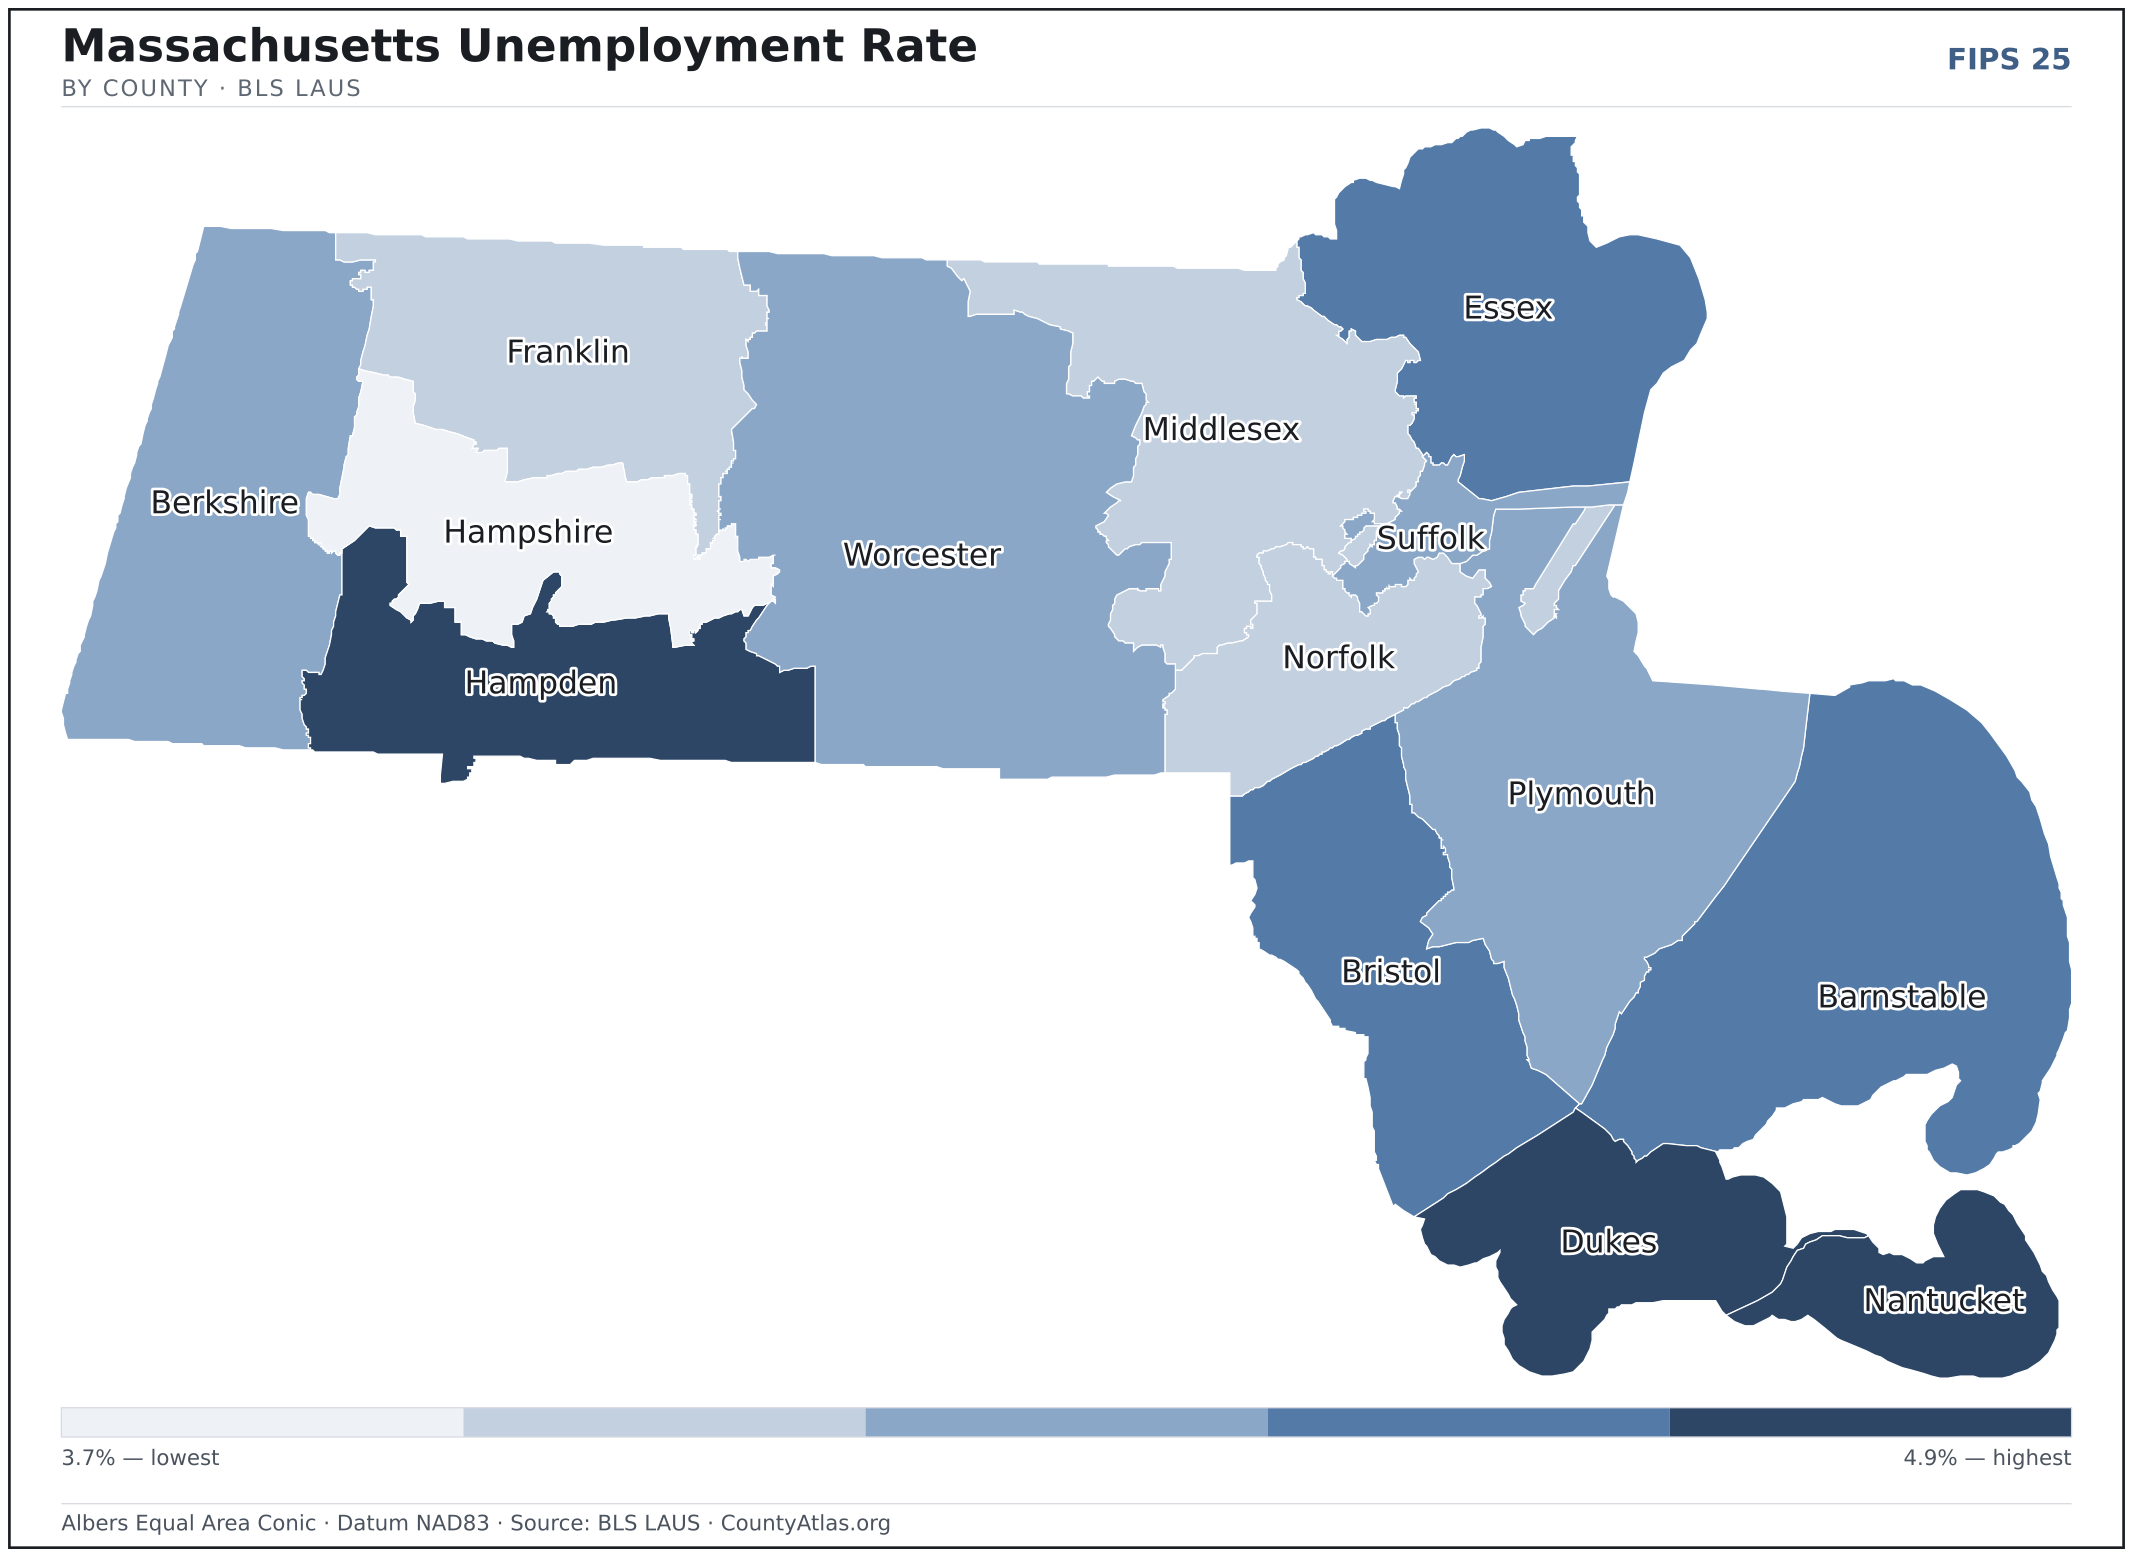
| Barnstable County | 231,735 | $89,448 | 4.4% | 588/sq mi | 394 sq mi | Barnstable Town |
| Berkshire County | 126,818 | $74,535 | 4.1% | 137/sq mi | 927 sq mi | Pittsfield |
| Bristol County | 581,841 | $81,047 | 4.5% | 1,052/sq mi | 553 sq mi | Taunton |
| Dukes County | 20,819 | $94,059 | 4.8% | 202/sq mi | 103 sq mi | Edgartown |
| Essex County | 810,089 | $96,303 | 4.3% | 1,645/sq mi | 493 sq mi | Salem |
| Franklin County | 70,836 | $71,256 | 3.9% | 101/sq mi | 699 sq mi | Greenfield |
| Hampden County | 460,291 | $67,155 | 4.9% | 746/sq mi | 617 sq mi | Springfield |
| Hampshire County | 162,502 | $80,839 | 3.7% | 308/sq mi | 527 sq mi | Northampton |
| Middlesex County | 1,623,952 | $123,288 | 3.8% | 1,986/sq mi | 818 sq mi | Cambridge; Lowell |
| Nantucket County | 14,444 | $108,671 | 4.7% | 313/sq mi | 46 sq mi | Nantucket |
| Norfolk County | 727,473 | $123,449 | 3.8% | 1,837/sq mi | 396 sq mi | Dedham |
| Plymouth County | 535,308 | $107,828 | 4.1% | 813/sq mi | 659 sq mi | Plymouth |
| Suffolk County | 768,425 | $91,386 | 4.1% | 13,190/sq mi | 58 sq mi | Boston |
| Worcester County | 866,866 | $93,561 | 4.1% | 574/sq mi | 1,511 sq mi | Worcester |
All 14 counties, sortable by any column — click a heading. A suppressed estimate (coefficient of variation ≥ 0.30) shows a marker, never a guess. County seats are from Wikidata (CC0), each validated to a Census place inside its county; a county with no validated seat is left blank. See the methodology.
Download & print this Massachusetts map
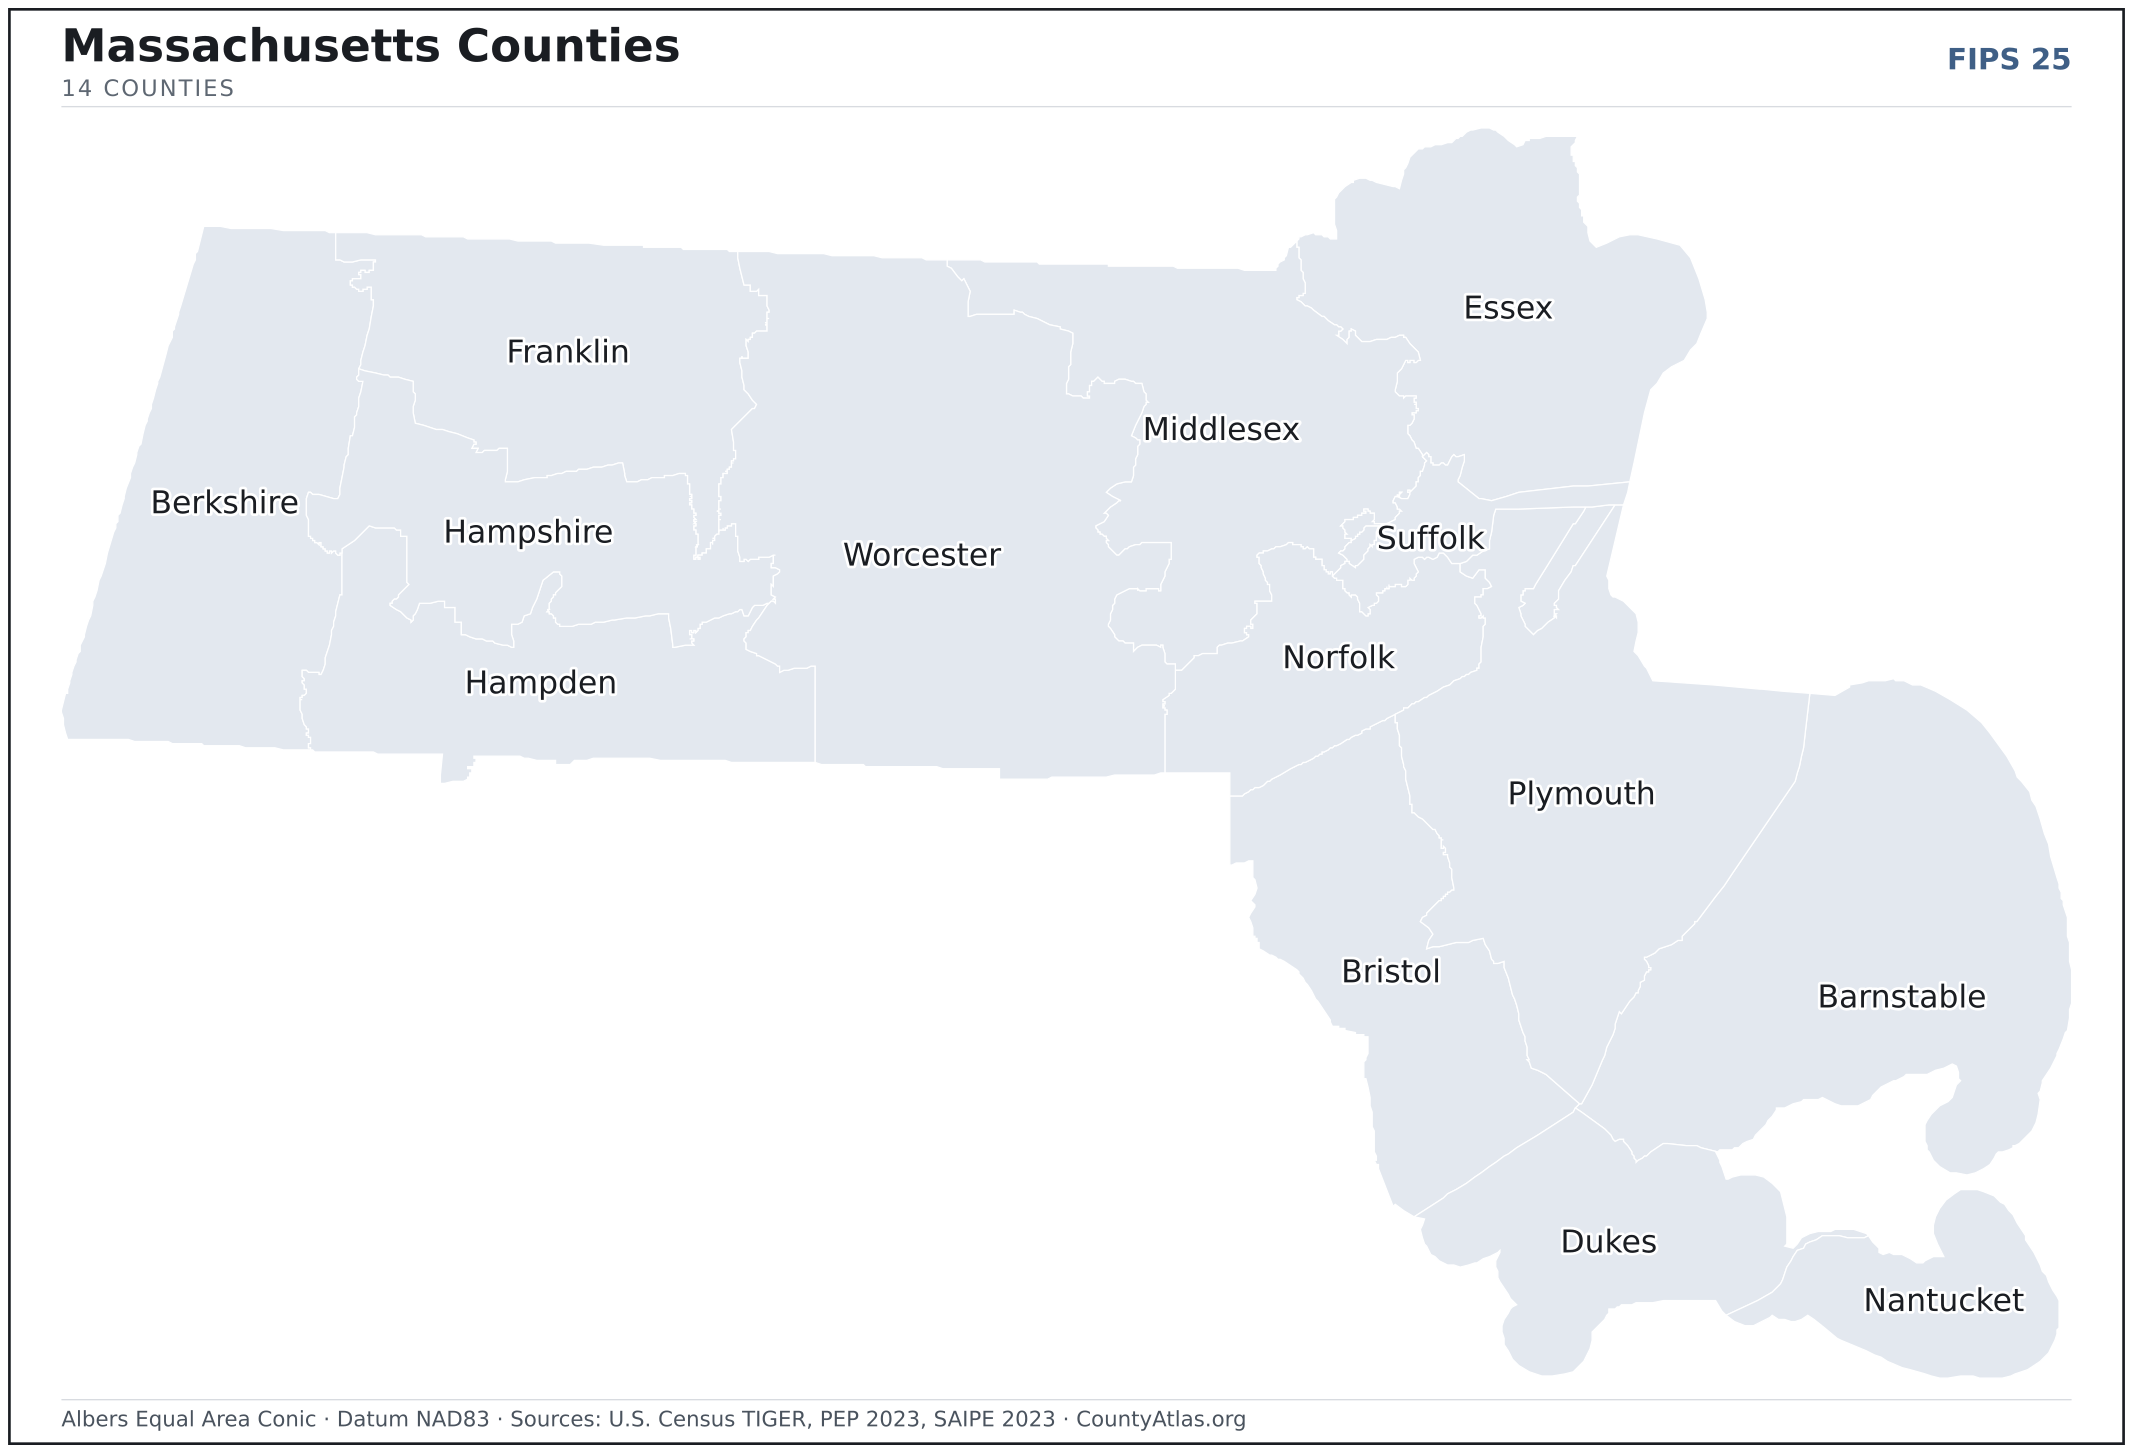
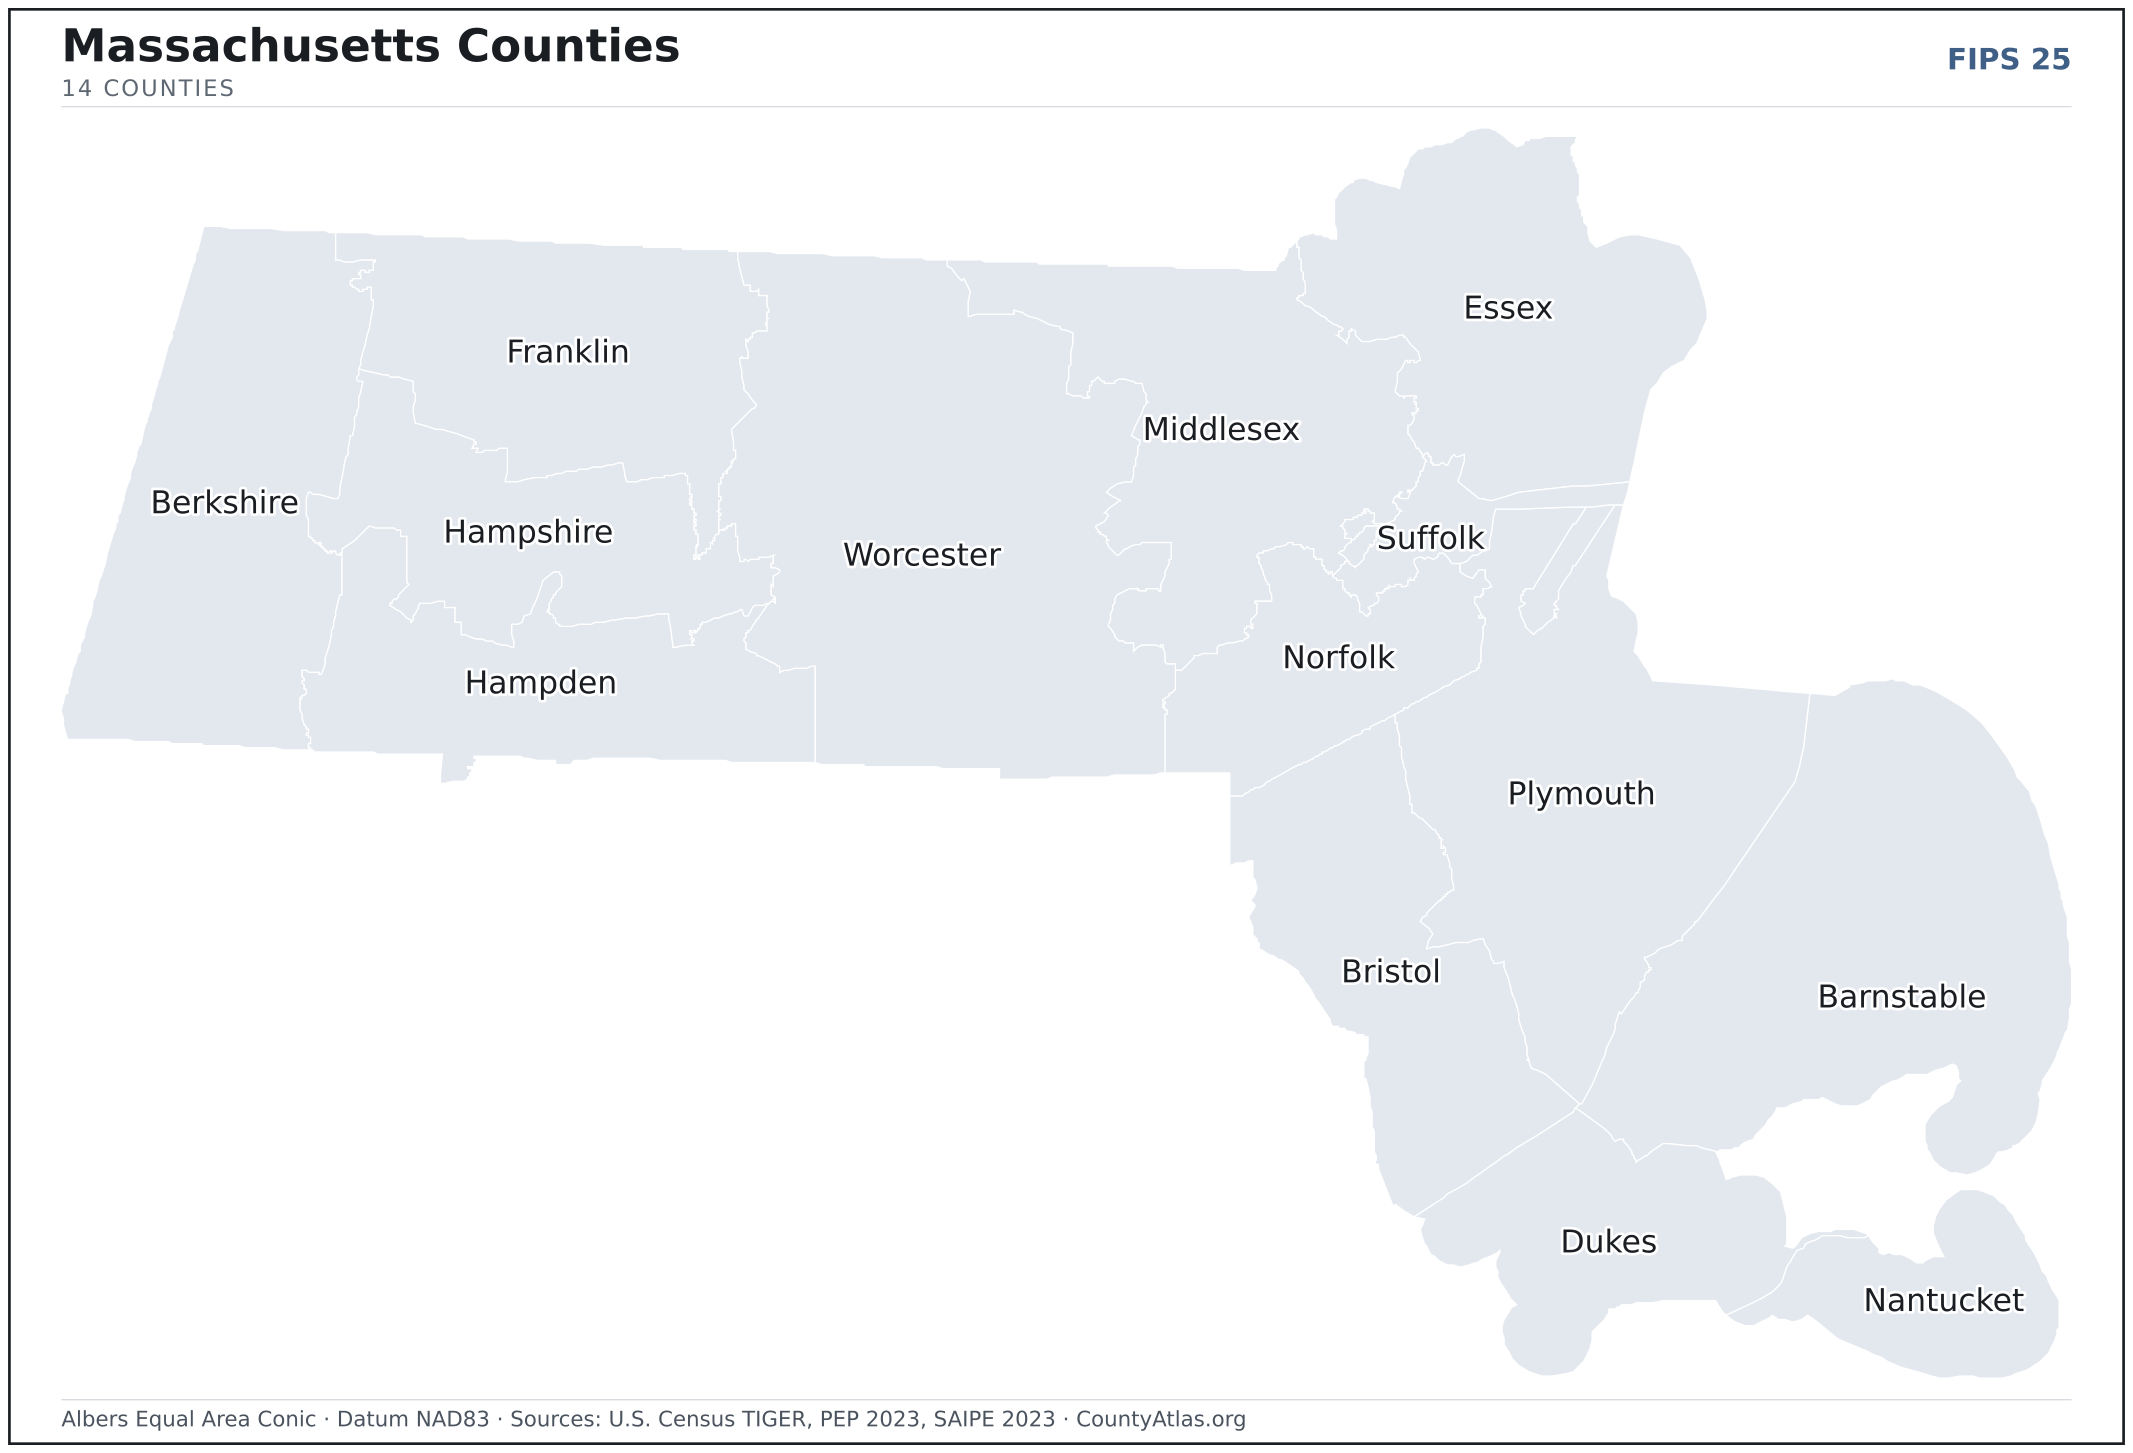
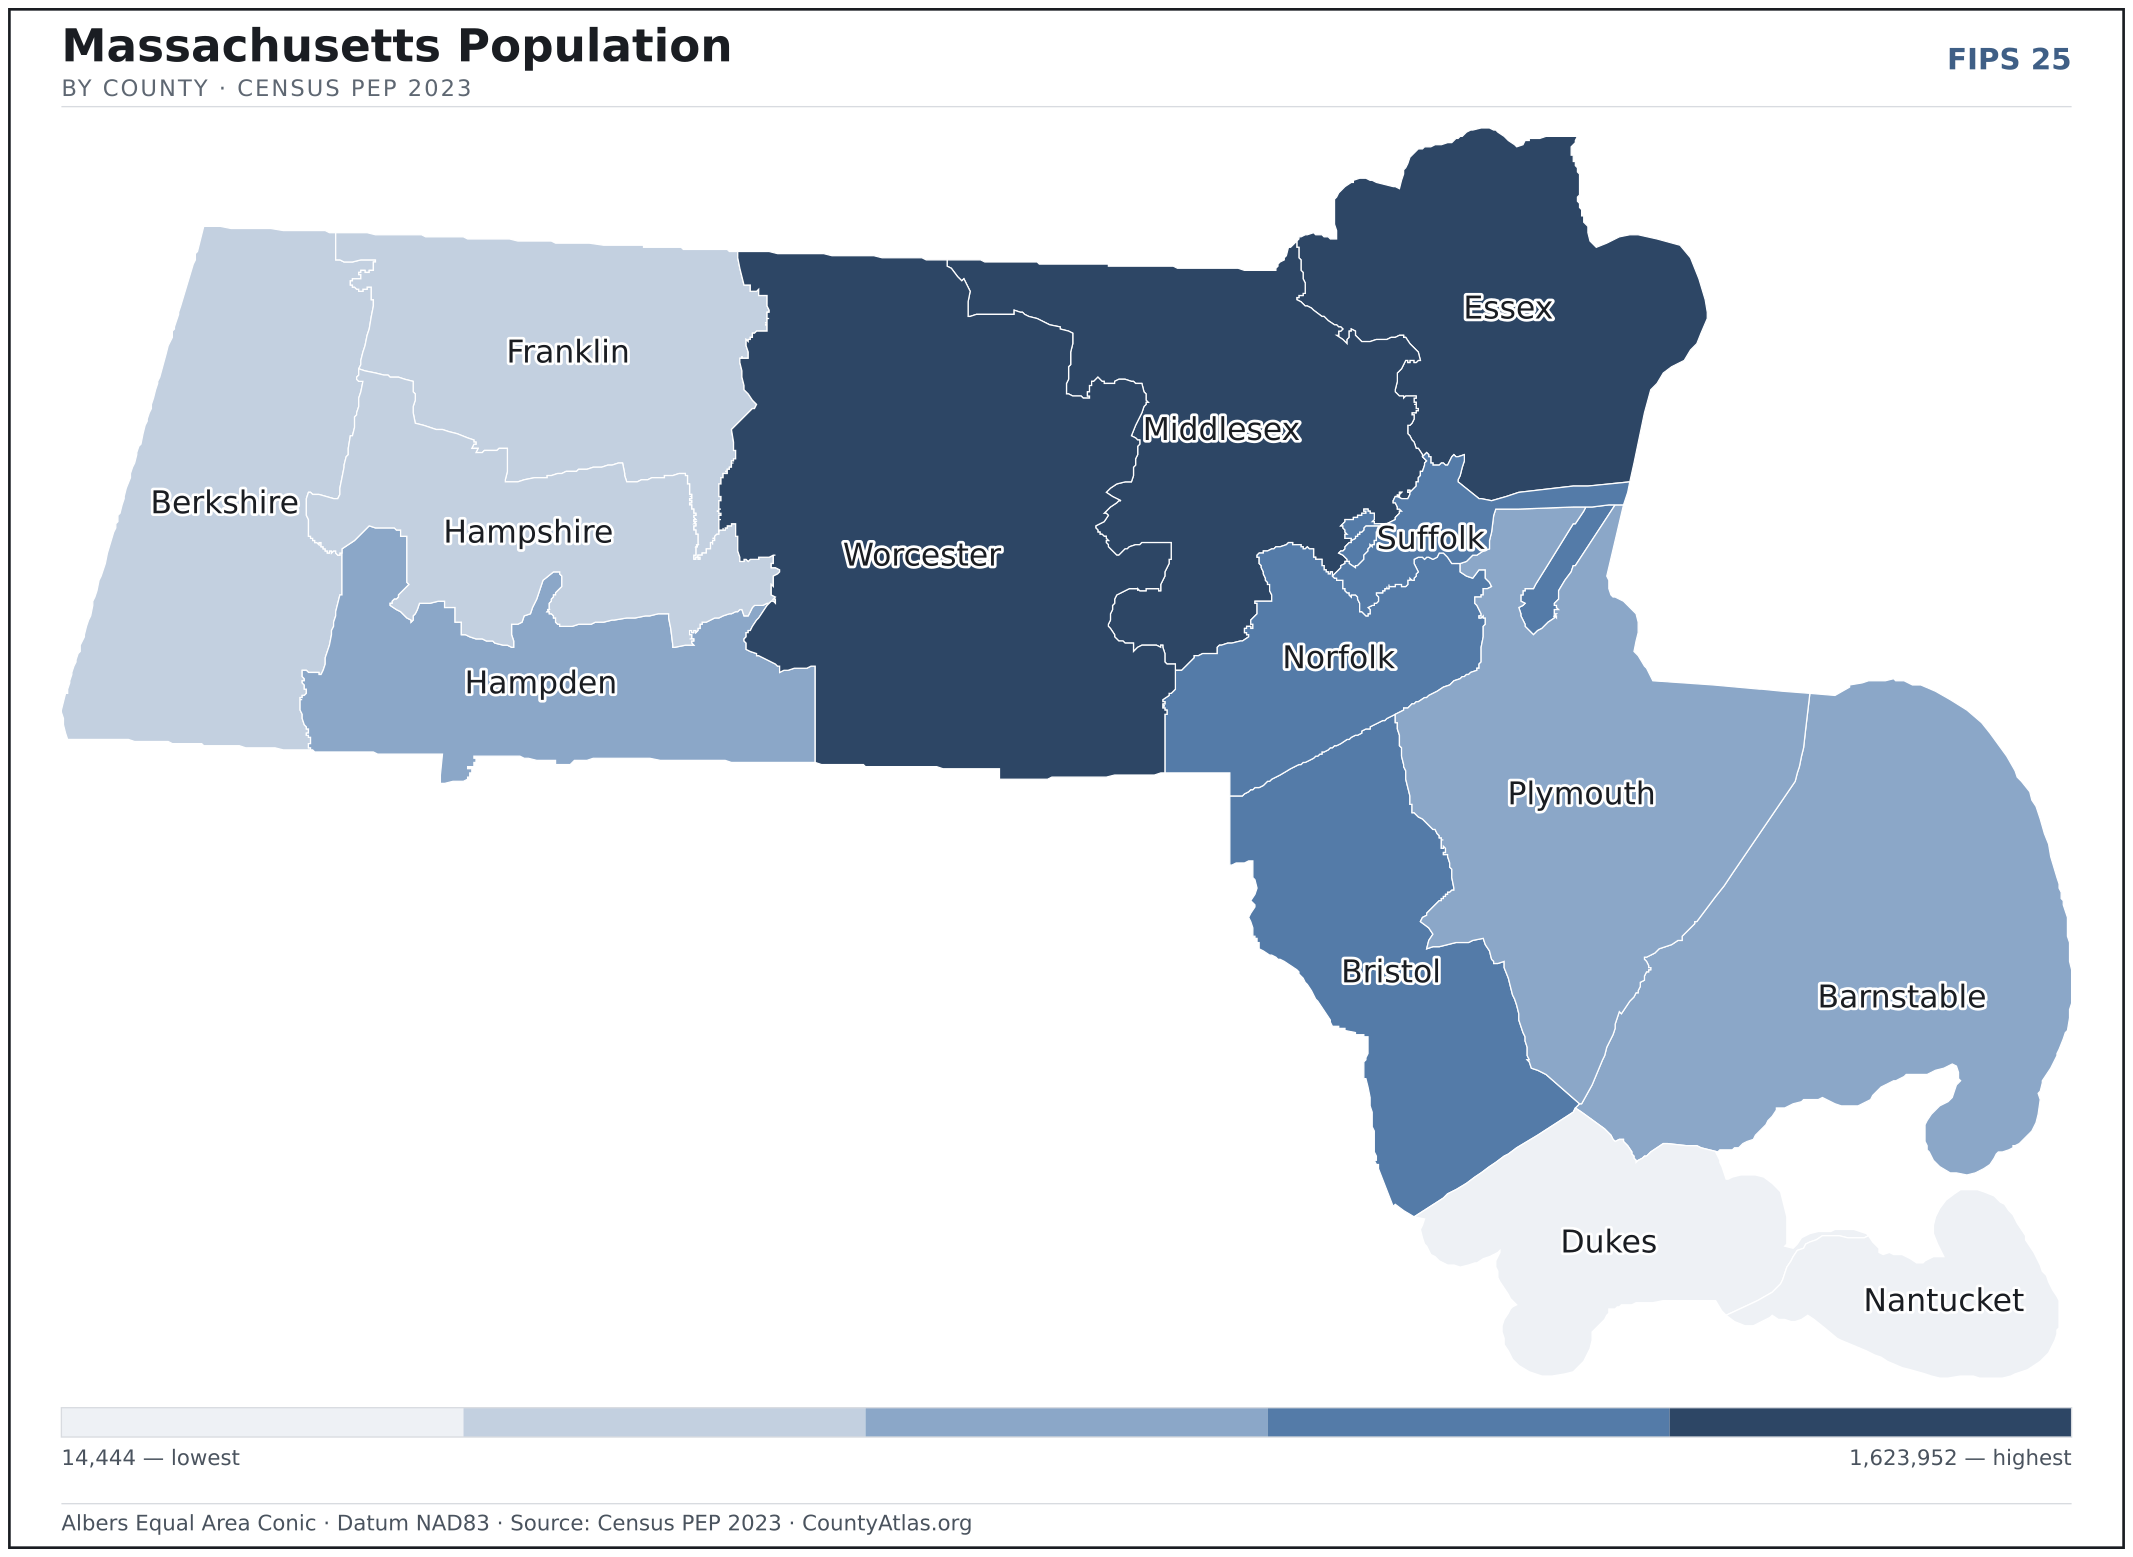
Massachusetts maps, coloured by the data
Cities in Massachusetts
Massachusetts has 58 incorporated cities. The largest is Boston in Suffolk County with 663,972 residents. Use the search on the map above to find any city and highlight the county it sits in.
| Boston | Suffolk County | 663,972 |
| Worcester | Worcester County | 205,501 |
| Springfield | Hampden County | 154,751 |
| Cambridge | Middlesex County | 117,794 |
| Lowell | Middlesex County | 114,799 |
| Brockton | Plymouth County | 105,080 |
| Quincy | Norfolk County | 101,361 |
| Lynn | Essex County | 100,905 |
| New Bedford | Bristol County | 100,731 |
| Fall River | Bristol County | 93,764 |
| Newton | Middlesex County | 88,504 |
| Lawrence | Essex County | 88,297 |
| Somerville | Middlesex County | 80,549 |
| Framingham | Middlesex County | 72,013 |
| Haverhill | Essex County | 67,387 |
| Malden | Middlesex County | 65,509 |
| Waltham | Middlesex County | 64,723 |
| Revere | Suffolk County | 59,933 |
| Taunton | Bristol County | 59,719 |
| Medford | Middlesex County | 59,062 |
| Weymouth Town | Norfolk County | 57,786 |
| Chicopee | Hampden County | 55,213 |
| Peabody | Essex County | 54,180 |
| Everett | Middlesex County | 49,236 |
| Barnstable Town | Barnstable County | 49,232 |
| Attleboro | Bristol County | 46,499 |
| Salem | Essex County | 44,241 |
| Leominster | Worcester County | 43,697 |
| Pittsfield | Berkshire County | 43,559 |
| Beverly | Essex County | 42,408 |
| Fitchburg | Worcester County | 41,633 |
| Marlborough | Middlesex County | 41,398 |
| Woburn | Middlesex County | 41,205 |
| Westfield | Hampden County | 40,673 |
| Chelsea | Suffolk County | 39,460 |
| Braintree Town | Norfolk County | 38,762 |
| Holyoke | Hampden County | 37,949 |
| Amherst Town | Hampshire County | 35,472 |
| Randolph Town | Norfolk County | 34,683 |
| Franklin Town | Norfolk County | 33,067 |
| North Attleborough Town | Bristol County | 30,842 |
| Gloucester | Essex County | 29,862 |
| Melrose | Middlesex County | 29,488 |
| Bridgewater Town | Plymouth County | 28,669 |
| Northampton | Hampshire County | 28,640 |
| West Springfield Town | Hampden County | 28,635 |
| Agawam Town | Hampden County | 28,510 |
| Gardner | Worcester County | 21,075 |
| Winthrop Town | Suffolk County | 18,807 |
| Newburyport | Essex County | 18,444 |
Showing the 50 most populous — and 8 more. Search the map above for any Massachusetts city or village.
A city can span more than one county; each is listed in its primary county — the one its center falls in.
Which Massachusetts county is the richest, largest, most crowded? The answers
- Massachusetts’s highest median household income is in Norfolk County ($123,449); the lowest is in Hampden County ($67,155). Census SAIPE 2023
- Massachusetts’s most populous county is Middlesex County (1,623,952); the least populous is Nantucket County (14,444) — a 112× spread. Census PEP 2023
- Massachusetts’s largest county by land area is Worcester County (1,511 sq mi); the smallest is Nantucket County (46 sq mi). Census TIGER
- Massachusetts’s highest population density is in Suffolk County (13,190/sq mi); the lowest is in Franklin County (101/sq mi). Census PEP 2023 · TIGER
- Massachusetts’s highest poverty rate is in Hampden County (17.6%); the lowest is in Nantucket County (6.5%). Census SAIPE 2023
- In Massachusetts, unemployment is highest in Hampden County (4.9%) and lowest in Hampshire County (3.7%), for May 2026. BLS LAUS
- Massachusetts’s highest median age is in Barnstable County (55.1); the lowest is in Suffolk County (33.8). Census ACS 2019–2023
- Massachusetts’s highest share of bachelor’s degrees is in Middlesex County (59.0% of adults); the lowest is in Hampden County (28.9%). Census ACS 2019–2023
Every figure is a current official estimate from the source named — not a crowd-sourced or copied value. Suppressed estimates (coefficient of variation ≥ 0.30) are omitted, never guessed. See the full methodology.
Massachusetts counties: common questions
How many counties are in Massachusetts?
Massachusetts has 14 counties covering 7,801 sq mi and about 7.0M residents. Every one is on the map above and in the table below.
What is the largest county in Massachusetts?
It depends on the measure. By land area it’s Worcester County (1,511 sq mi); by population it’s Middlesex County (1,623,952 residents).
What county is Boston in?
Boston (population 663,972) is in Suffolk County. Use the search on the map to find any Massachusetts city’s county.
What is the richest county in Massachusetts?
By median household income, Norfolk County is the richest at $123,449; the poorest is Hampden County at $67,155 (Census SAIPE 2023).
What is the most populous county in Massachusetts?
Middlesex County, with 1,623,952 residents — about 23.2% of Massachusetts’s people, and 112× the least populous, Nantucket County (14,444).
Sources & vintages
- Population — PEP Vintage 2023 (July 1, 2023) — pep/charv
- Median household income & poverty — SAIPE 2023
- Unemployment — BLS LAUS May 2026 (preliminary)
- Geometry & boundaries — Census TIGERweb
- Cities & city population — Census TIGERweb Incorporated Places + ACS 5-year 2019–2023
Data current through .