CountyAtlas Minnesota
Minnesota County Map with Cities — All 87 Counties
All 87 of Minnesota's counties, mapped from official U.S. Census boundaries with population, income, and unemployment for every one. Colour the map by any measure, tap a county for its data, or download a print-ready copy.
Tap any county for its population, income, and more.
Minnesota at a glance
- Scale. Minnesota is divided into 87 counties across 79,632 sq mi of land — an average of 915 sq mi each. Census TIGER
- People. Its counties are home to 5,737,915 residents — an average of 65,953 each, or 72 per square mile statewide. Census PEP 2023
- Water. Another 7,311 sq mi is water — 8.4% of the state’s area, led by Cook County. Census TIGER
Minnesota’s 87 counties, by the numbers
Every county’s population, median household income, unemployment, density, and land area — sortable by any column, so you can find yours or rank by what matters to you. A few patterns run through the data:
- Concentrated. Half of Minnesota’s 5,737,915 residents live in just 5 of 87 counties, and the five largest hold 50.4% of the total. Census PEP 2023
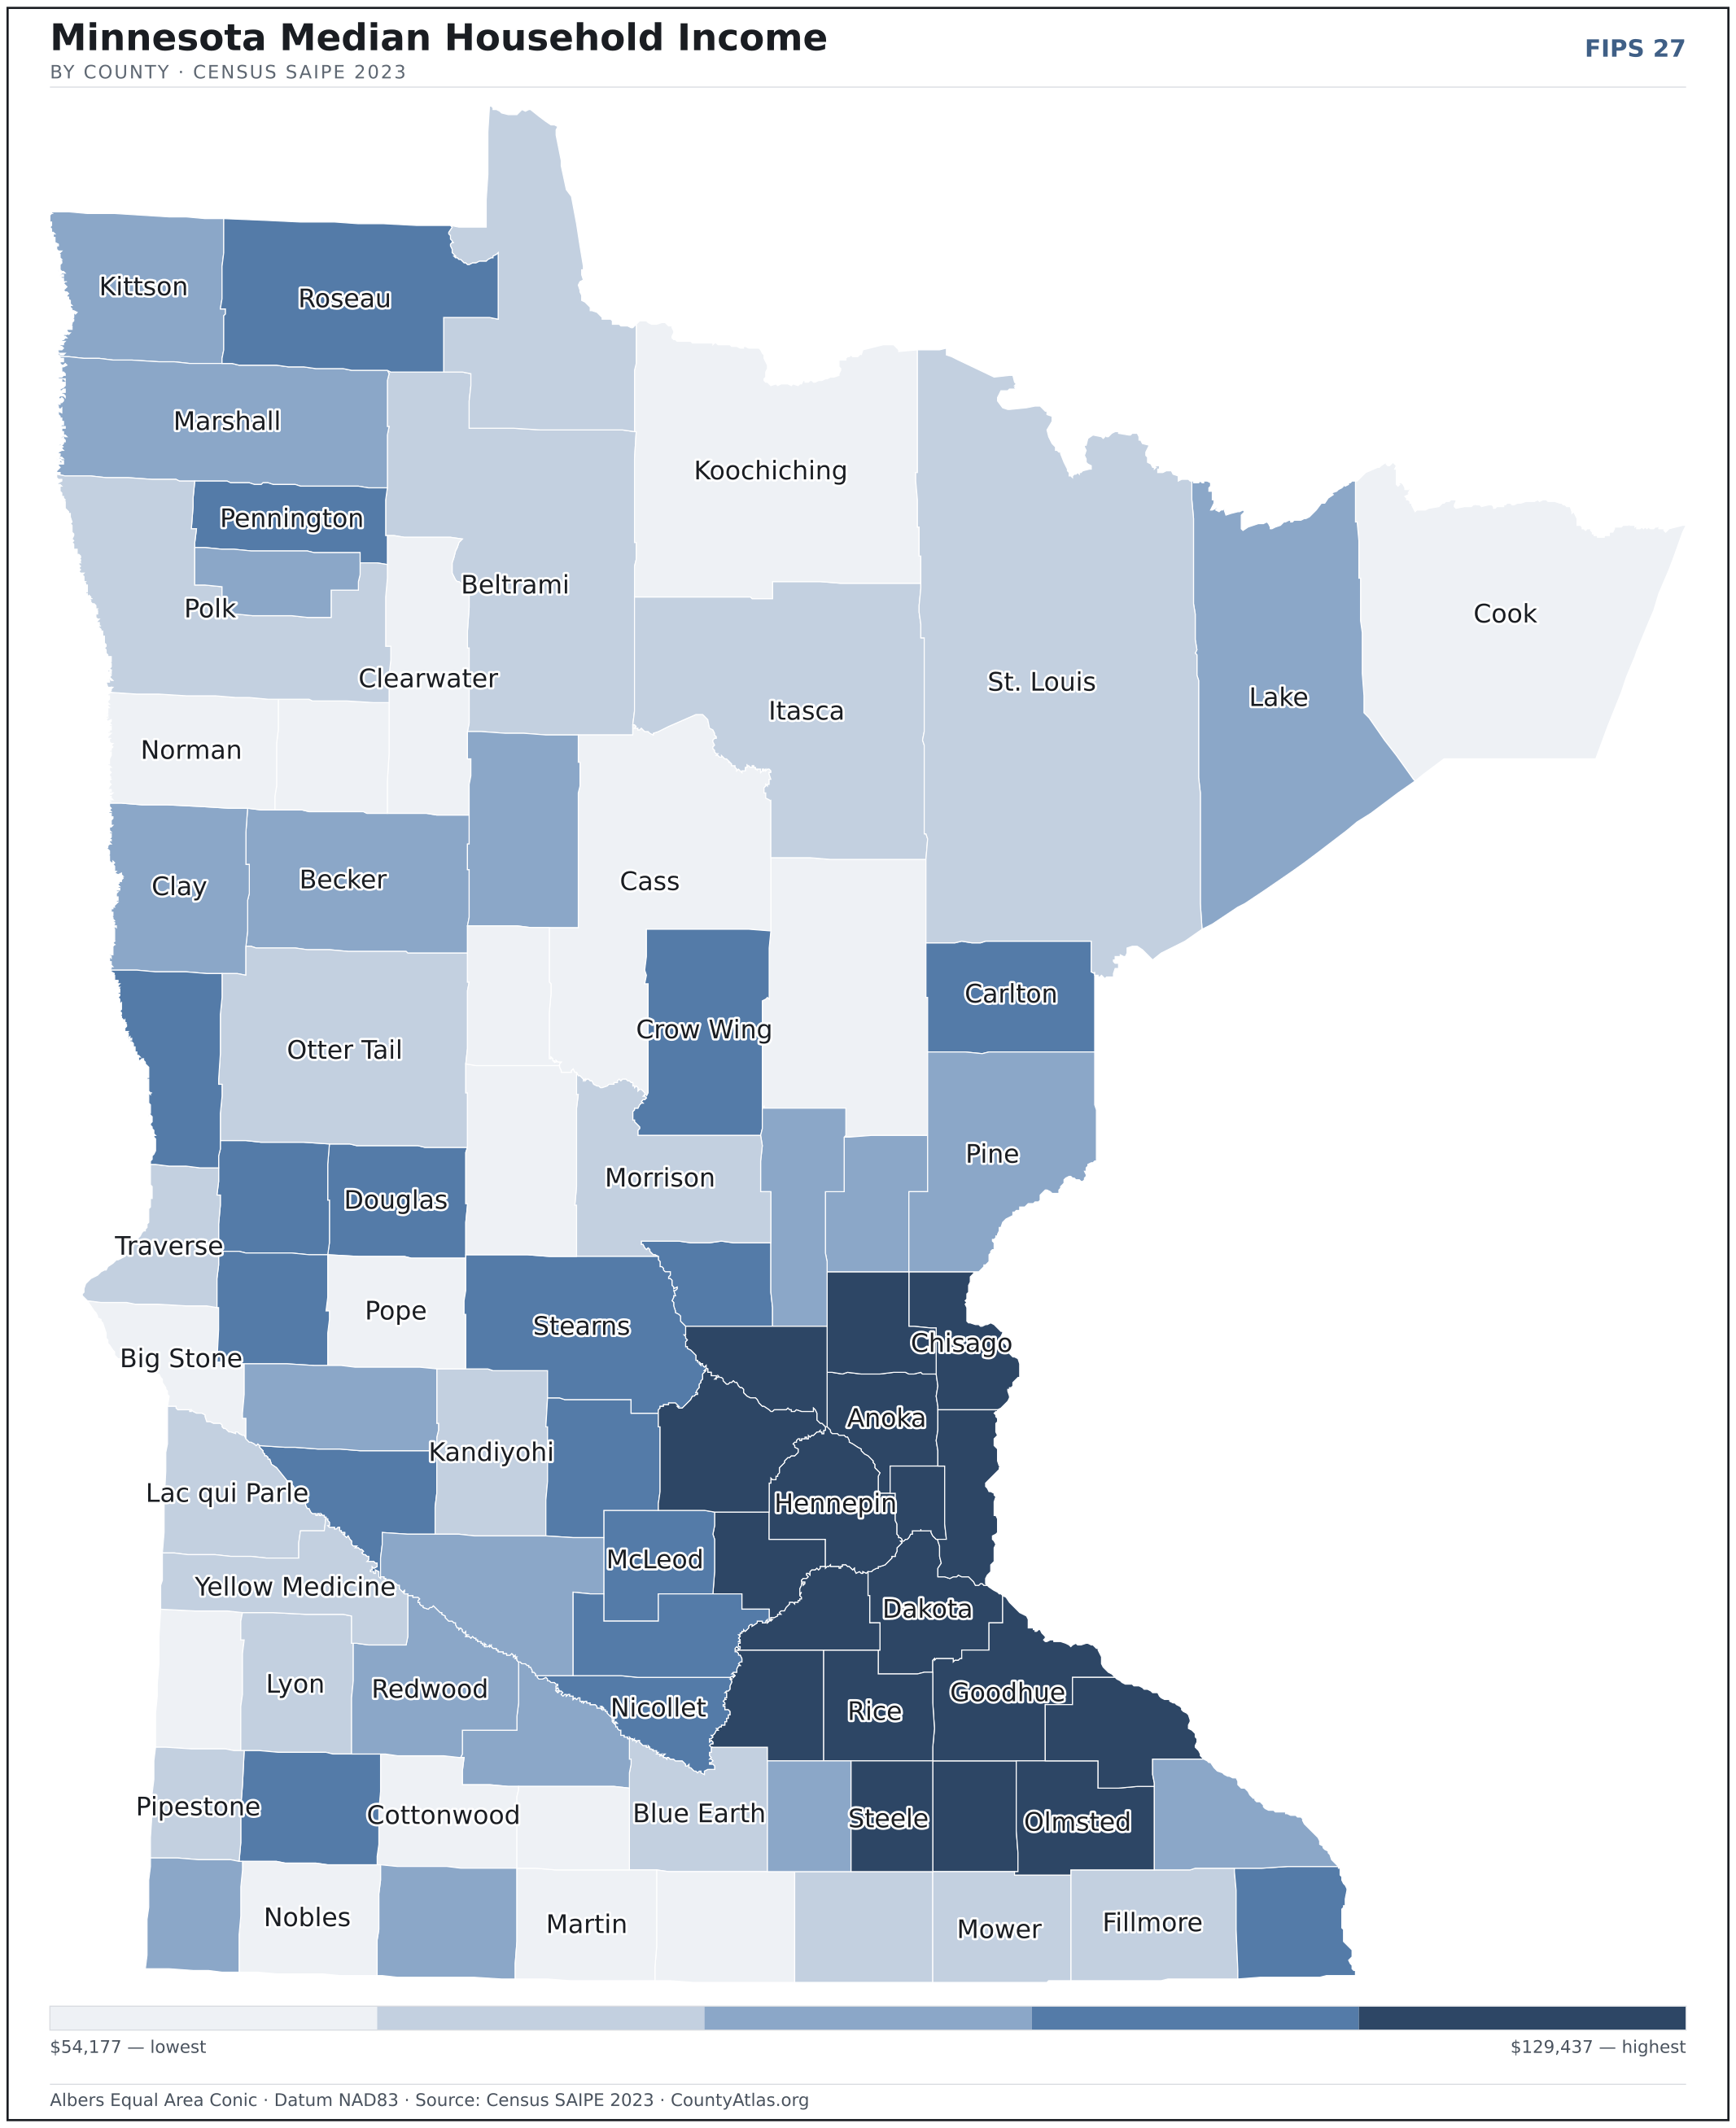
- Income tracks poverty. The gap from richest to poorest runs 2.4×, and the 10 highest-income counties average 6.2% in poverty against 13.2% for the 10 lowest. Census SAIPE 2023
- Mostly small. Half of Minnesota’s counties have fewer than 22,132 residents, and half report a median household income below $71,573 — a few metros lift the statewide totals well above both. Census PEP 2023 · SAIPE 2023
- Lopsided density. Only 20 of 87 counties are denser than Minnesota’s statewide average of 72 people per square mile — the rest are more rural. Census PEP 2023 · TIGER
| Aitkin County | 16,102 | $59,844 | 5.7% | 9/sq mi | 1,821 sq mi | Aitkin |
| Anoka County | 372,441 | $96,661 | 4.1% | 883/sq mi | 422 sq mi | Anoka |
| Becker County | 35,283 | $71,719 | 3.7% | 27/sq mi | 1,315 sq mi | Detroit Lakes |
| Beltrami County | 46,718 | $65,855 | 4.7% | 19/sq mi | 2,505 sq mi | Bemidji |
| Benton County | 41,600 | $74,677 | 4.2% | 102/sq mi | 408 sq mi | Foley |
| Big Stone County | 5,105 | $62,245 | 3.6% | 10/sq mi | 499 sq mi | Ortonville |
| Blue Earth County | 70,006 | $67,236 | 4.0% | 94/sq mi | 748 sq mi | Mankato |
| Brown County | 25,628 | $71,884 | 3.7% | 42/sq mi | 611 sq mi | New Ulm |
| Carlton County | 36,825 | $75,512 | 4.6% | 43/sq mi | 861 sq mi | Carlton |
| Carver County | 111,057 | $129,437 | 3.7% | 314/sq mi | 354 sq mi | Chaska |
| Cass County | 31,446 | $61,490 | 5.0% | 16/sq mi | 2,021 sq mi | Walker |
| Chippewa County | 12,172 | $75,774 | 4.2% | 21/sq mi | 581 sq mi | Montevideo |
| Chisago County | 58,535 | $91,338 | 4.0% | 141/sq mi | 415 sq mi | Center City |
| Clay County | 66,258 | $72,172 | 3.9% | 63/sq mi | 1,045 sq mi | Moorhead |
| Clearwater County | 8,644 | $62,435 | 6.0% | 9/sq mi | 999 sq mi | Bagley |
| Cook County | 5,639 | $62,435 | 4.6% | 4/sq mi | 1,453 sq mi | Grand Marais |
| Cottonwood County | 11,319 | $63,898 | 3.8% | 18/sq mi | 640 sq mi | Windom |
| Crow Wing County | 68,304 | $74,540 | 4.2% | 68/sq mi | 998 sq mi | Brainerd |
| Dakota County | 447,440 | $100,012 | 3.9% | 795/sq mi | 563 sq mi | Hastings |
| Dodge County | 21,088 | $87,661 | 3.4% | 48/sq mi | 439 sq mi | Mantorville |
| Douglas County | 39,953 | $76,508 | 3.5% | 63/sq mi | 637 sq mi | Alexandria |
| Faribault County | 13,873 | $65,264 | 4.2% | 19/sq mi | 712 sq mi | Blue Earth |
| Fillmore County | 21,522 | $69,157 | 3.5% | 25/sq mi | 861 sq mi | Preston |
| Freeborn County | 30,515 | $66,215 | 3.8% | 43/sq mi | 707 sq mi | Albert Lea |
| Goodhue County | 48,035 | $83,979 | 3.9% | 63/sq mi | 757 sq mi | Red Wing |
| Grant County | 6,139 | $72,935 | 4.1% | 11/sq mi | 548 sq mi | Elbow Lake |
| Hennepin County | 1,258,713 | $93,642 | 4.0% | 2,272/sq mi | 554 sq mi | Minneapolis |
| Houston County | 18,582 | $77,043 | 3.5% | 34/sq mi | 552 sq mi | Caledonia |
| Hubbard County | 22,132 | $72,166 | 4.6% | 24/sq mi | 926 sq mi | Park Rapids |
| Isanti County | 43,182 | $85,799 | 4.2% | 99/sq mi | 436 sq mi | Cambridge |
| Itasca County | 45,365 | $65,386 | 5.7% | 17/sq mi | 2,667 sq mi | Grand Rapids |
| Jackson County | 9,919 | $72,413 | 3.5% | 14/sq mi | 703 sq mi | Jackson |
| Kanabec County | 16,602 | $70,384 | 5.6% | 32/sq mi | 522 sq mi | Mora |
| Kandiyohi County | 43,813 | $69,160 | 4.3% | 55/sq mi | 797 sq mi | Willmar |
| Kittson County | 4,060 | $72,224 | 3.4% | 4/sq mi | 1,099 sq mi | Hallock |
| Koochiching County | 11,751 | $64,009 | 6.2% | 4/sq mi | 3,105 sq mi | International Falls |
| Lac qui Parle County | 6,630 | $67,947 | 3.3% | 9/sq mi | 765 sq mi | Madison |
| Lake County | 10,855 | $71,573 | 4.1% | 5/sq mi | 2,109 sq mi | Two Harbors |
| Lake of the Woods County | 3,778 | $65,778 | 5.7% | 3/sq mi | 1,298 sq mi | Baudette |
| Le Sueur County | 29,255 | $78,885 | 4.2% | 65/sq mi | 449 sq mi | Le Center |
| Lincoln County | 5,521 | $65,021 | 4.2% | 10/sq mi | 537 sq mi | Ivanhoe |
| Lyon County | 25,427 | $69,161 | 3.7% | 36/sq mi | 714 sq mi | Marshall |
| Mahnomen County | 5,280 | $54,177 | 5.6% | 9/sq mi | 558 sq mi | Mahnomen |
| Marshall County | 8,810 | $69,843 | 5.0% | 5/sq mi | 1,775 sq mi | Warren |
| Martin County | 19,657 | $59,843 | 3.7% | 28/sq mi | 712 sq mi | Fairmont |
| McLeod County | 36,785 | $75,691 | 3.7% | 75/sq mi | 492 sq mi | Glencoe |
| Meeker County | 23,490 | $75,351 | 3.8% | 39/sq mi | 608 sq mi | Litchfield |
| Mille Lacs County | 27,427 | $70,512 | 4.8% | 48/sq mi | 572 sq mi | Milaca |
| Morrison County | 34,250 | $68,639 | 4.4% | 30/sq mi | 1,125 sq mi | Little Falls |
| Mower County | 40,058 | $66,578 | 3.7% | 56/sq mi | 711 sq mi | Austin |
| Murray County | 8,049 | $74,801 | 3.7% | 11/sq mi | 705 sq mi | Slayton |
| Nicollet County | 34,242 | $74,482 | 3.4% | 76/sq mi | 448 sq mi | St. Peter |
| Nobles County | 21,727 | $63,576 | 3.4% | 30/sq mi | 715 sq mi | Worthington |
| Norman County | 6,329 | $62,716 | 3.7% | 7/sq mi | 873 sq mi | Ada |
| Olmsted County | 164,784 | $89,431 | 3.4% | 252/sq mi | 654 sq mi | Rochester |
| Otter Tail County | 60,626 | $69,107 | 4.0% | 31/sq mi | 1,972 sq mi | Fergus Falls |
| Pennington County | 13,714 | $73,104 | 4.6% | 22/sq mi | 617 sq mi | Thief River Falls |
| Pine County | 30,197 | $69,619 | 5.7% | 21/sq mi | 1,411 sq mi | Pine City |
| Pipestone County | 9,245 | $69,117 | 3.3% | 20/sq mi | 465 sq mi | Pipestone |
| Polk County | 30,412 | $68,136 | 3.8% | 15/sq mi | 1,971 sq mi | Crookston |
| Pope County | 11,400 | $64,480 | 3.8% | 17/sq mi | 675 sq mi | Glenwood |
| Ramsey County | 536,075 | $77,764 | 4.2% | 3,521/sq mi | 152 sq mi | St. Paul |
| Red Lake County | 3,911 | $70,019 | 5.0% | 9/sq mi | 432 sq mi | Red Lake Falls |
| Redwood County | 15,288 | $71,012 | 3.8% | 17/sq mi | 879 sq mi | Redwood Falls |
| Renville County | 14,348 | $70,098 | 5.2% | 15/sq mi | 983 sq mi | Olivia |
| Rice County | 67,948 | $81,824 | 3.9% | 137/sq mi | 496 sq mi | Faribault |
| Rock County | 9,551 | $71,923 | 3.2% | 20/sq mi | 482 sq mi | Luverne |
| Roseau County | 15,252 | $74,057 | 3.6% | 9/sq mi | 1,672 sq mi | Roseau |
| Scott County | 155,814 | $111,370 | 3.6% | 438/sq mi | 356 sq mi | Shakopee |
| Sherburne County | 102,206 | $101,487 | 3.9% | 236/sq mi | 433 sq mi | Elk River |
| Sibley County | 15,084 | $76,019 | 4.5% | 26/sq mi | 589 sq mi | Gaylord |
| St. Louis County | 200,514 | $67,311 | 4.7% | 32/sq mi | 6,248 sq mi | Duluth |
| Stearns County | 160,977 | $75,116 | 4.0% | 120/sq mi | 1,343 sq mi | St. Cloud |
| Steele County | 37,421 | $78,500 | 4.4% | 87/sq mi | 430 sq mi | Owatonna |
| Stevens County | 9,728 | $74,512 | 3.3% | 17/sq mi | 564 sq mi | Morris |
| Swift County | 9,719 | $69,245 | 7.2% | 13/sq mi | 742 sq mi | Benson |
| Todd County | 25,667 | $60,951 | 4.6% | 27/sq mi | 945 sq mi | Long Prairie |
| Traverse County | 3,136 | $67,634 | 2.9% | 5/sq mi | 574 sq mi | Wheaton |
| Wabasha County | 21,683 | $81,349 | 3.6% | 41/sq mi | 523 sq mi | Wabasha |
| Wadena County | 14,241 | $55,449 | 4.9% | 27/sq mi | 536 sq mi | Wadena |
| Waseca County | 18,981 | $70,833 | 4.4% | 45/sq mi | 423 sq mi | Waseca |
| Washington County | 278,936 | $111,118 | 3.9% | 725/sq mi | 385 sq mi | Stillwater |
| Watonwan County | 11,077 | $64,868 | 3.9% | 25/sq mi | 435 sq mi | St. James |
| Wilkin County | 6,306 | $75,073 | 3.7% | 8/sq mi | 751 sq mi | Breckenridge |
| Winona County | 49,721 | $71,907 | 3.8% | 79/sq mi | 626 sq mi | Winona |
| Wright County | 151,150 | $104,303 | 3.8% | 229/sq mi | 661 sq mi | Buffalo |
| Yellow Medicine County | 9,467 | $69,009 | 3.8% | 12/sq mi | 759 sq mi | Granite Falls |
All 87 counties, sortable by any column — click a heading. A suppressed estimate (coefficient of variation ≥ 0.30) shows a marker, never a guess. County seats are from Wikidata (CC0), each validated to a Census place inside its county; a county with no validated seat is left blank. See the methodology.
Download & print this Minnesota map
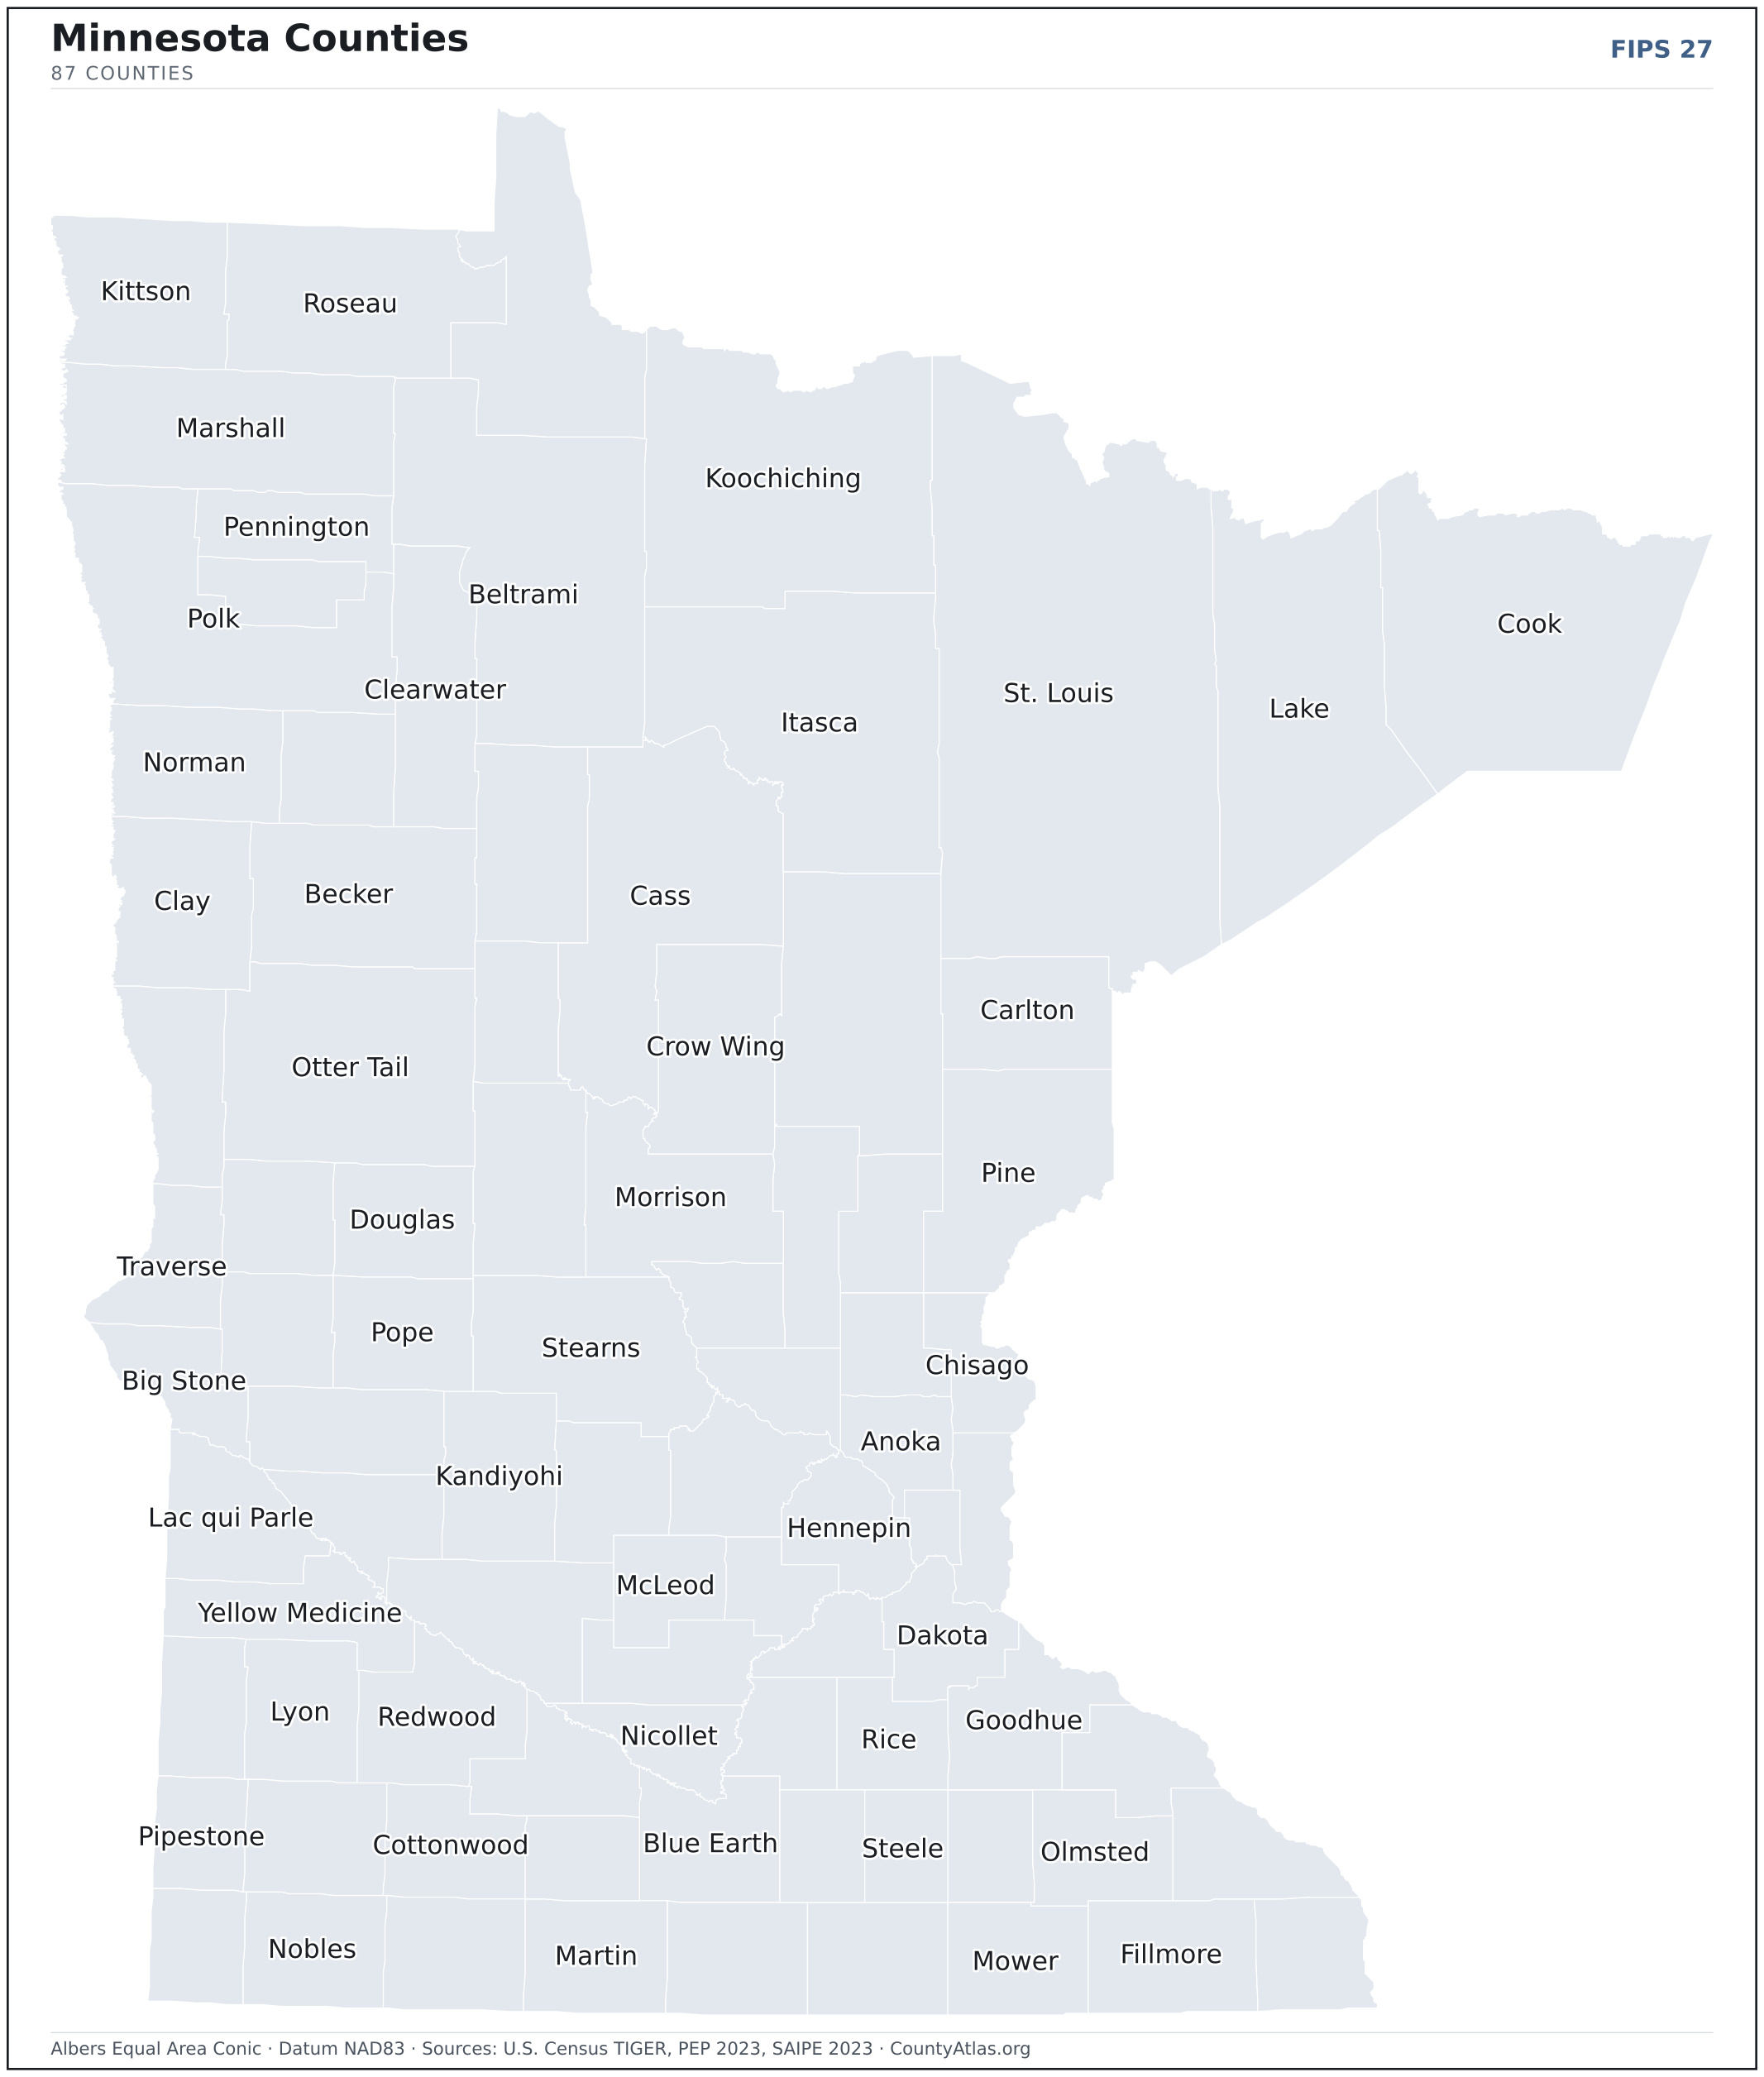
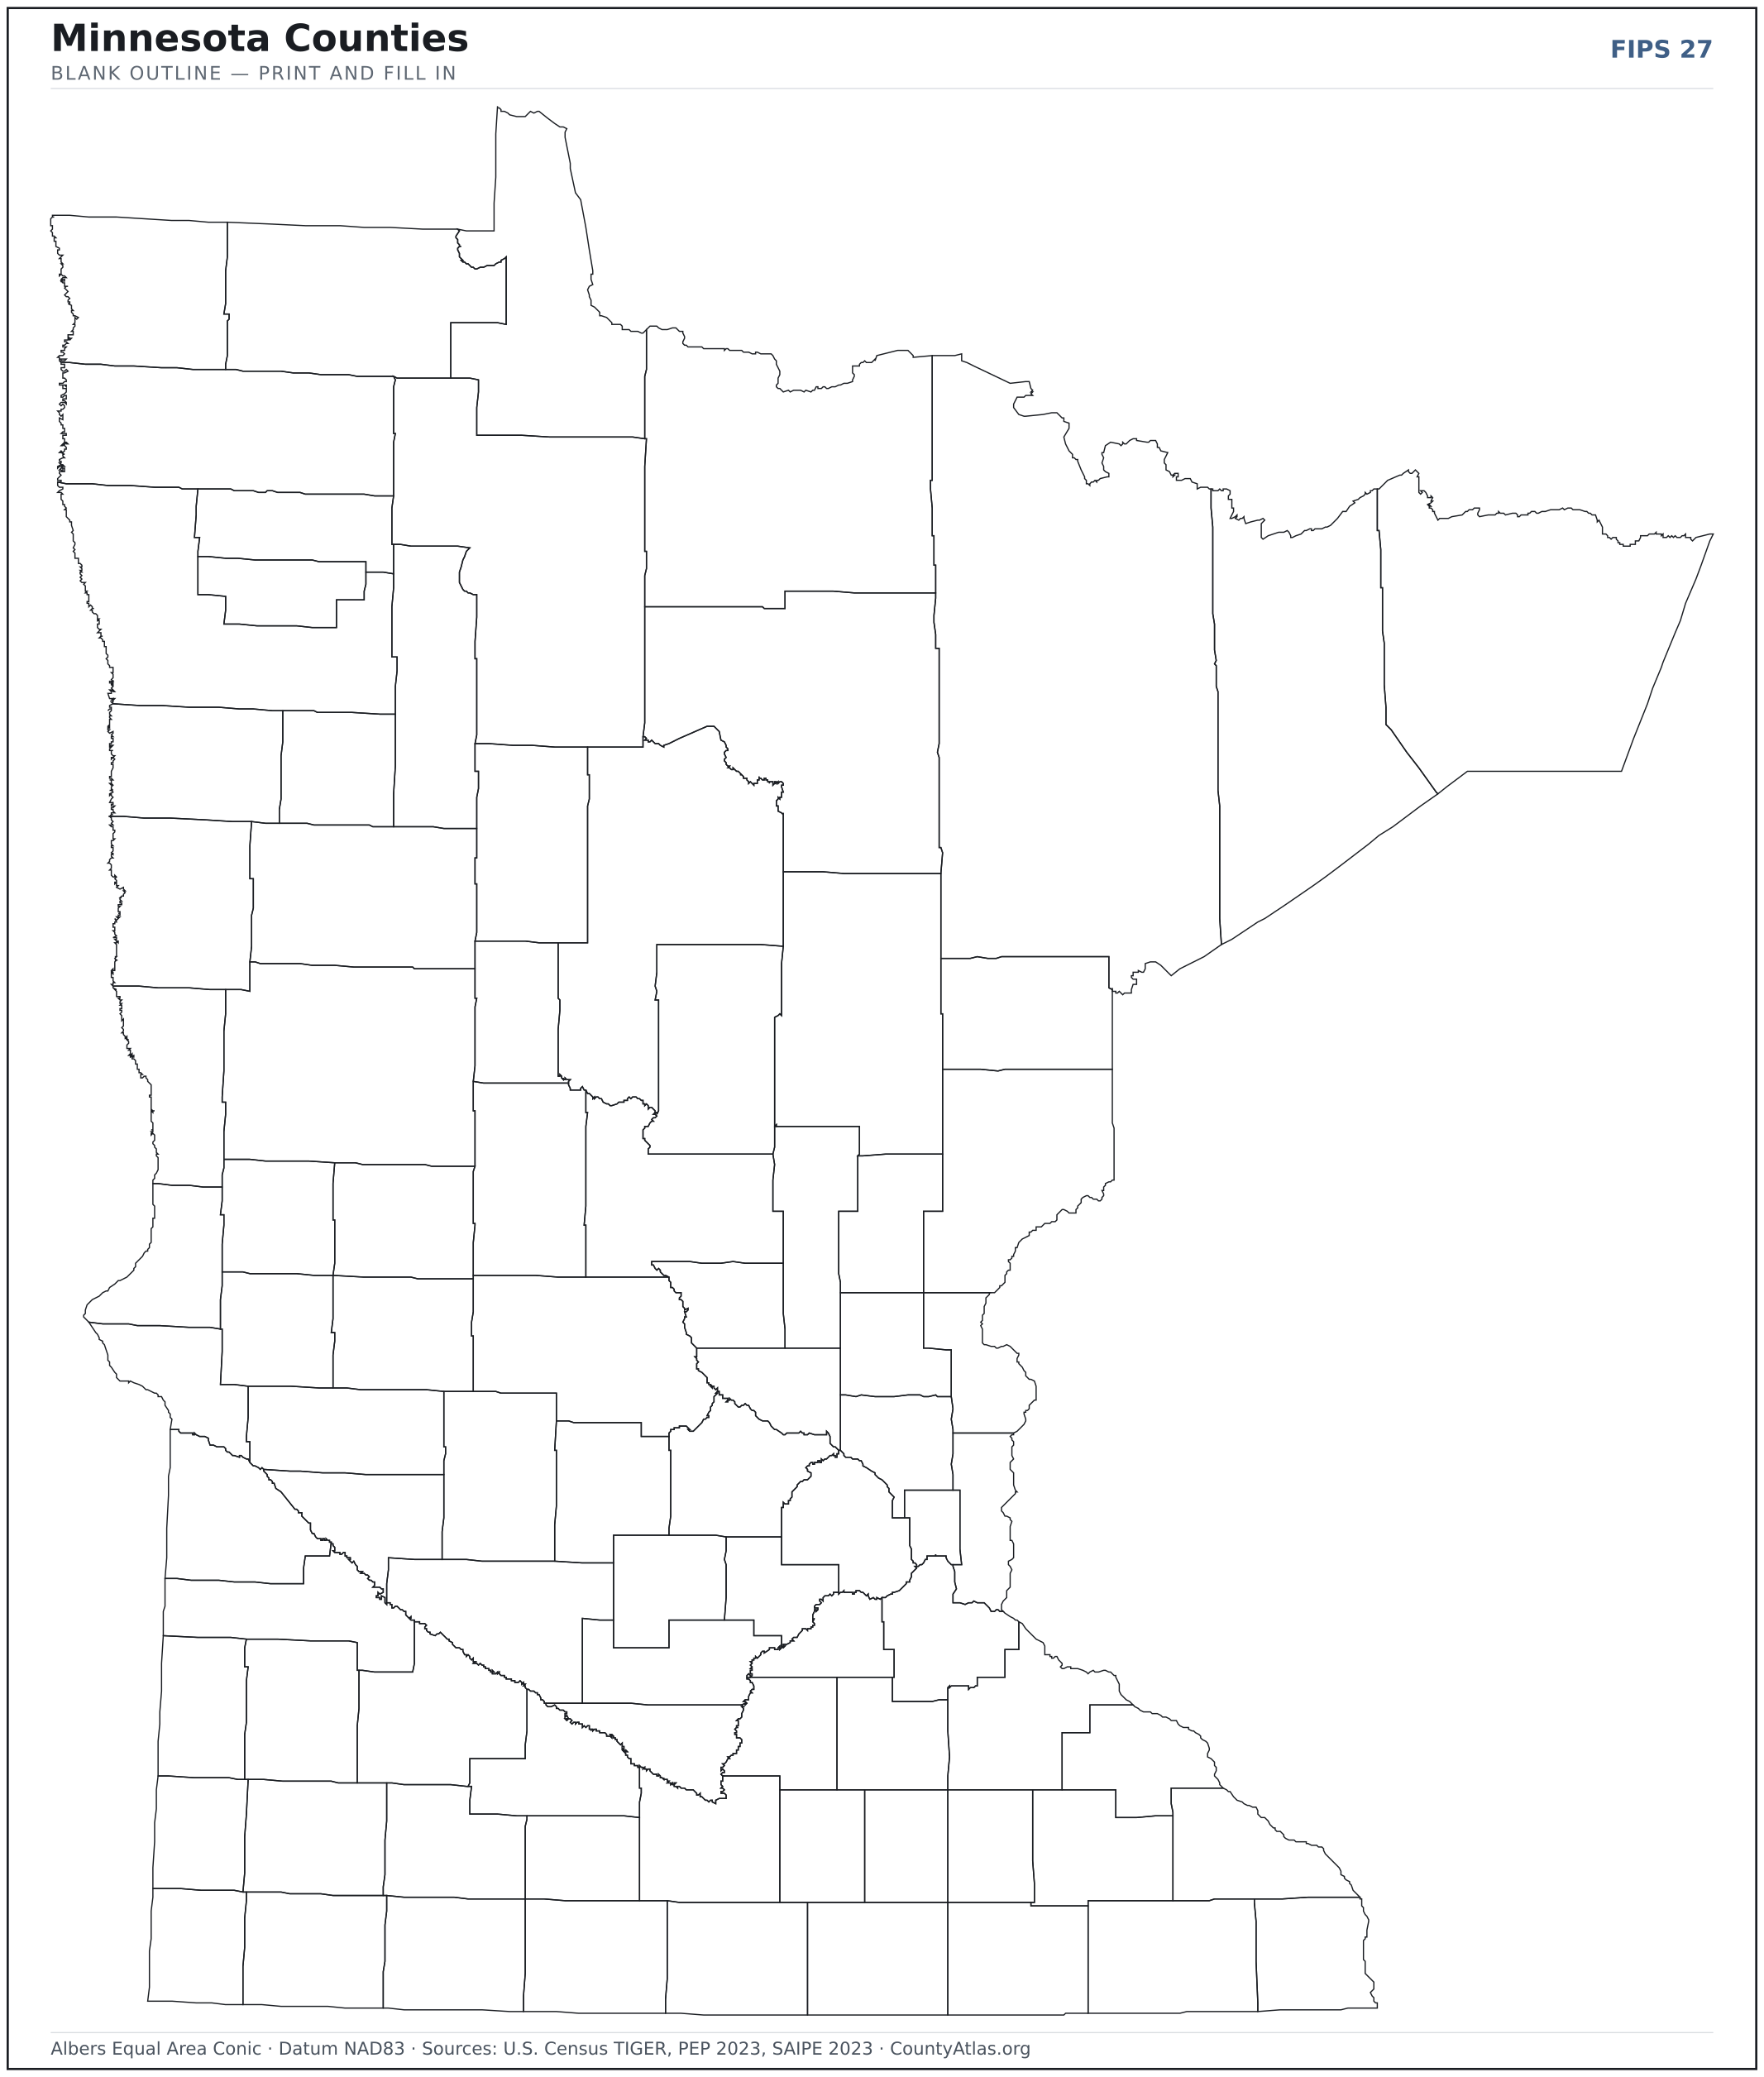
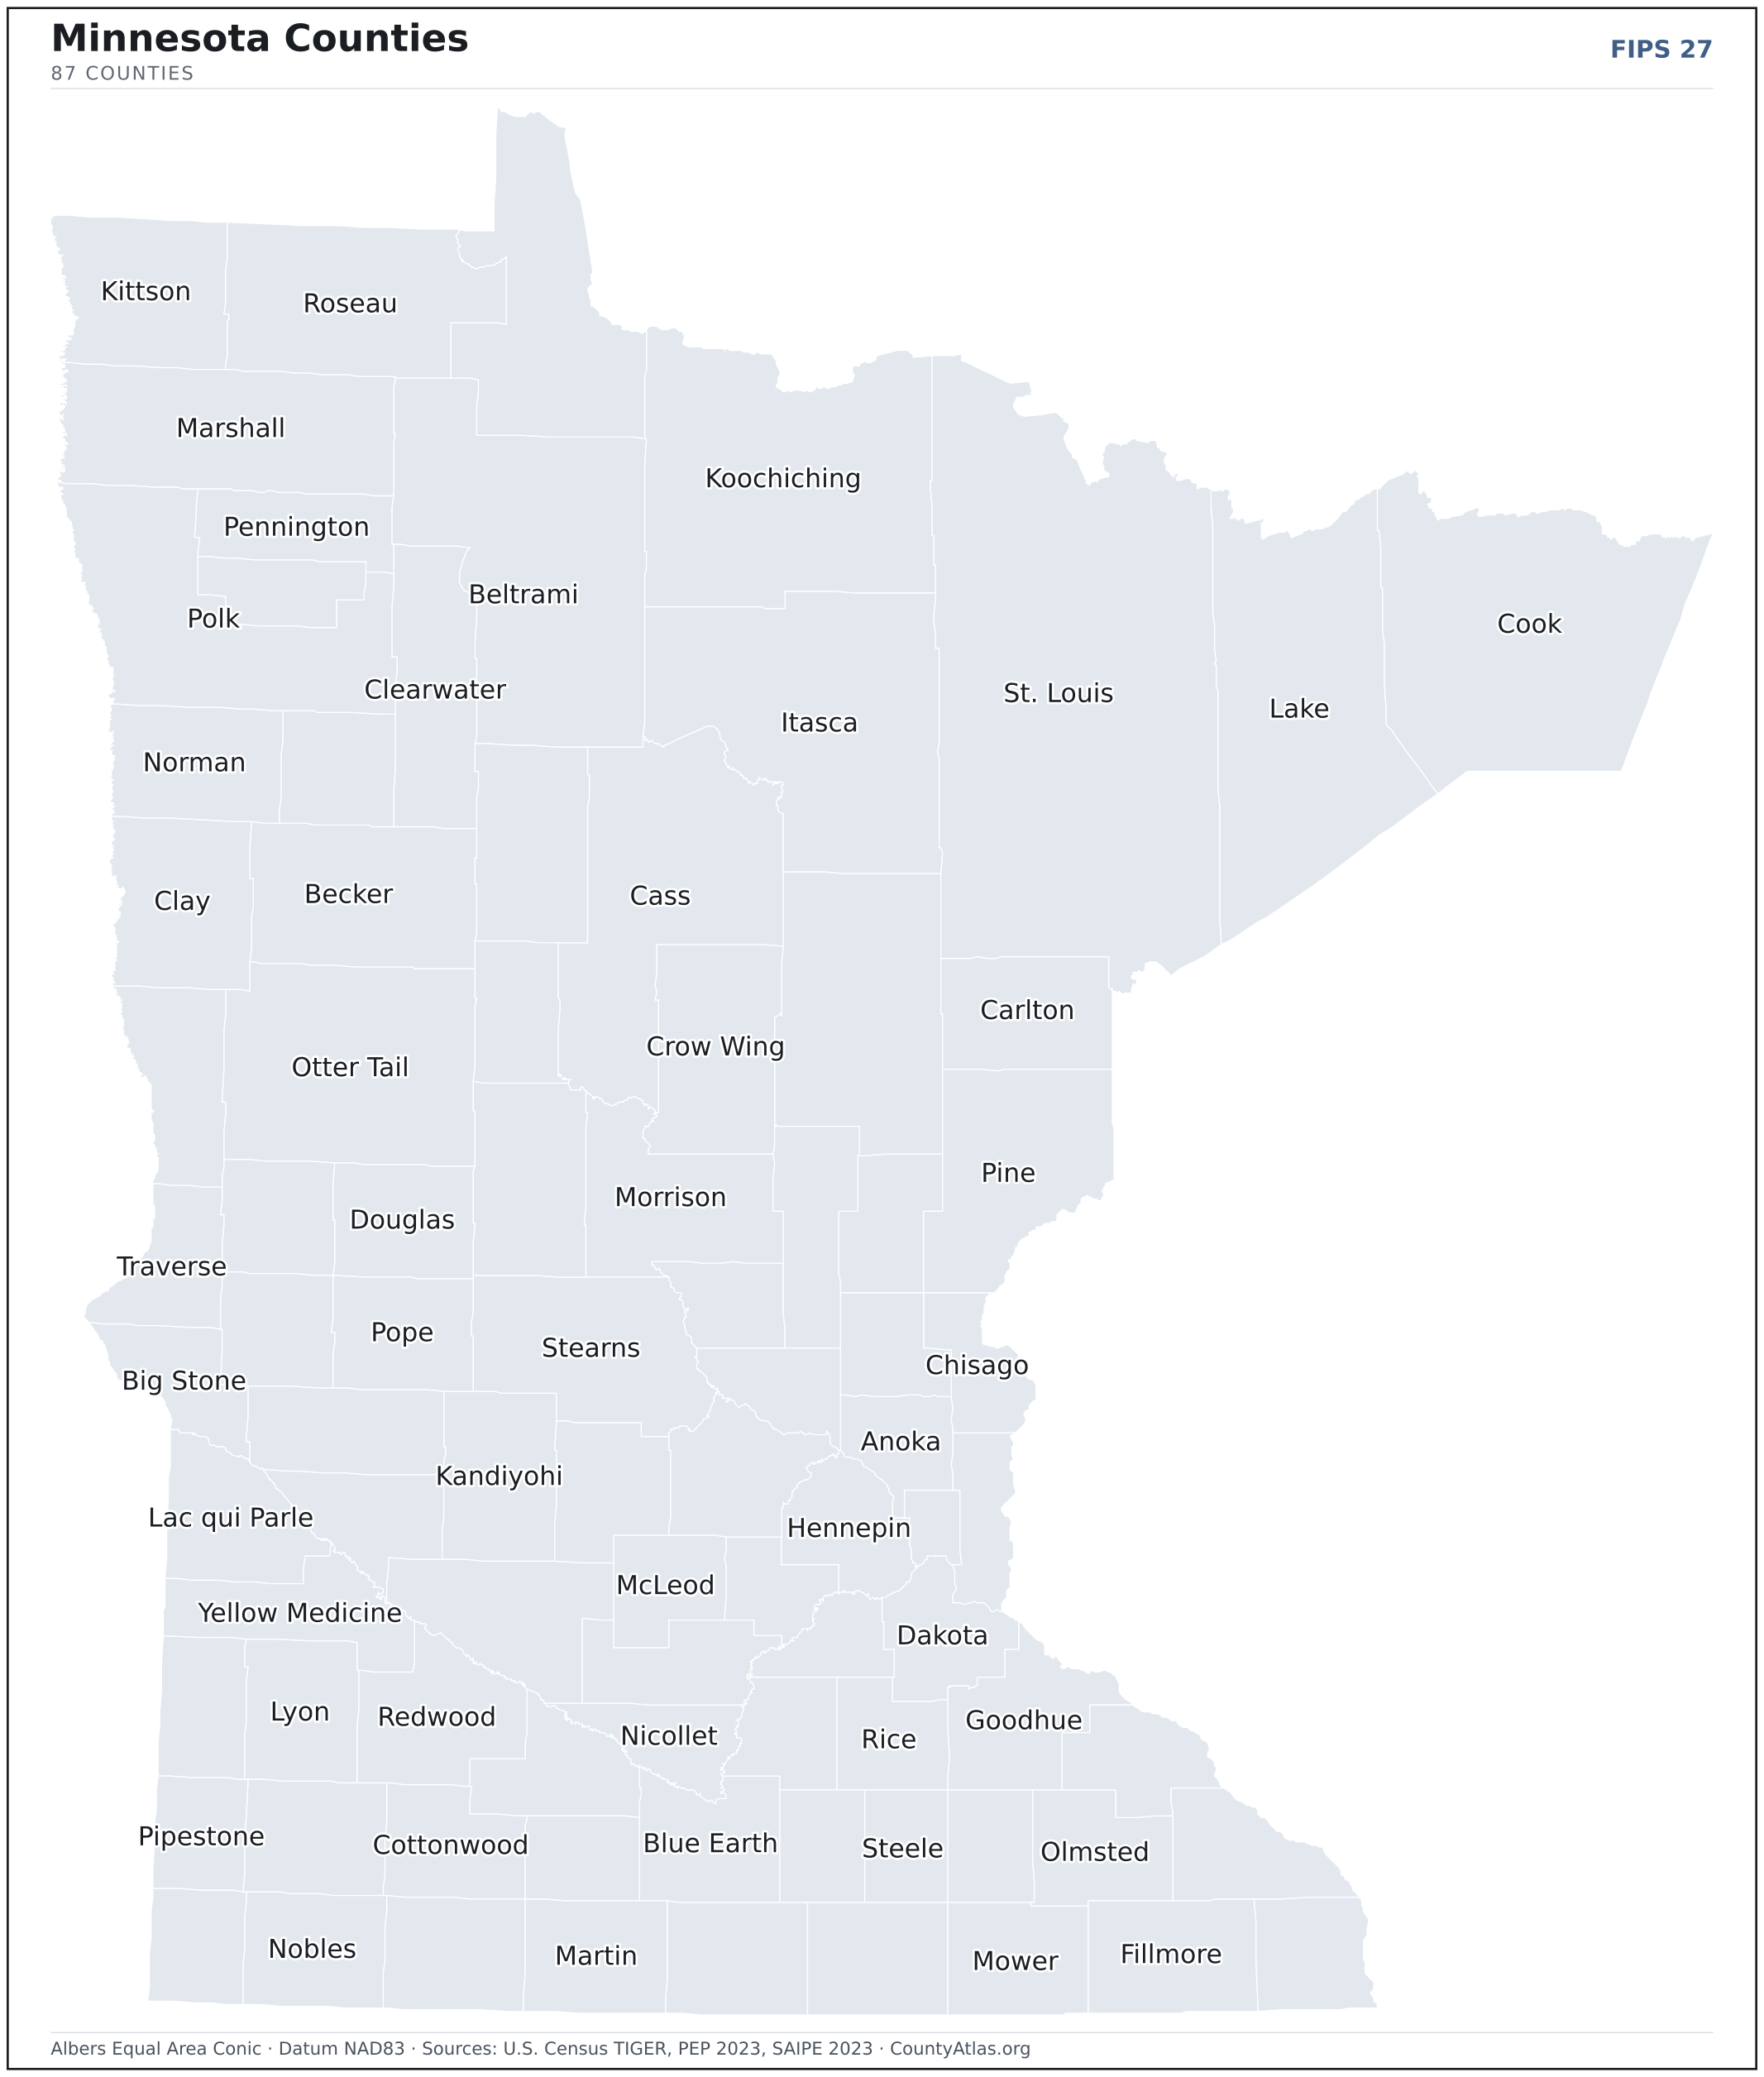
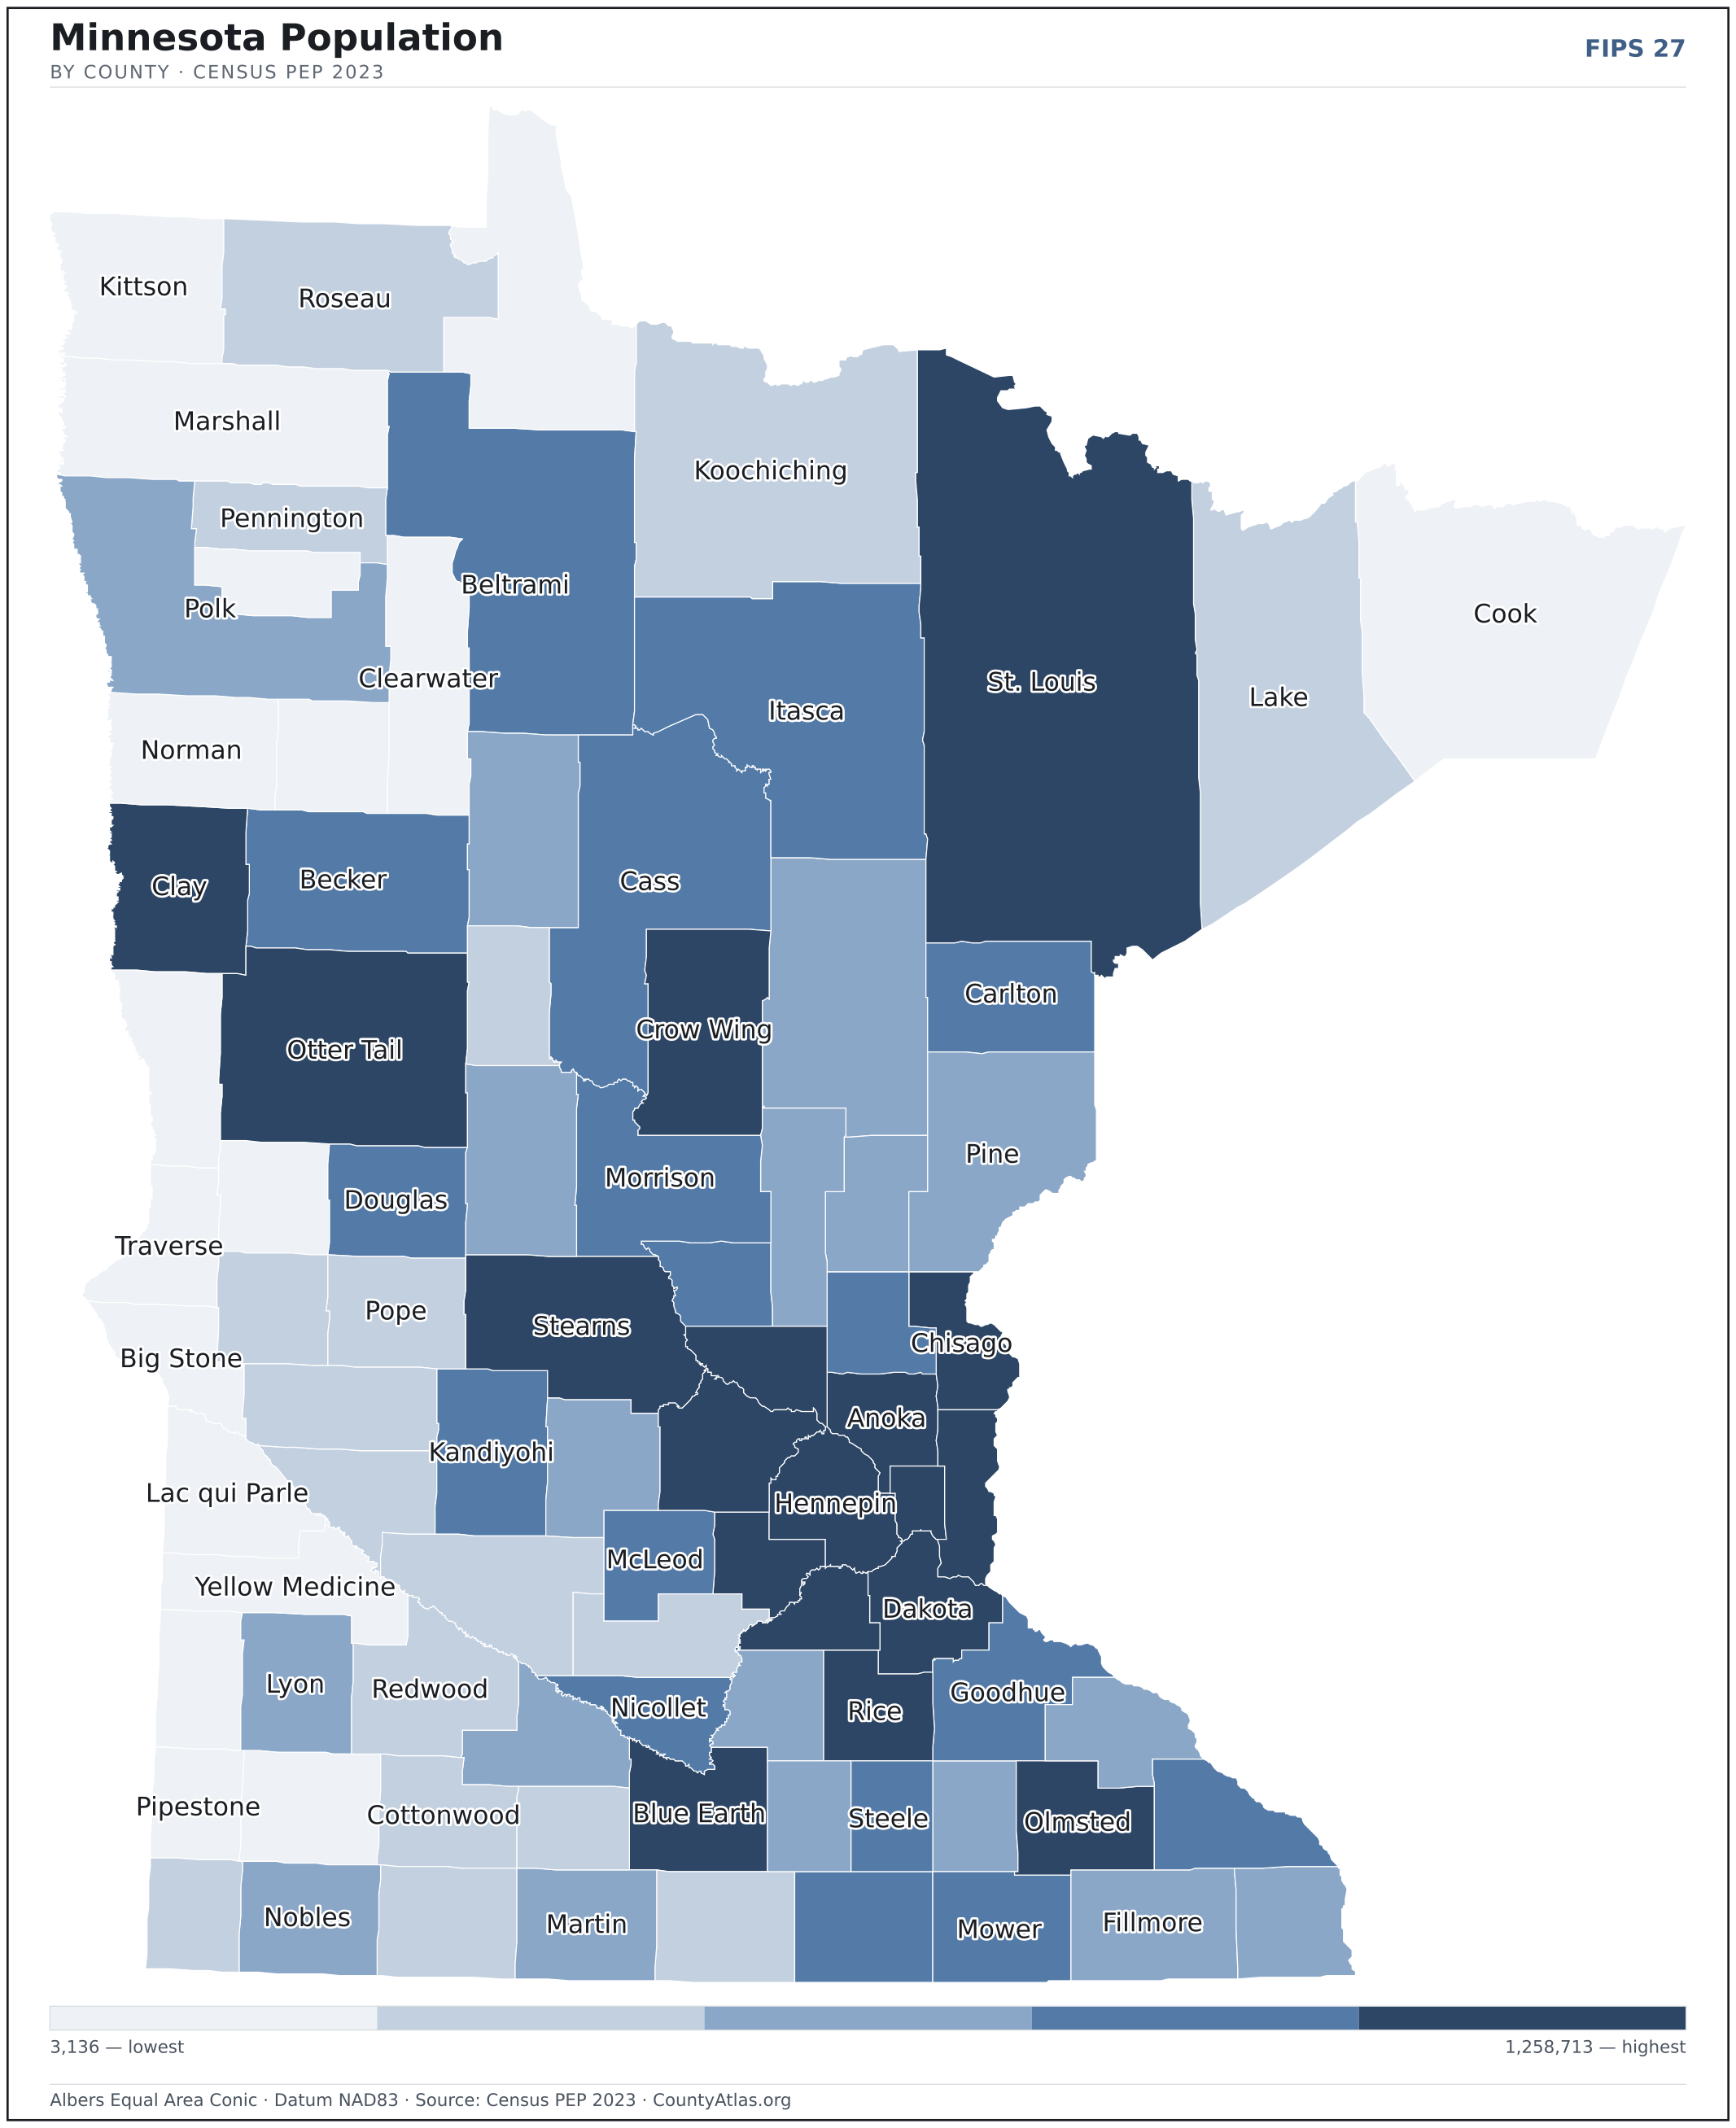
Minnesota maps, coloured by the data
Cities in Minnesota
Minnesota has 856 incorporated cities. The largest is Minneapolis in Hennepin County with 426,845 residents. Use the search on the map above to find any city and highlight the county it sits in.
| Minneapolis | Hennepin County | 426,845 |
| St. Paul | Ramsey County | 307,762 |
| Rochester | Olmsted County | 121,638 |
| Bloomington | Hennepin County | 88,838 |
| Duluth | St. Louis County | 86,863 |
| Brooklyn Park | Hennepin County | 84,349 |
| Plymouth | Hennepin County | 79,526 |
| Woodbury | Washington County | 76,945 |
| Lakeville | Dakota County | 72,480 |
| Blaine | Anoka County | 71,261 |
| Maple Grove | Hennepin County | 70,539 |
| St. Cloud | Stearns County | 69,926 |
| Eagan | Dakota County | 68,158 |
| Burnsville | Dakota County | 64,295 |
| Coon Rapids | Anoka County | 63,348 |
| Eden Prairie | Hennepin County | 63,249 |
| Apple Valley | Dakota County | 55,696 |
| Minnetonka | Hennepin County | 53,256 |
| Edina | Hennepin County | 53,125 |
| St. Louis Park | Hennepin County | 49,541 |
| Shakopee | Scott County | 45,002 |
| Mankato | Blue Earth County | 44,882 |
| Moorhead | Clay County | 44,706 |
| Maplewood | Ramsey County | 40,981 |
| Cottage Grove | Washington County | 40,124 |
| Richfield | Hennepin County | 36,725 |
| Roseville | Ramsey County | 35,905 |
| Inver Grove Heights | Dakota County | 35,772 |
| Andover | Anoka County | 32,825 |
| Brooklyn Center | Hennepin County | 32,811 |
| Savage | Scott County | 32,706 |
| Fridley | Anoka County | 29,944 |
| Chaska | Carver County | 28,146 |
| Oakdale | Washington County | 28,109 |
| Ramsey | Anoka County | 28,070 |
| Prior Lake | Scott County | 27,832 |
| Shoreview | Ramsey County | 26,724 |
| Rosemount | Dakota County | 26,509 |
| Owatonna | Steele County | 26,462 |
| Elk River | Sherburne County | 26,367 |
| Austin | Mower County | 26,167 |
| Chanhassen | Carver County | 26,001 |
| Winona | Winona County | 25,998 |
| Faribault | Rice County | 24,458 |
| White Bear Lake | Ramsey County | 24,026 |
| Farmington | Dakota County | 23,675 |
| Champlin | Hennepin County | 23,450 |
| New Brighton | Ramsey County | 22,900 |
| Crystal | Hennepin County | 22,685 |
| Hastings | Dakota County | 22,050 |
Showing the 50 most populous — and 806 more. Search the map above for any Minnesota city or village.
A city can span more than one county; each is listed in its primary county — the one its center falls in.
Which Minnesota county is the richest, largest, most crowded? The answers
- Minnesota’s highest median household income is in Carver County ($129,437); the lowest is in Mahnomen County ($54,177). Census SAIPE 2023
- Minnesota’s most populous county is Hennepin County (1,258,713); the least populous is Traverse County (3,136) — a 401× spread. Census PEP 2023
- Minnesota’s largest county by land area is St. Louis County (6,248 sq mi); the smallest is Ramsey County (152 sq mi). Census TIGER
- Minnesota’s highest population density is in Ramsey County (3,521/sq mi); the lowest is in Lake of the Woods County (3/sq mi). Census PEP 2023 · TIGER
- Minnesota’s highest poverty rate is in Mahnomen County (19.3%); the lowest is in Carver County (4.6%). Census SAIPE 2023
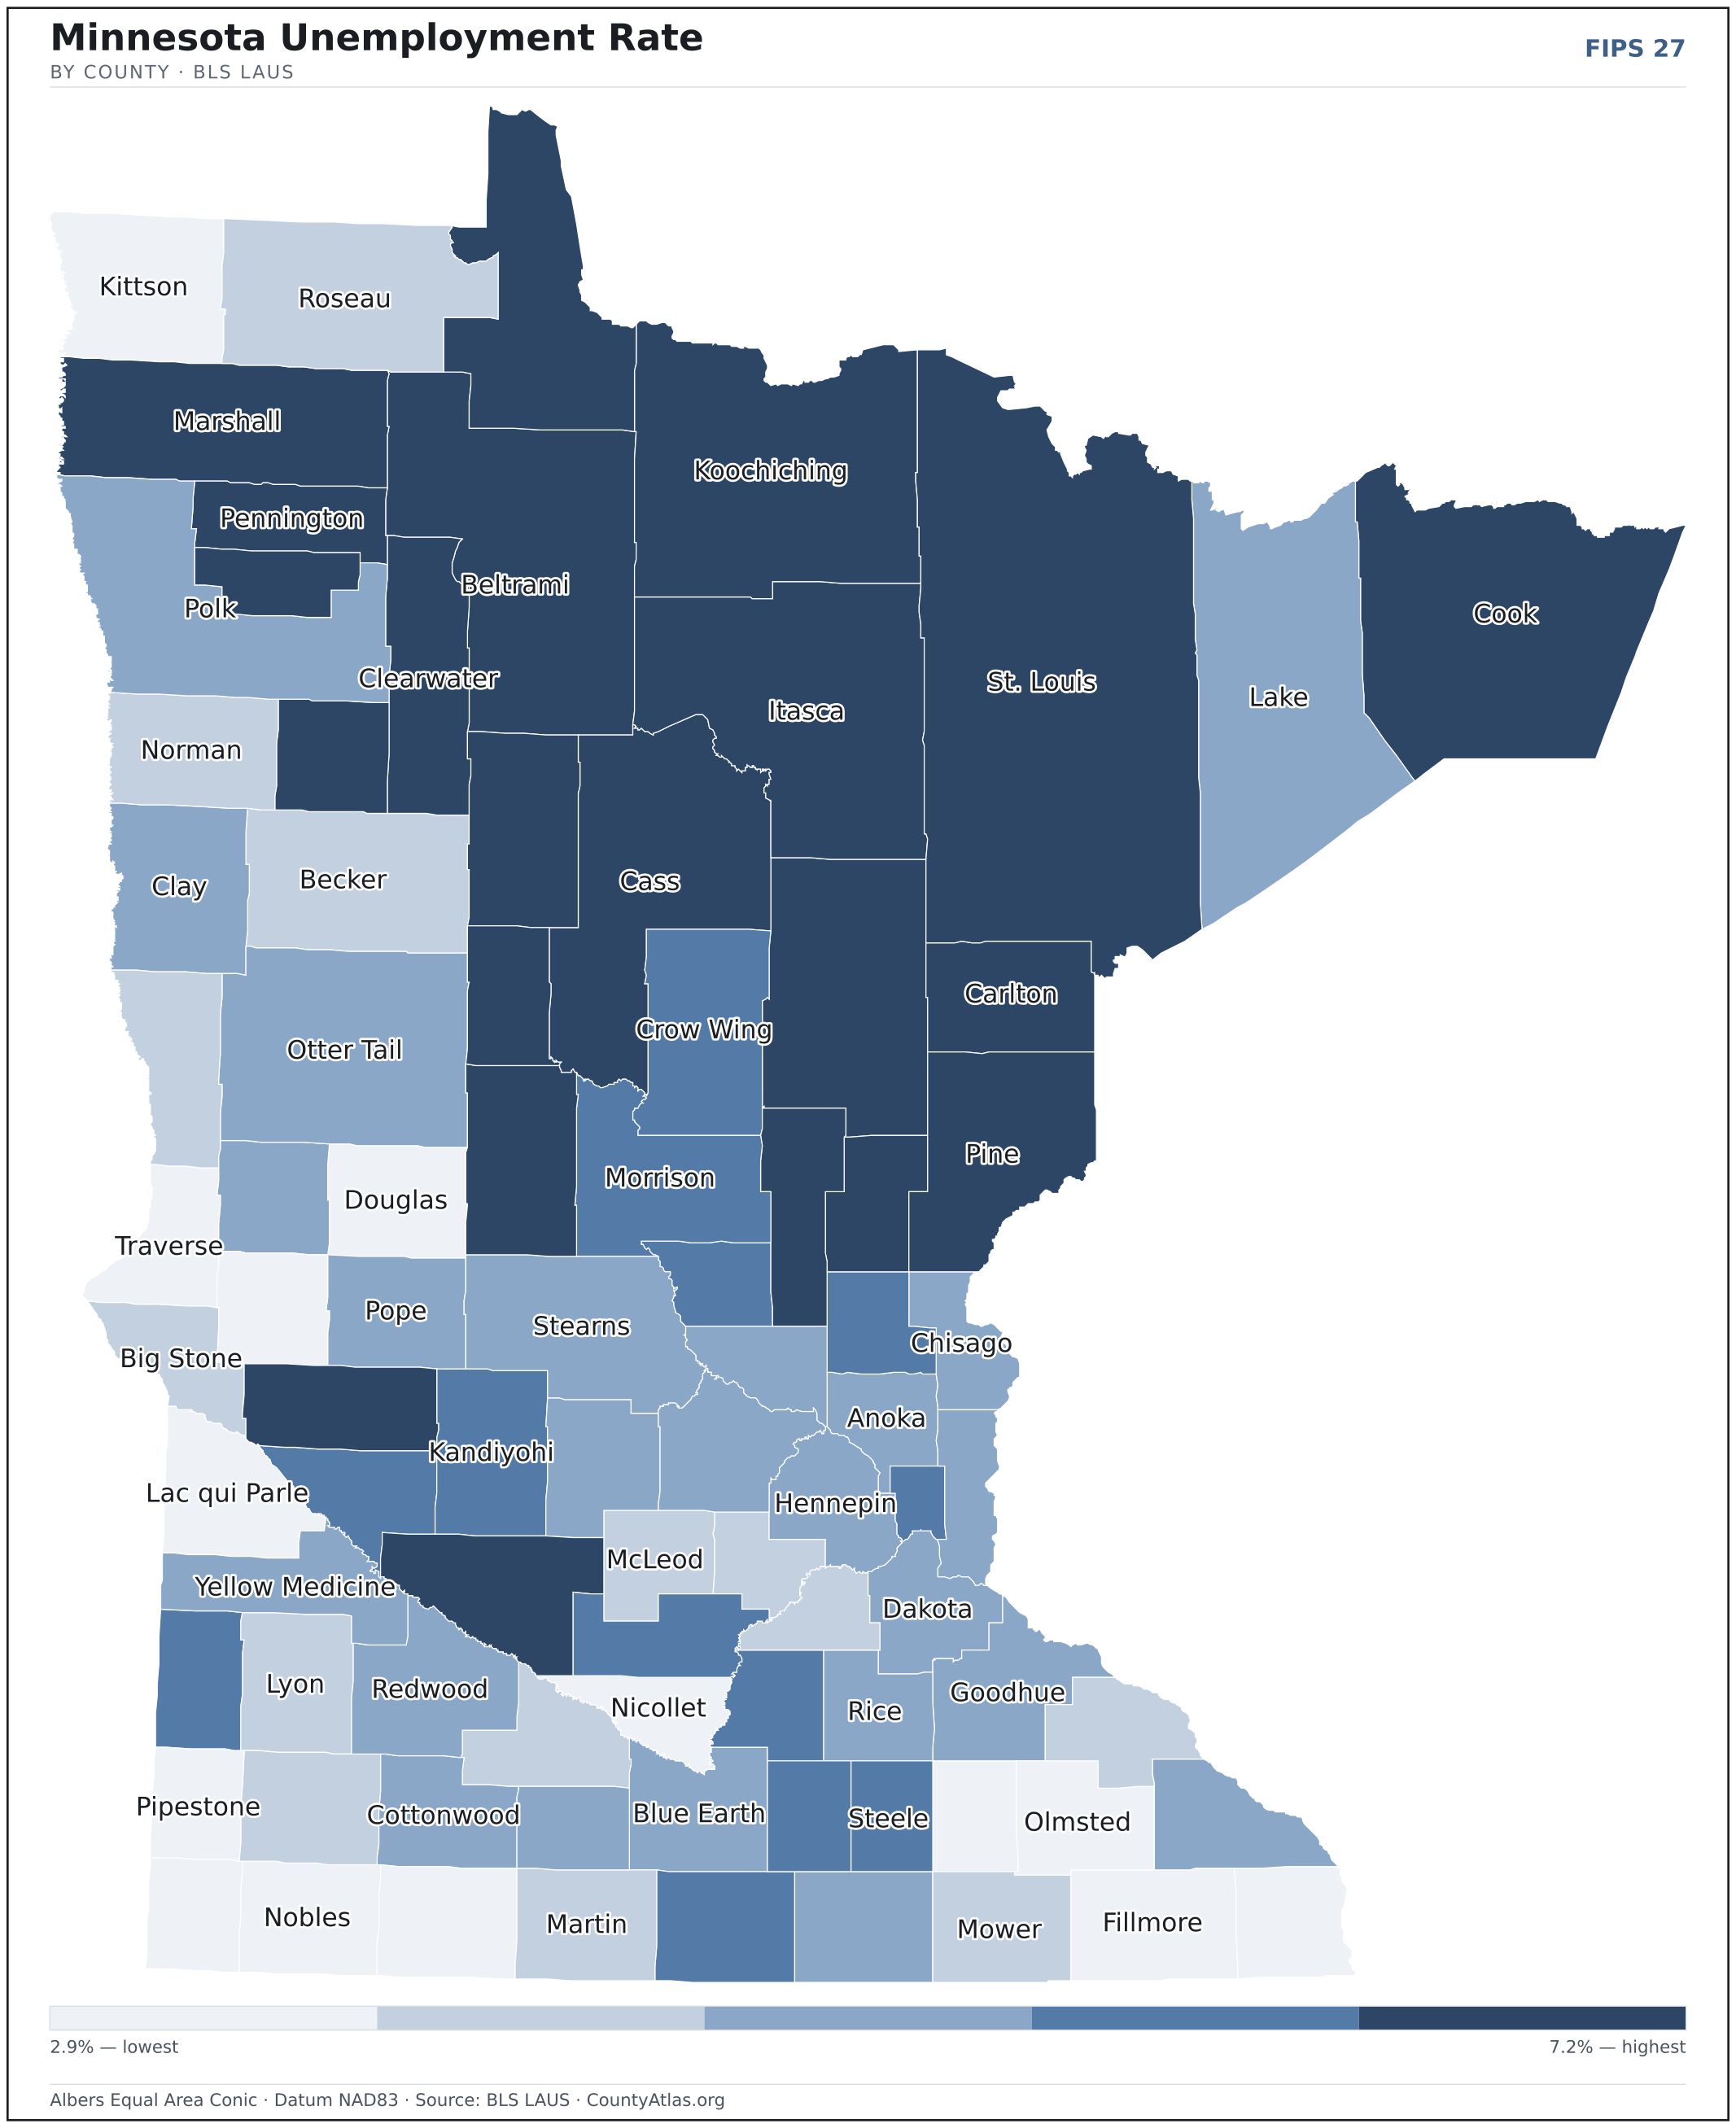
- In Minnesota, unemployment is highest in Swift County (7.2%) and lowest in Traverse County (2.9%), for May 2026. BLS LAUS
- Minnesota’s highest median age is in Aitkin County (56.5); the lowest is in Blue Earth County (31.5). Census ACS 2019–2023
- Minnesota’s highest share of bachelor’s degrees is in Hennepin County (53.3% of adults); the lowest is in Mahnomen County (14.3%). Census ACS 2019–2023
Every figure is a current official estimate from the source named — not a crowd-sourced or copied value. Suppressed estimates (coefficient of variation ≥ 0.30) are omitted, never guessed. See the full methodology.
Minnesota counties: common questions
How many counties are in Minnesota?
Minnesota has 87 counties covering 79,632 sq mi and about 5.7M residents. Every one is on the map above and in the table below.
What is the largest county in Minnesota?
It depends on the measure. By land area it’s St. Louis County (6,248 sq mi); by population it’s Hennepin County (1,258,713 residents).
What county is Minneapolis in?
Minneapolis (population 426,845) is in Hennepin County. Use the search on the map to find any Minnesota city’s county.
What is the richest county in Minnesota?
By median household income, Carver County is the richest at $129,437; the poorest is Mahnomen County at $54,177 (Census SAIPE 2023).
What is the most populous county in Minnesota?
Hennepin County, with 1,258,713 residents — about 21.9% of Minnesota’s people, and 401× the least populous, Traverse County (3,136).
Sources & vintages
- Population — PEP Vintage 2023 (July 1, 2023) — pep/charv
- Median household income & poverty — SAIPE 2023
- Unemployment — BLS LAUS May 2026 (preliminary)
- Geometry & boundaries — Census TIGERweb
- Cities & city population — Census TIGERweb Incorporated Places + ACS 5-year 2019–2023
Data current through .