CountyAtlas Montana
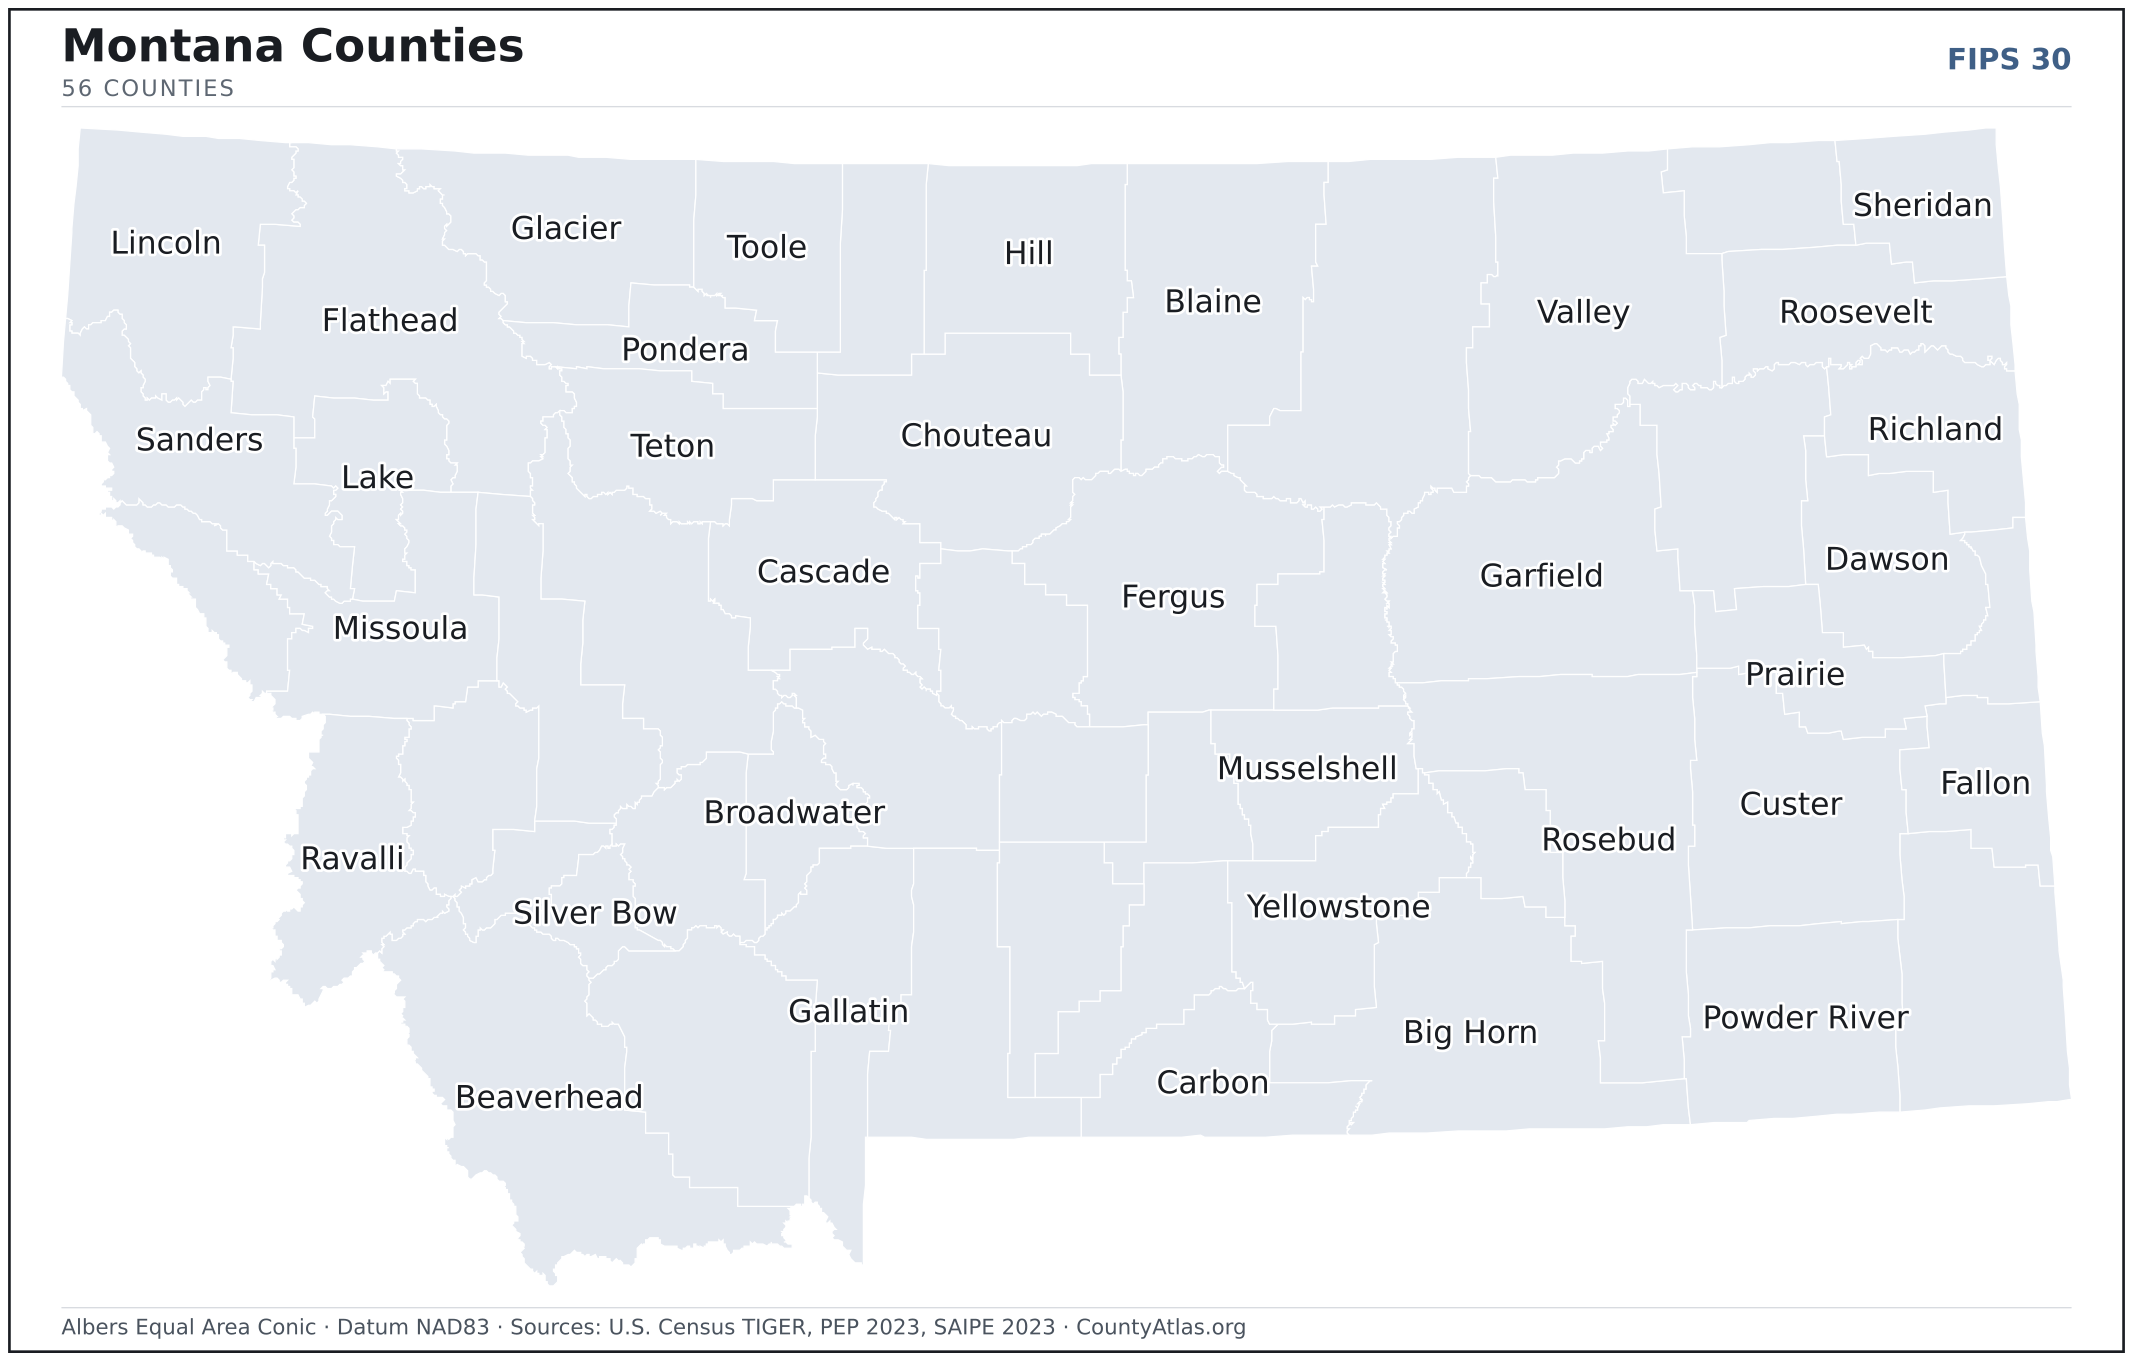
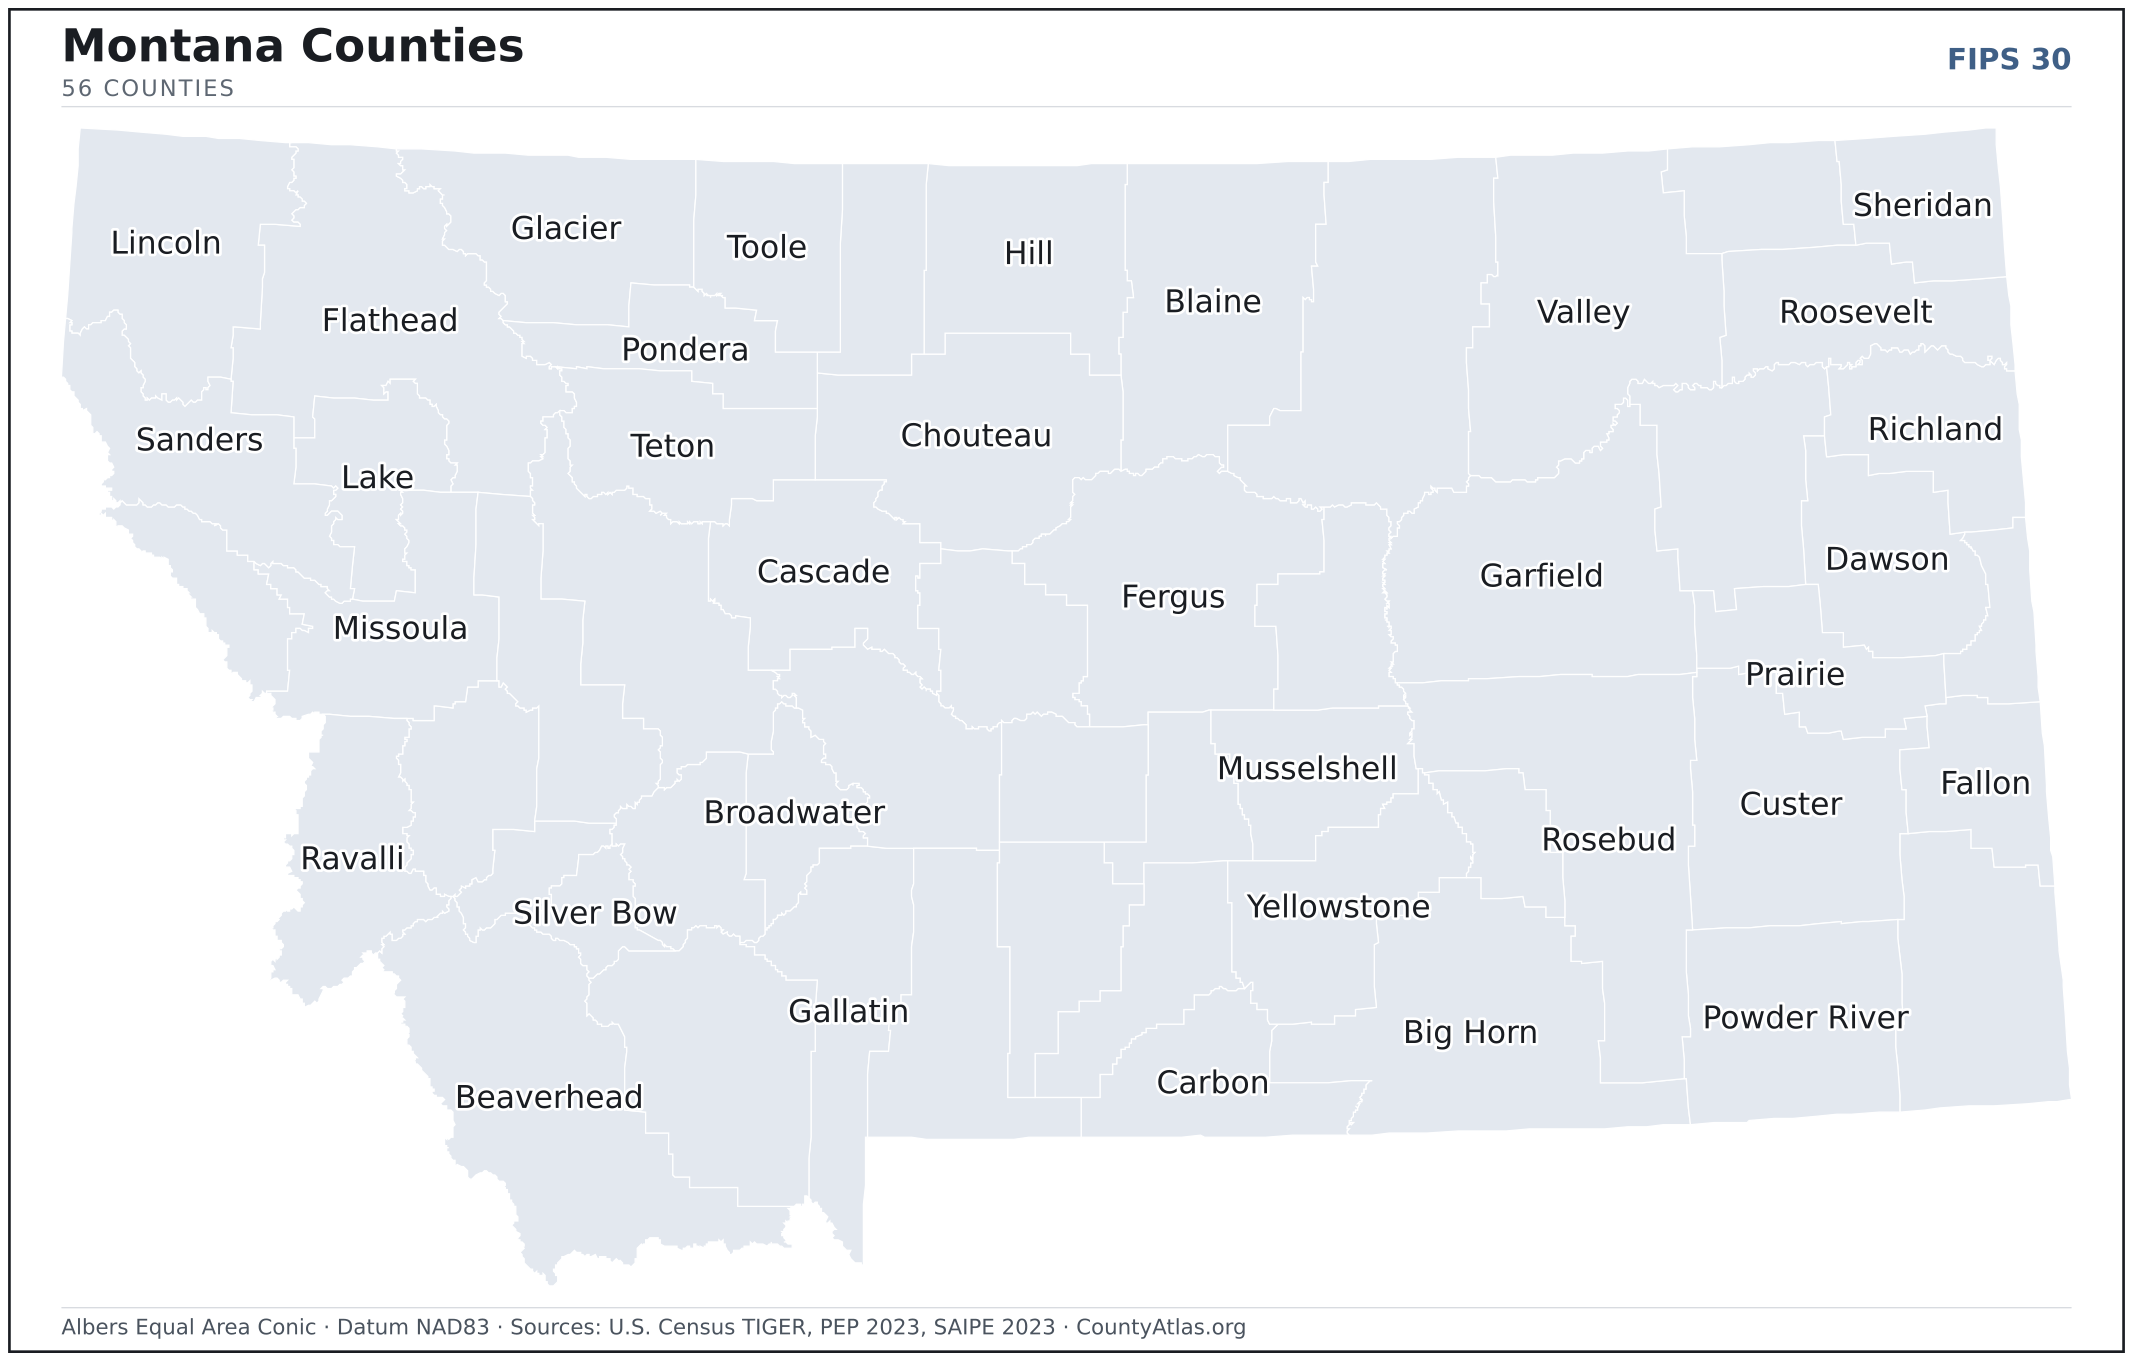
Montana County Map with Cities — All 56 Counties
All 56 of Montana's counties, mapped from official U.S. Census boundaries with population, income, and unemployment for every one. Colour the map by any measure, tap a county for its data, or download a print-ready copy.
Tap any county for its population, income, and more.
Montana at a glance
- Scale. Montana is divided into 56 counties across 145,550 sq mi of land — an average of 2,599 sq mi each. Census TIGER
- People. Its counties are home to 1,132,812 residents — an average of 20,229 each, or 8 per square mile statewide. Census PEP 2023
- Water. Another 1,493 sq mi is water — 1.0% of the state’s area, led by Garfield County. Census TIGER
Montana’s 56 counties, by the numbers
Every county’s population, median household income, unemployment, density, and land area — sortable by any column, so you can find yours or rank by what matters to you. A few patterns run through the data:
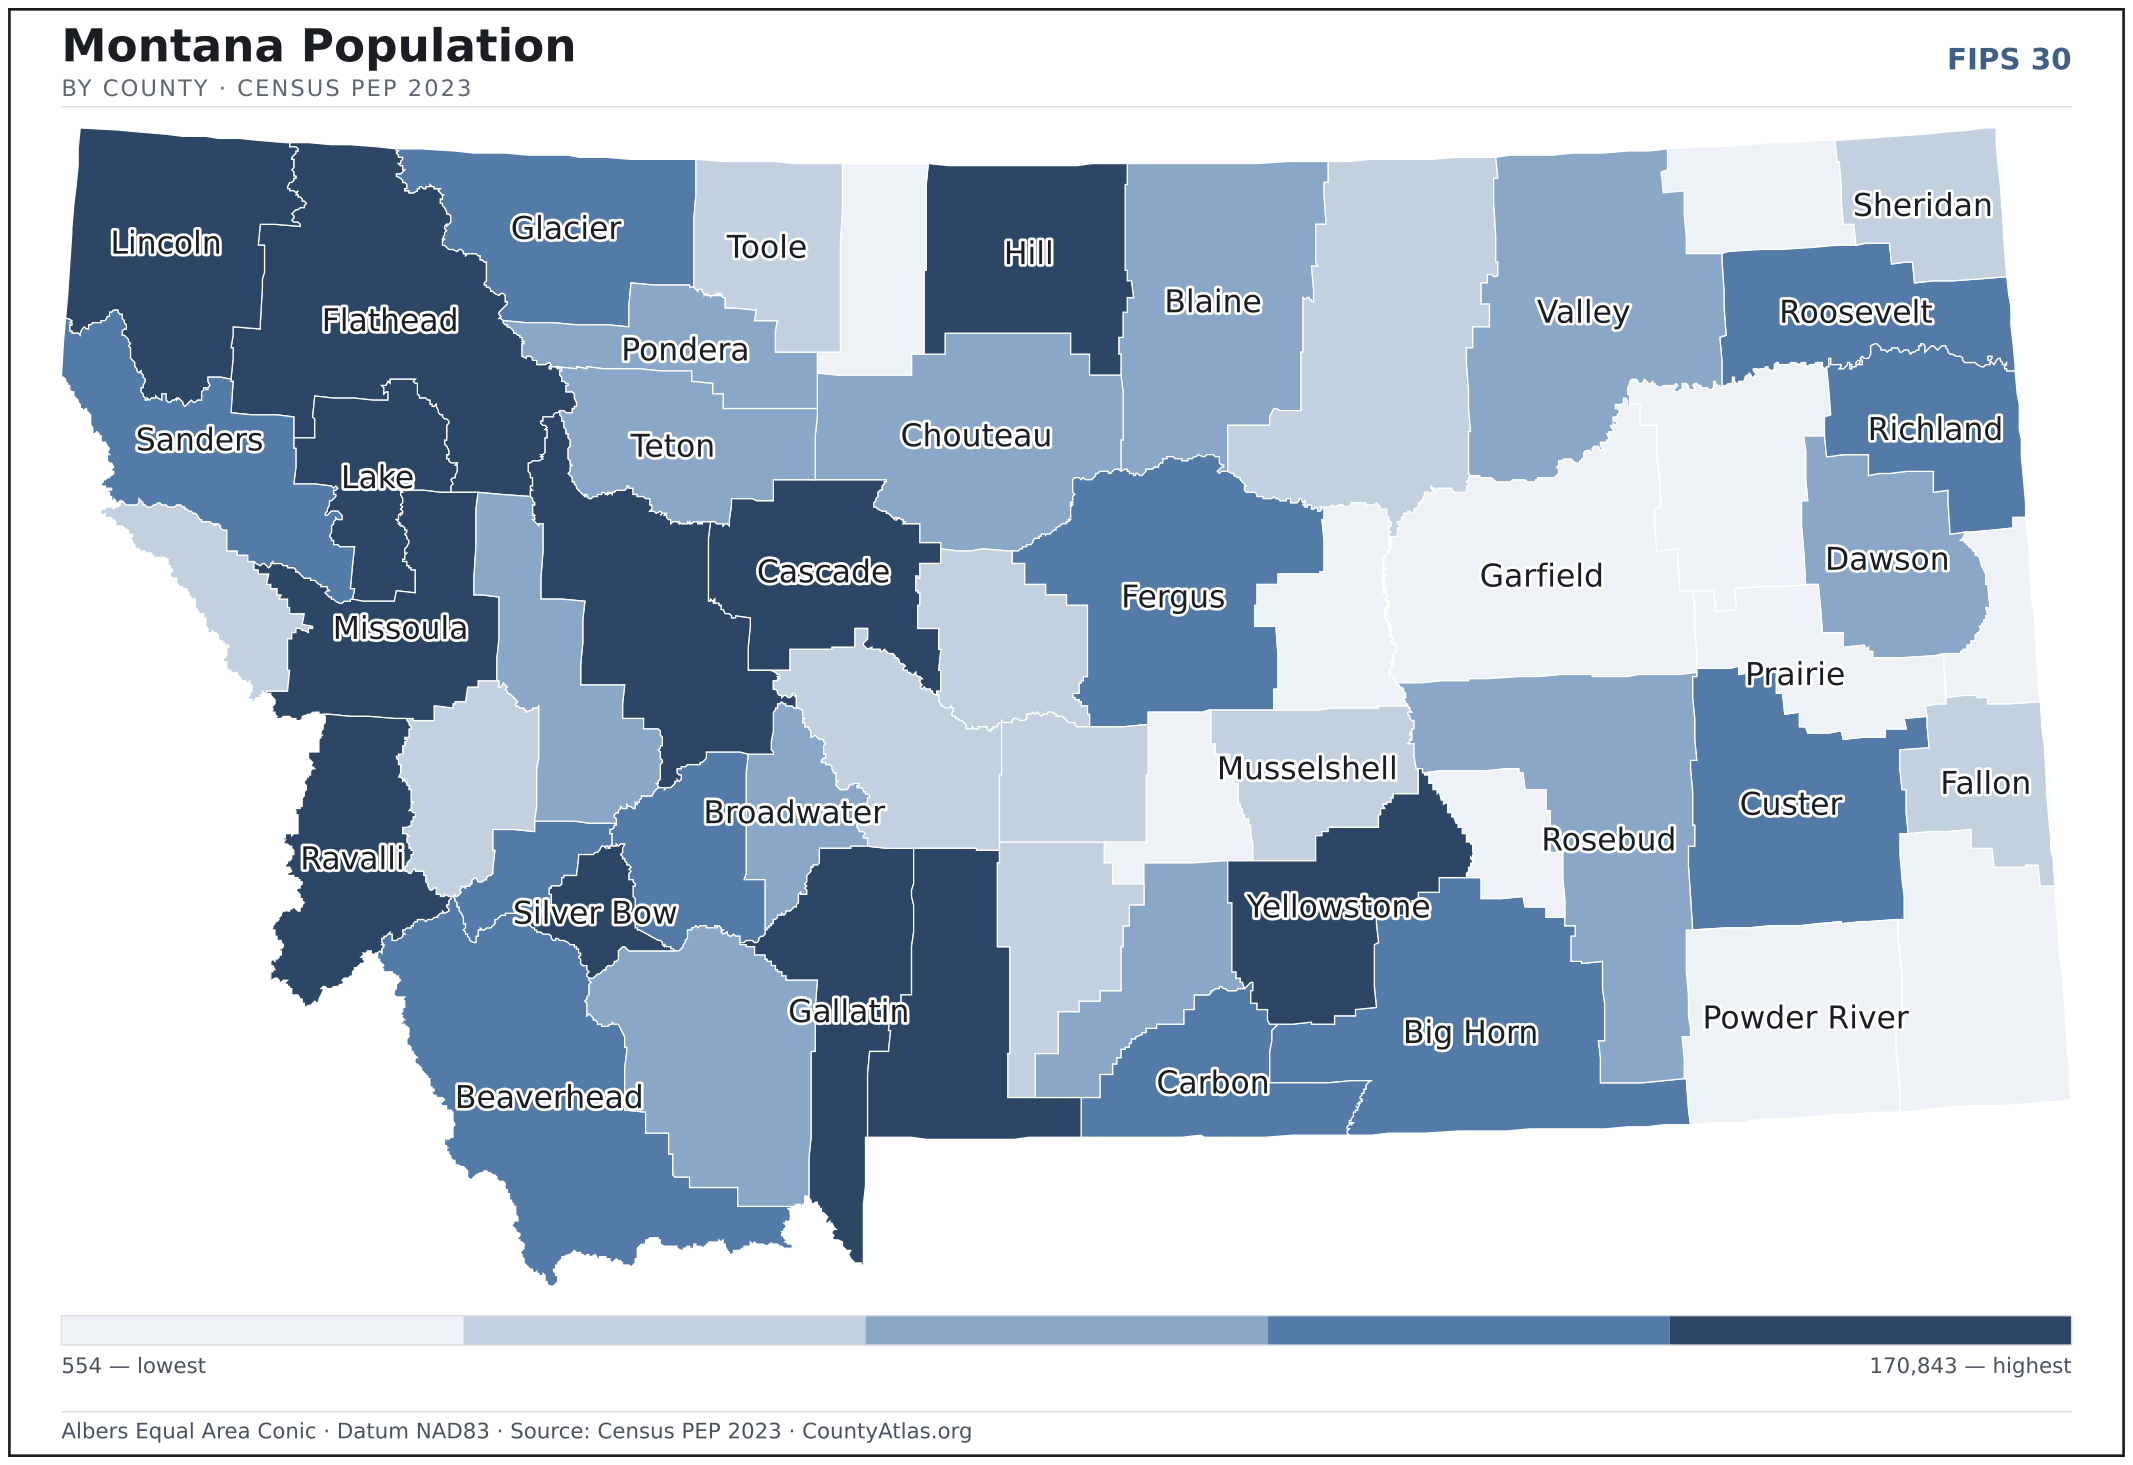
- Concentrated. Half of Montana’s 1,132,812 residents live in just 5 of 56 counties, and the five largest hold 54.5% of the total. Census PEP 2023
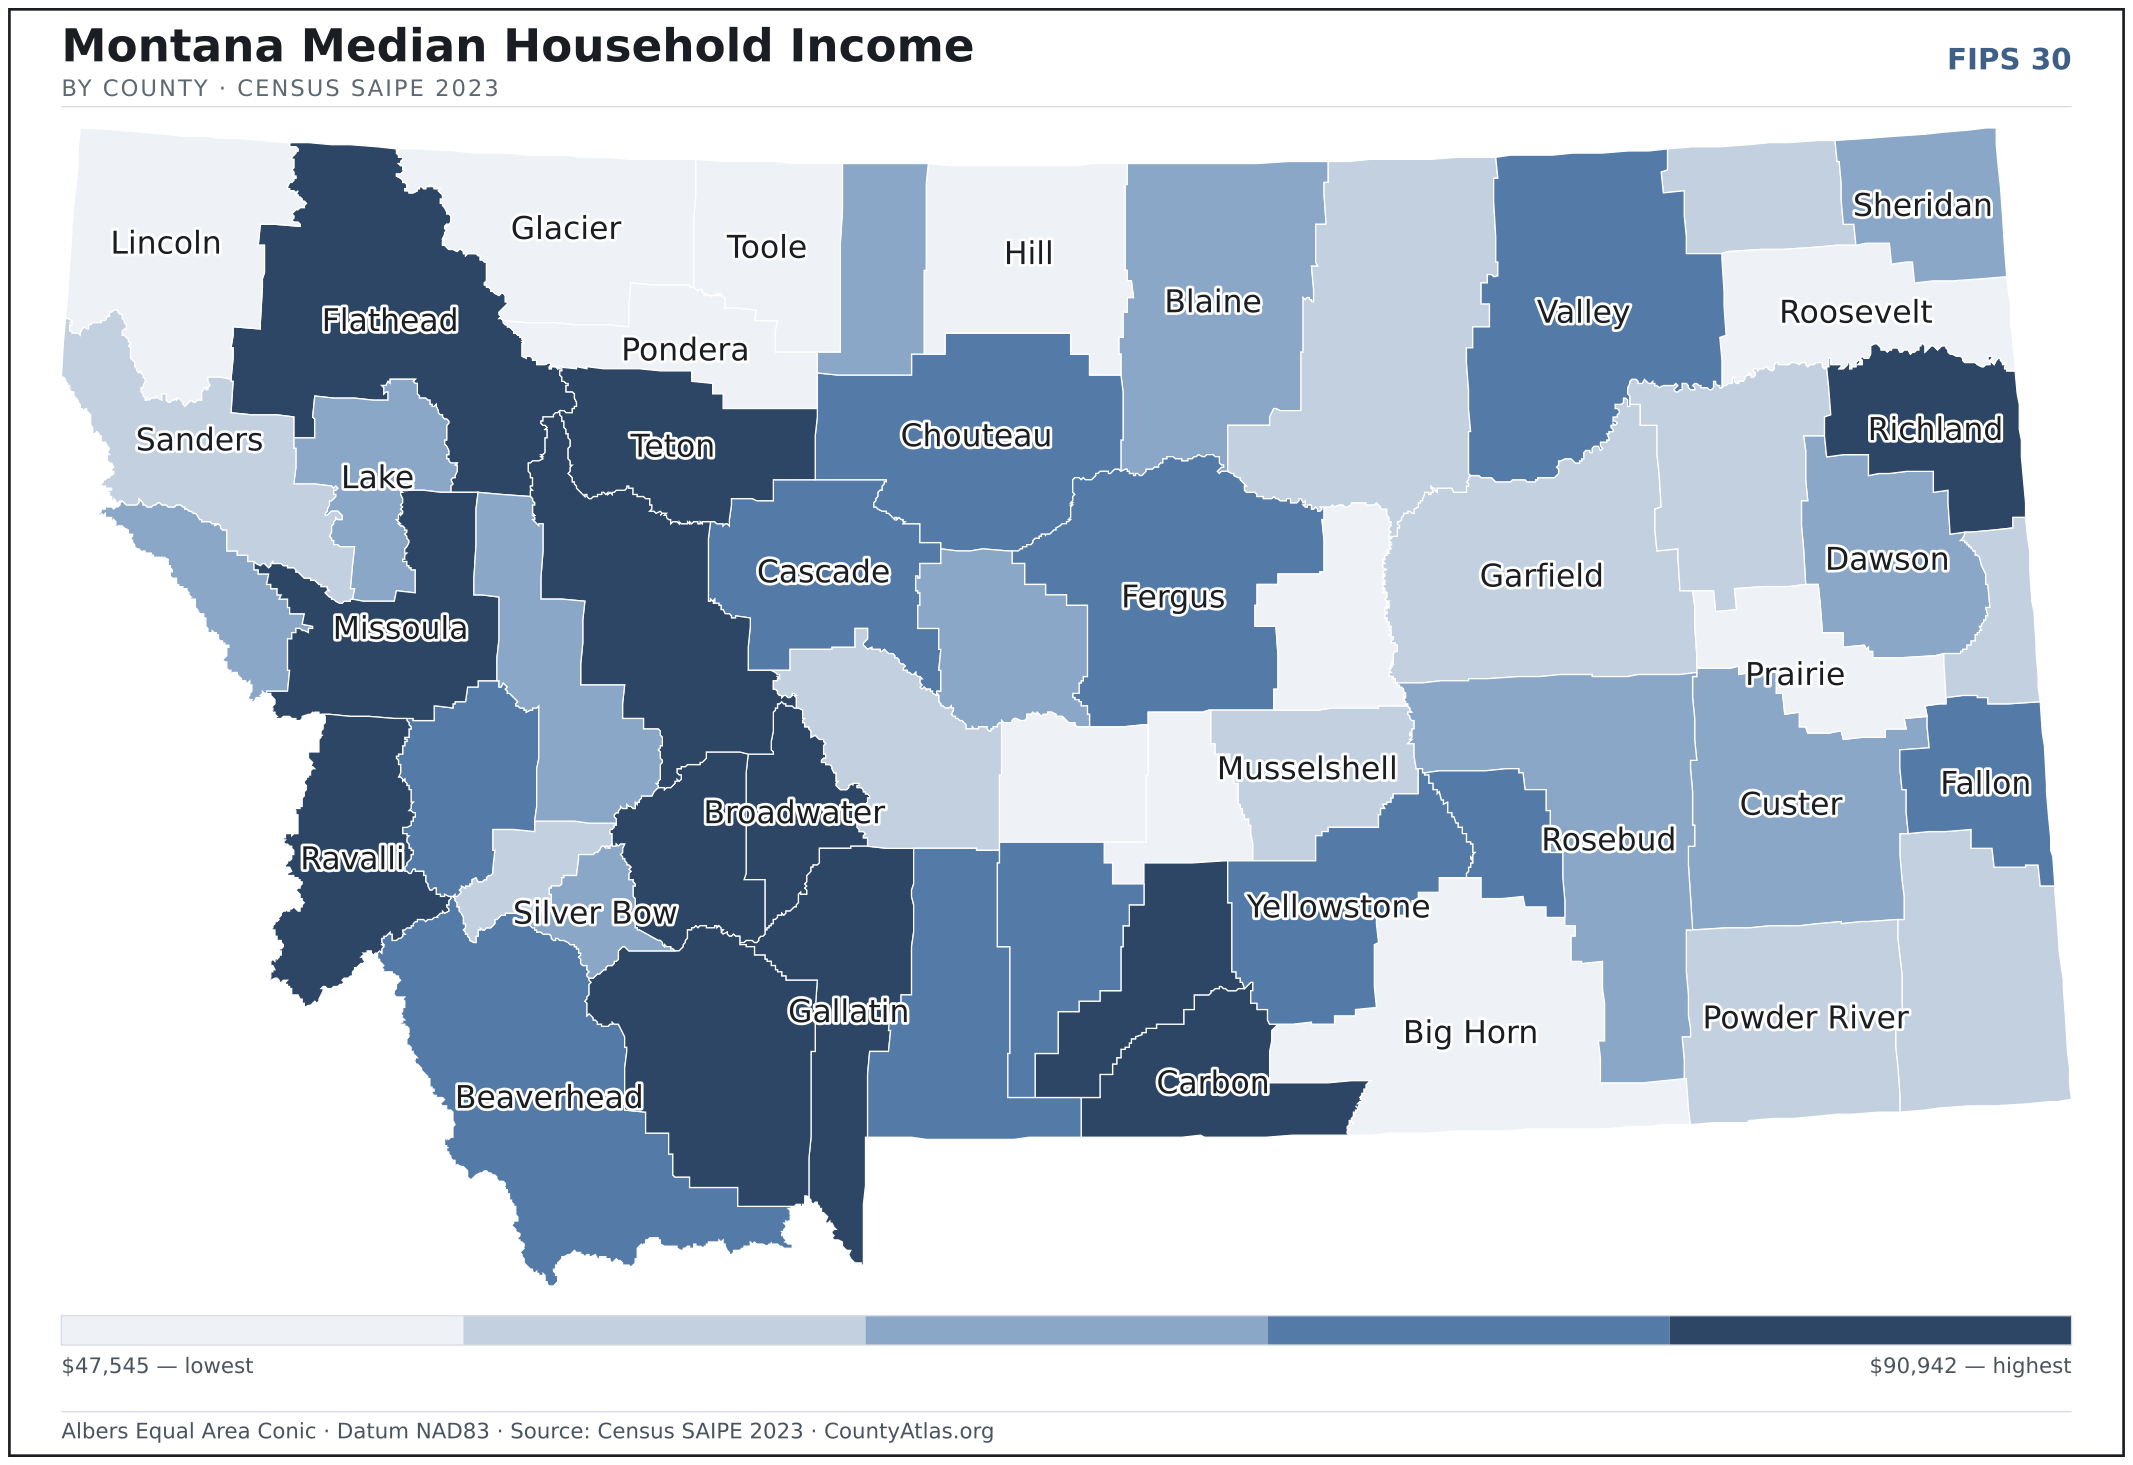
- Income tracks poverty. The gap from richest to poorest runs 1.9×, and the 10 highest-income counties average 9.4% in poverty against 19.2% for the 10 lowest. Census SAIPE 2023
- Mostly small. Half of Montana’s counties have fewer than 7,753 residents, and half report a median household income below $59,534 — a few metros lift the statewide totals well above both. Census PEP 2023 · SAIPE 2023
- Lopsided density. Only 11 of 56 counties are denser than Montana’s statewide average of 8 people per square mile — the rest are more rural. Census PEP 2023 · TIGER
| Beaverhead County | 9,885 | $63,084 | 2.3% | 2/sq mi | 5,543 sq mi | Dillon |
| Big Horn County | 12,751 | $51,259 | 5.7% | 3/sq mi | 4,998 sq mi | Hardin |
| Blaine County | 6,899 | $56,865 | 2.8% | 2/sq mi | 4,228 sq mi | Chinook |
| Broadwater County | 8,032 | $72,933 | 2.5% | 7/sq mi | 1,192 sq mi | Townsend |
| Carbon County | 11,419 | $72,463 | 2.5% | 6/sq mi | 2,048 sq mi | Red Lodge |
| Carter County | 1,418 | $55,704 | 1.7% | 0/sq mi | 3,340 sq mi | Ekalaka |
| Cascade County | 84,900 | $65,018 | 2.9% | 31/sq mi | 2,698 sq mi | Great Falls |
| Chouteau County | 5,847 | $61,903 | 2.6% | 1/sq mi | 3,973 sq mi | Fort Benton |
| Custer County | 11,985 | $58,850 | 2.2% | 3/sq mi | 3,783 sq mi | Miles City |
| Daniels County | 1,633 | $56,695 | 1.8% | 1/sq mi | 1,426 sq mi | Scobey |
| Dawson County | 8,810 | $60,663 | 2.5% | 4/sq mi | 2,372 sq mi | Glendive |
| Deer Lodge County | 9,673 | $56,648 | 3.5% | 13/sq mi | 737 sq mi | Anaconda-Deer Lodge County |
| Fallon County | 2,994 | $66,776 | 2.6% | 2/sq mi | 1,621 sq mi | Baker |
| Fergus County | 11,772 | $63,717 | 2.6% | 3/sq mi | 4,339 sq mi | Lewistown |
| Flathead County | 113,679 | $74,150 | 3.0% | 22/sq mi | 5,087 sq mi | Kalispell |
| Gallatin County | 126,409 | $90,942 | 2.6% | 49/sq mi | 2,605 sq mi | Bozeman |
| Garfield County | 1,211 | $53,069 | 2.0% | 0/sq mi | 4,677 sq mi | Jordan |
| Glacier County | 13,609 | $51,416 | 4.5% | 5/sq mi | 2,995 sq mi | Cut Bank |
| Golden Valley County | 835 | $47,927 | 2.8% | 1/sq mi | 1,174 sq mi | Ryegate |
| Granite County | 3,595 | $65,695 | 5.2% | 2/sq mi | 1,727 sq mi | Philipsburg |
| Hill County | 16,276 | $51,435 | 2.8% | 6/sq mi | 2,899 sq mi | Havre |
| Jefferson County | 13,048 | $85,163 | 2.5% | 8/sq mi | 1,657 sq mi | Boulder |
| Judith Basin County | 2,093 | $57,166 | 2.4% | 1/sq mi | 1,870 sq mi | Stanford |
| Lake County | 33,338 | $60,882 | 3.2% | 22/sq mi | 1,491 sq mi | Polson |
| Lewis and Clark County | 75,011 | $76,816 | 2.7% | 22/sq mi | 3,458 sq mi | Helena |
| Liberty County | 1,974 | $60,846 | 2.0% | 1/sq mi | 1,430 sq mi | Chester |
| Lincoln County | 21,895 | $51,941 | 5.6% | 6/sq mi | 3,613 sq mi | Libby |
| Madison County | 9,521 | $73,316 | 7.7% | 3/sq mi | 3,588 sq mi | Virginia City |
| McCone County | 1,676 | $56,696 | 2.8% | 1/sq mi | 2,642 sq mi | Circle |
| Meagher County | 2,071 | $55,193 | 2.5% | 1/sq mi | 2,392 sq mi | White Sulphur Springs |
| Mineral County | 5,090 | $58,832 | 3.7% | 4/sq mi | 1,220 sq mi | Superior |
| Missoula County | 121,849 | $72,882 | 2.6% | 47/sq mi | 2,593 sq mi | Missoula |
| Musselshell County | 5,308 | $55,991 | 4.5% | 3/sq mi | 1,869 sq mi | Roundup |
| Park County | 17,903 | $63,958 | 2.4% | 6/sq mi | 2,802 sq mi | Livingston |
| Petroleum County | 554 | $50,164 | 3.7% | 0/sq mi | 1,656 sq mi | Winnett |
| Phillips County | 4,249 | $53,212 | 2.9% | 1/sq mi | 5,140 sq mi | Malta |
| Pondera County | 6,125 | $47,659 | 3.1% | 4/sq mi | 1,625 sq mi | Conrad |
| Powder River County | 1,743 | $56,746 | 1.7% | 1/sq mi | 3,298 sq mi | Broadus |
| Powell County | 7,133 | $61,354 | 3.7% | 3/sq mi | 2,326 sq mi | Deer Lodge |
| Prairie County | 1,112 | $52,555 | 1.6% | 1/sq mi | 1,737 sq mi | Terry |
| Ravalli County | 47,738 | $70,624 | 3.1% | 20/sq mi | 2,391 sq mi | Hamilton |
| Richland County | 11,173 | $74,540 | 2.5% | 5/sq mi | 2,085 sq mi | Sidney |
| Roosevelt County | 10,319 | $51,596 | 3.6% | 4/sq mi | 2,355 sq mi | Wolf Point |
| Rosebud County | 8,160 | $60,218 | 4.0% | 2/sq mi | 5,008 sq mi | Forsyth |
| Sanders County | 13,684 | $54,599 | 4.4% | 5/sq mi | 2,760 sq mi | Thompson Falls |
| Sheridan County | 3,498 | $58,094 | 2.0% | 2/sq mi | 1,677 sq mi | Plentywood |
| Silver Bow County | 36,360 | $58,406 | 3.4% | 51/sq mi | 718 sq mi | — |
| Stillwater County | 9,173 | $81,392 | 2.8% | 5/sq mi | 1,797 sq mi | Columbus |
| Sweet Grass County | 3,763 | $70,052 | 2.3% | 2/sq mi | 1,856 sq mi | Big Timber |
| Teton County | 6,430 | $71,393 | 2.4% | 3/sq mi | 2,272 sq mi | Choteau |
| Toole County | 5,133 | $52,399 | 2.2% | 3/sq mi | 1,915 sq mi | Shelby |
| Treasure County | 772 | $61,560 | 2.8% | 1/sq mi | 978 sq mi | Hysham |
| Valley County | 7,474 | $63,507 | 2.6% | 2/sq mi | 4,926 sq mi | Glasgow |
| Wheatland County | 2,057 | $47,545 | 3.8% | 1/sq mi | 1,422 sq mi | Harlowton |
| Wibaux County | 910 | $56,108 | 2.3% | 1/sq mi | 890 sq mi | Wibaux |
| Yellowstone County | 170,843 | $70,221 | 2.8% | 65/sq mi | 2,633 sq mi | Billings |
All 56 counties, sortable by any column — click a heading. A suppressed estimate (coefficient of variation ≥ 0.30) shows a marker, never a guess. County seats are from Wikidata (CC0), each validated to a Census place inside its county; a county with no validated seat is left blank. See the methodology.
Download & print this Montana map
Montana maps, coloured by the data
Cities in Montana
Montana has 127 incorporated cities and towns. The largest is Billings in Yellowstone County with 118,321 residents. Use the search on the map above to find any city and highlight the county it sits in.
| Billings | Yellowstone County | 118,321 |
| Missoula | Missoula County | 75,600 |
| Great Falls | Cascade County | 60,412 |
| Bozeman | Gallatin County | 55,042 |
| Butte-Silver Bow (balance) | Silver Bow County | 34,929 |
| Helena | Lewis and Clark County | 33,126 |
| Kalispell | Flathead County | 26,830 |
| Belgrade | Gallatin County | 11,425 |
| Anaconda-Deer Lodge County | Deer Lodge County | 9,512 |
| Havre | Hill County | 9,333 |
| Livingston | Park County | 8,635 |
| Whitefish | Flathead County | 8,422 |
| Miles City | Custer County | 8,412 |
| Laurel | Yellowstone County | 7,198 |
| Sidney | Richland County | 6,235 |
| Lewistown | Fergus County | 6,028 |
| Columbia Falls | Flathead County | 5,531 |
| Polson | Lake County | 5,334 |
| Hamilton | Ravalli County | 4,949 |
| Glendive | Dawson County | 4,831 |
| Dillon | Beaverhead County | 4,020 |
| Hardin | Big Horn County | 3,766 |
| Glasgow | Valley County | 3,194 |
| Shelby | Toole County | 3,129 |
| Cut Bank | Glacier County | 3,040 |
| Deer Lodge | Powell County | 3,035 |
| Libby | Lincoln County | 2,948 |
| Wolf Point | Roosevelt County | 2,604 |
| Conrad | Pondera County | 2,553 |
| Red Lodge | Carbon County | 2,399 |
| Townsend | Broadwater County | 2,232 |
| Stevensville (town) | Ravalli County | 2,172 |
| Colstrip | Rosebud County | 2,156 |
| Manhattan (town) | Gallatin County | 2,149 |
| Three Forks | Gallatin County | 2,034 |
| Eureka (town) | Lincoln County | 2,009 |
| Roundup | Musselshell County | 1,964 |
| Ronan | Lake County | 1,962 |
| Columbus (town) | Stillwater County | 1,925 |
| Malta | Phillips County | 1,902 |
| East Helena | Lewis and Clark County | 1,855 |
| Choteau | Teton County | 1,719 |
| Forsyth | Rosebud County | 1,682 |
| Plentywood | Sheridan County | 1,677 |
| Thompson Falls | Sanders County | 1,568 |
| Baker | Fallon County | 1,535 |
| Big Timber | Sweet Grass County | 1,530 |
| Fort Benton | Chouteau County | 1,470 |
| Chinook | Blaine County | 1,460 |
| West Yellowstone (town) | Gallatin County | 1,457 |
Showing the 50 most populous — and 77 more. Search the map above for any Montana city or village.
A city can span more than one county; each is listed in its primary county — the one its center falls in.
Which Montana county is the richest, largest, most crowded? The answers
- Montana’s highest median household income is in Gallatin County ($90,942); the lowest is in Wheatland County ($47,545). Census SAIPE 2023
- Montana’s most populous county is Yellowstone County (170,843); the least populous is Petroleum County (554) — a 308× spread. Census PEP 2023
- Montana’s largest county by land area is Beaverhead County (5,543 sq mi); the smallest is Silver Bow County (718 sq mi). Census TIGER
- Montana’s highest population density is in Yellowstone County (65/sq mi); the lowest is in Garfield County (0/sq mi). Census PEP 2023 · TIGER
- Montana’s highest poverty rate is in Glacier County (28.0%); the lowest is in Stillwater County (8.3%). Census SAIPE 2023
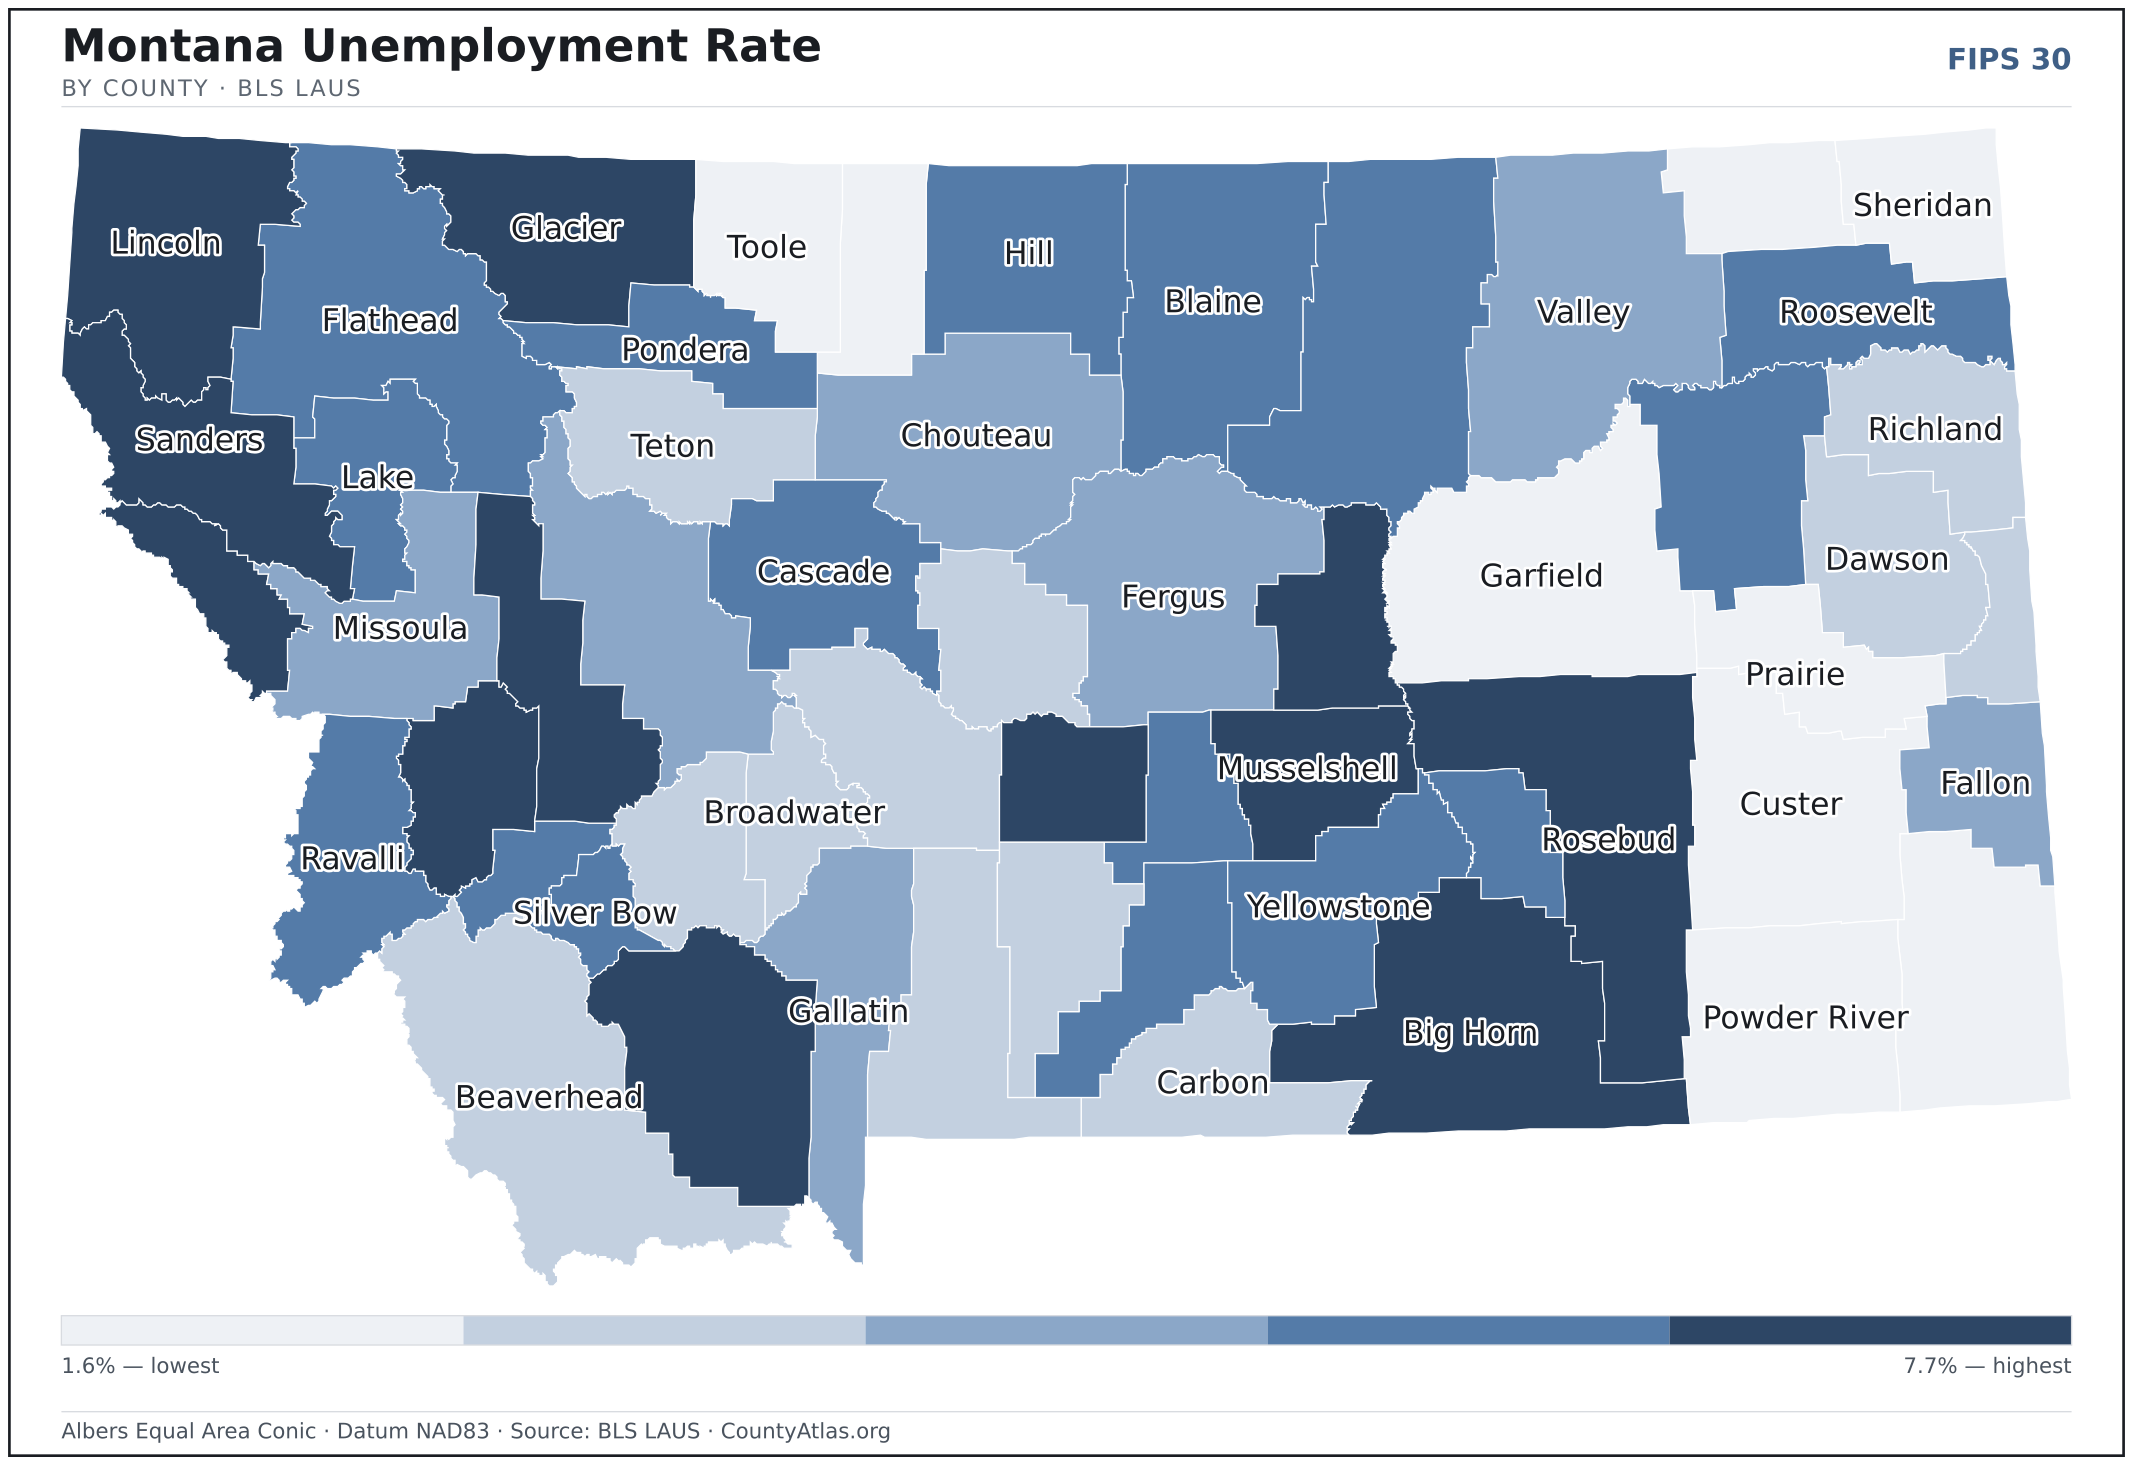
- In Montana, unemployment is highest in Madison County (7.7%) and lowest in Prairie County (1.6%), for May 2026. BLS LAUS
- Montana’s highest median age is in Meagher County (59.9); the lowest is in Roosevelt County (30.5). Census ACS 2019–2023
- Montana’s highest share of bachelor’s degrees is in Gallatin County (53.1% of adults); the lowest is in Fallon County (16.5%). Census ACS 2019–2023
Every figure is a current official estimate from the source named — not a crowd-sourced or copied value. Suppressed estimates (coefficient of variation ≥ 0.30) are omitted, never guessed. See the full methodology.
Montana counties: common questions
How many counties are in Montana?
Montana has 56 counties covering 145,550 sq mi and about 1.1M residents. Every one is on the map above and in the table below.
What is the largest county in Montana?
It depends on the measure. By land area it’s Beaverhead County (5,543 sq mi); by population it’s Yellowstone County (170,843 residents).
What county is Billings in?
Billings (population 118,321) is in Yellowstone County. Use the search on the map to find any Montana city’s county.
What is the richest county in Montana?
By median household income, Gallatin County is the richest at $90,942; the poorest is Wheatland County at $47,545 (Census SAIPE 2023).
What is the most populous county in Montana?
Yellowstone County, with 170,843 residents — about 15.1% of Montana’s people, and 308× the least populous, Petroleum County (554).
Sources & vintages
- Population — PEP Vintage 2023 (July 1, 2023) — pep/charv
- Median household income & poverty — SAIPE 2023
- Unemployment — BLS LAUS May 2026 (preliminary)
- Geometry & boundaries — Census TIGERweb
- Cities & city population — Census TIGERweb Incorporated Places + ACS 5-year 2019–2023
Data current through .