CountyAtlas Ohio
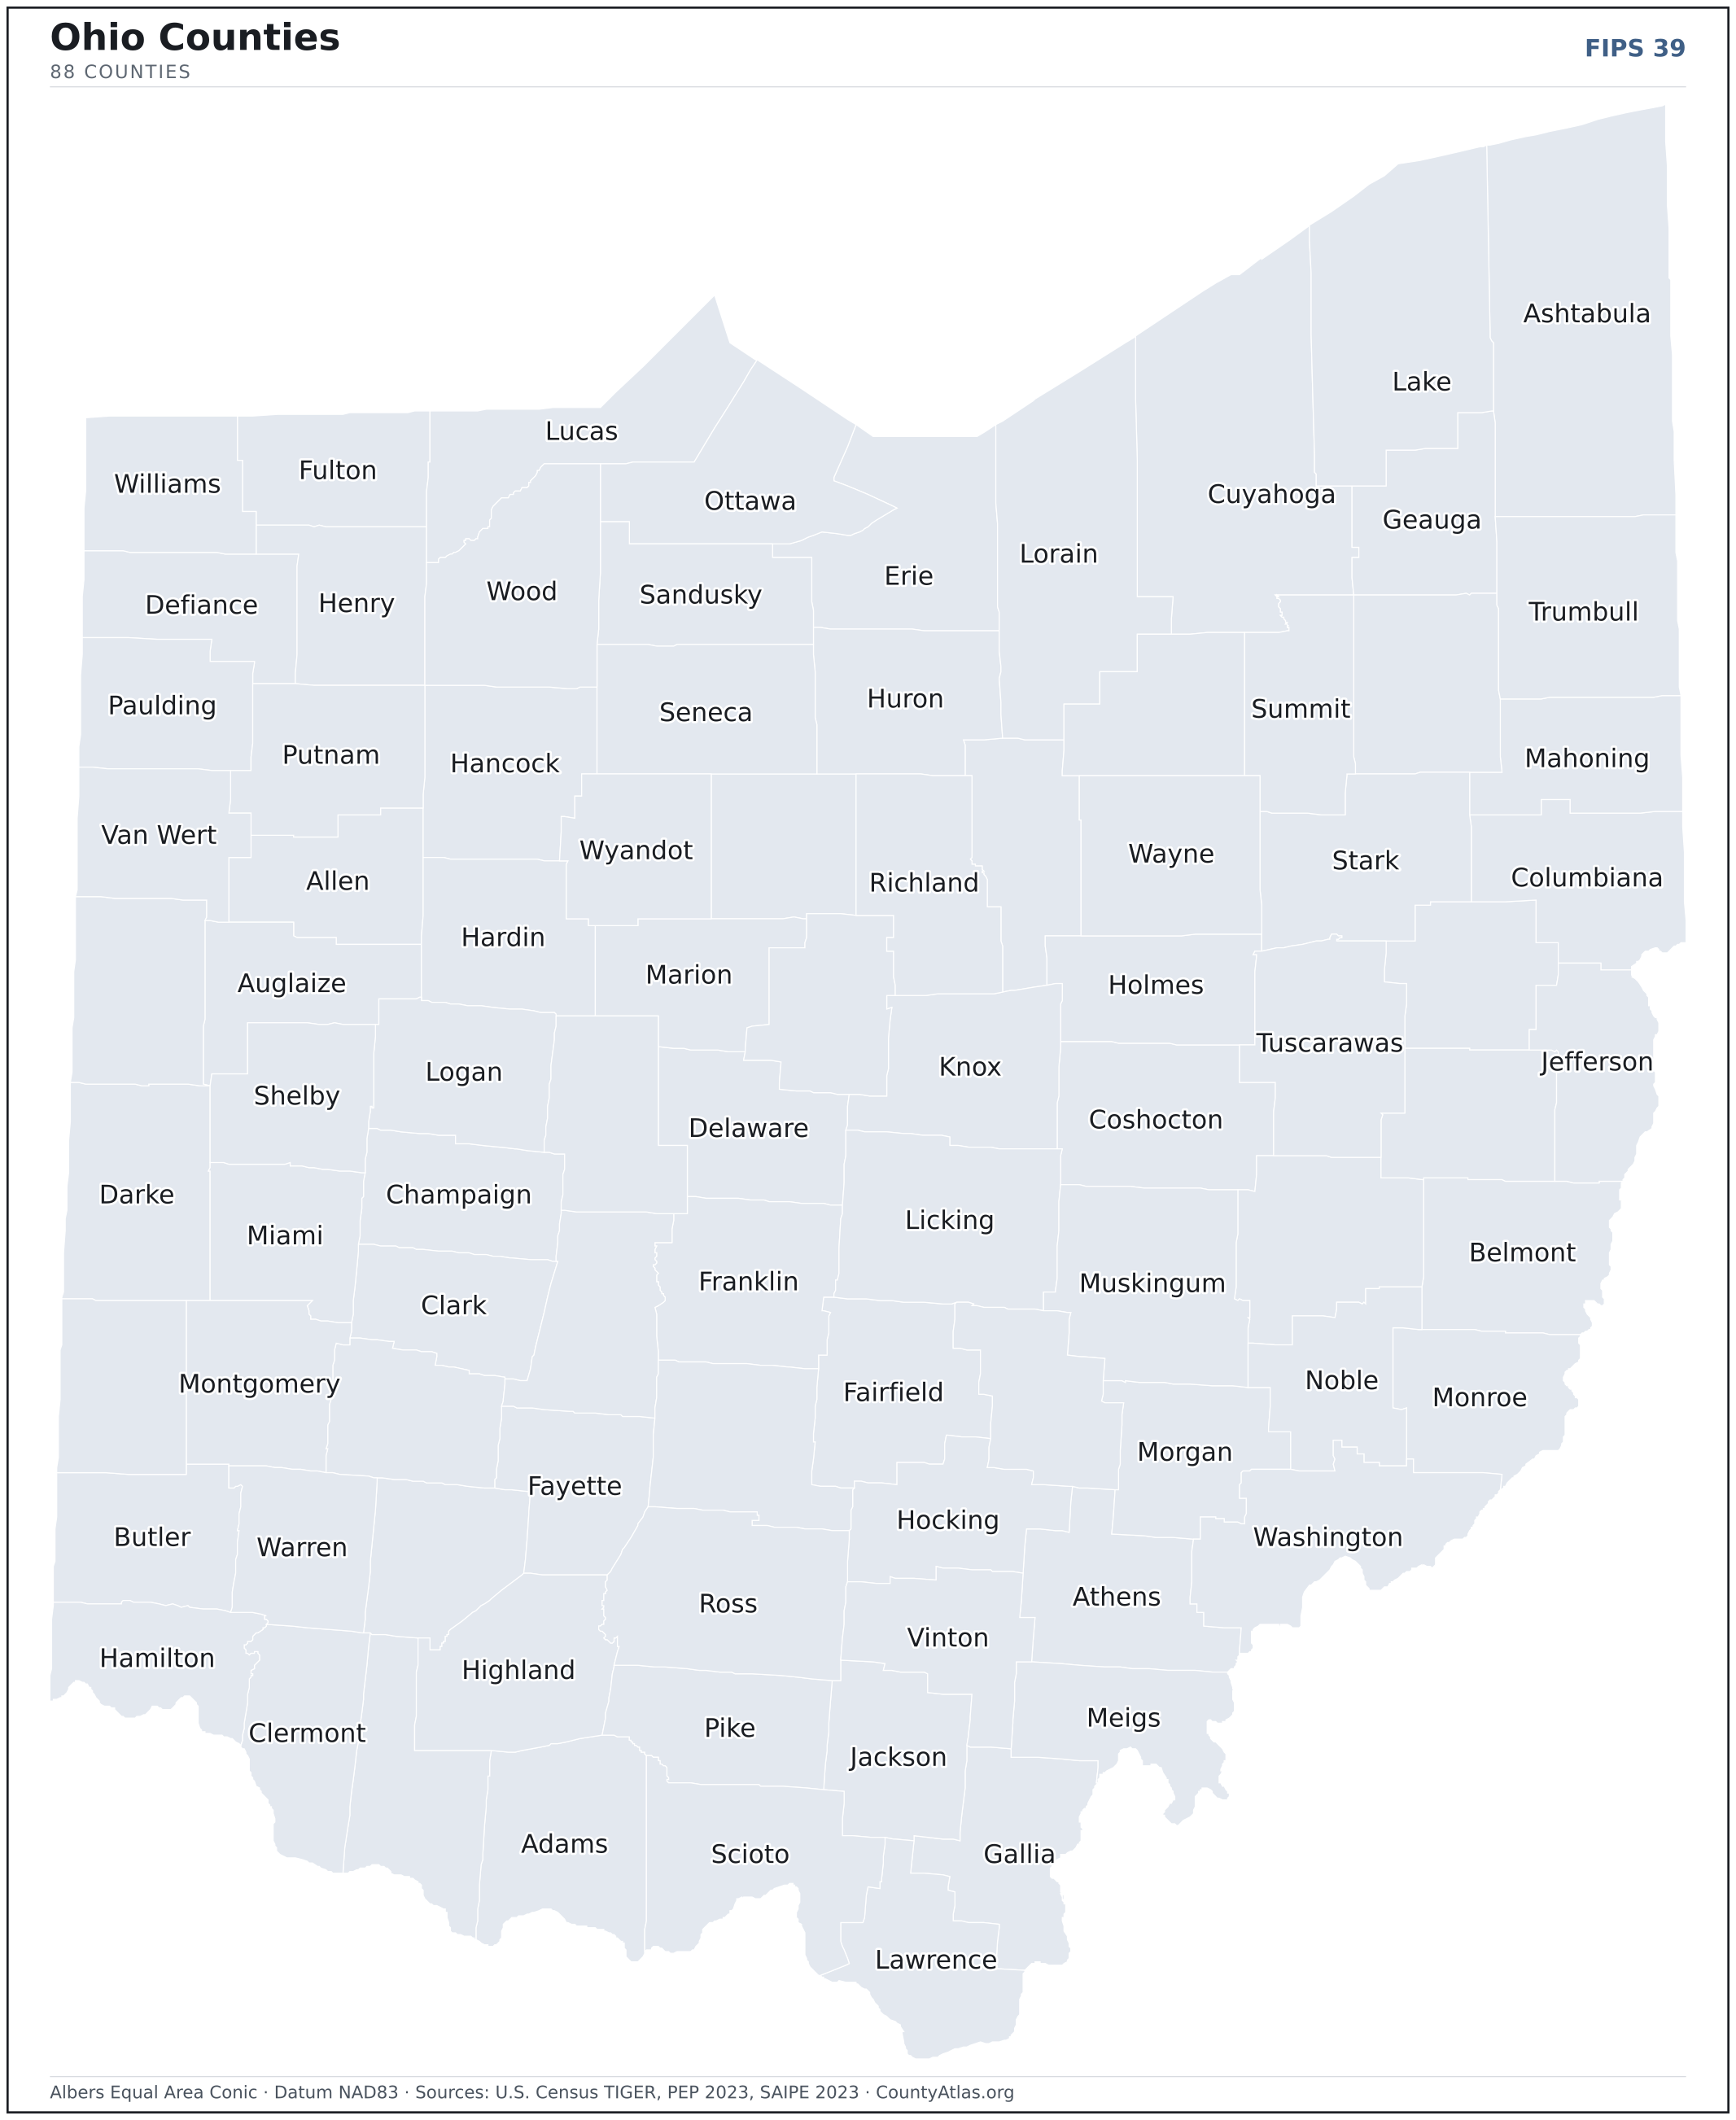
Ohio County Map with Cities — All 88 Counties
All 88 of Ohio's counties, mapped from official U.S. Census boundaries with population, income, and unemployment for every one. Colour the map by any measure, tap a county for its data, or download a print-ready copy.
Tap any county for its population, income, and more.
Ohio at a glance
- Scale. Ohio is divided into 88 counties across 40,859 sq mi of land — an average of 464 sq mi each. Census TIGER
- People. Its counties are home to 11,785,935 residents — an average of 133,931 each, or 288 per square mile statewide. Census PEP 2023
- Water. Another 3,967 sq mi is water — 8.8% of the state’s area, led by Cuyahoga County. Census TIGER
Ohio’s 88 counties, by the numbers
Every county’s population, median household income, unemployment, density, and land area — sortable by any column, so you can find yours or rank by what matters to you. A few patterns run through the data:
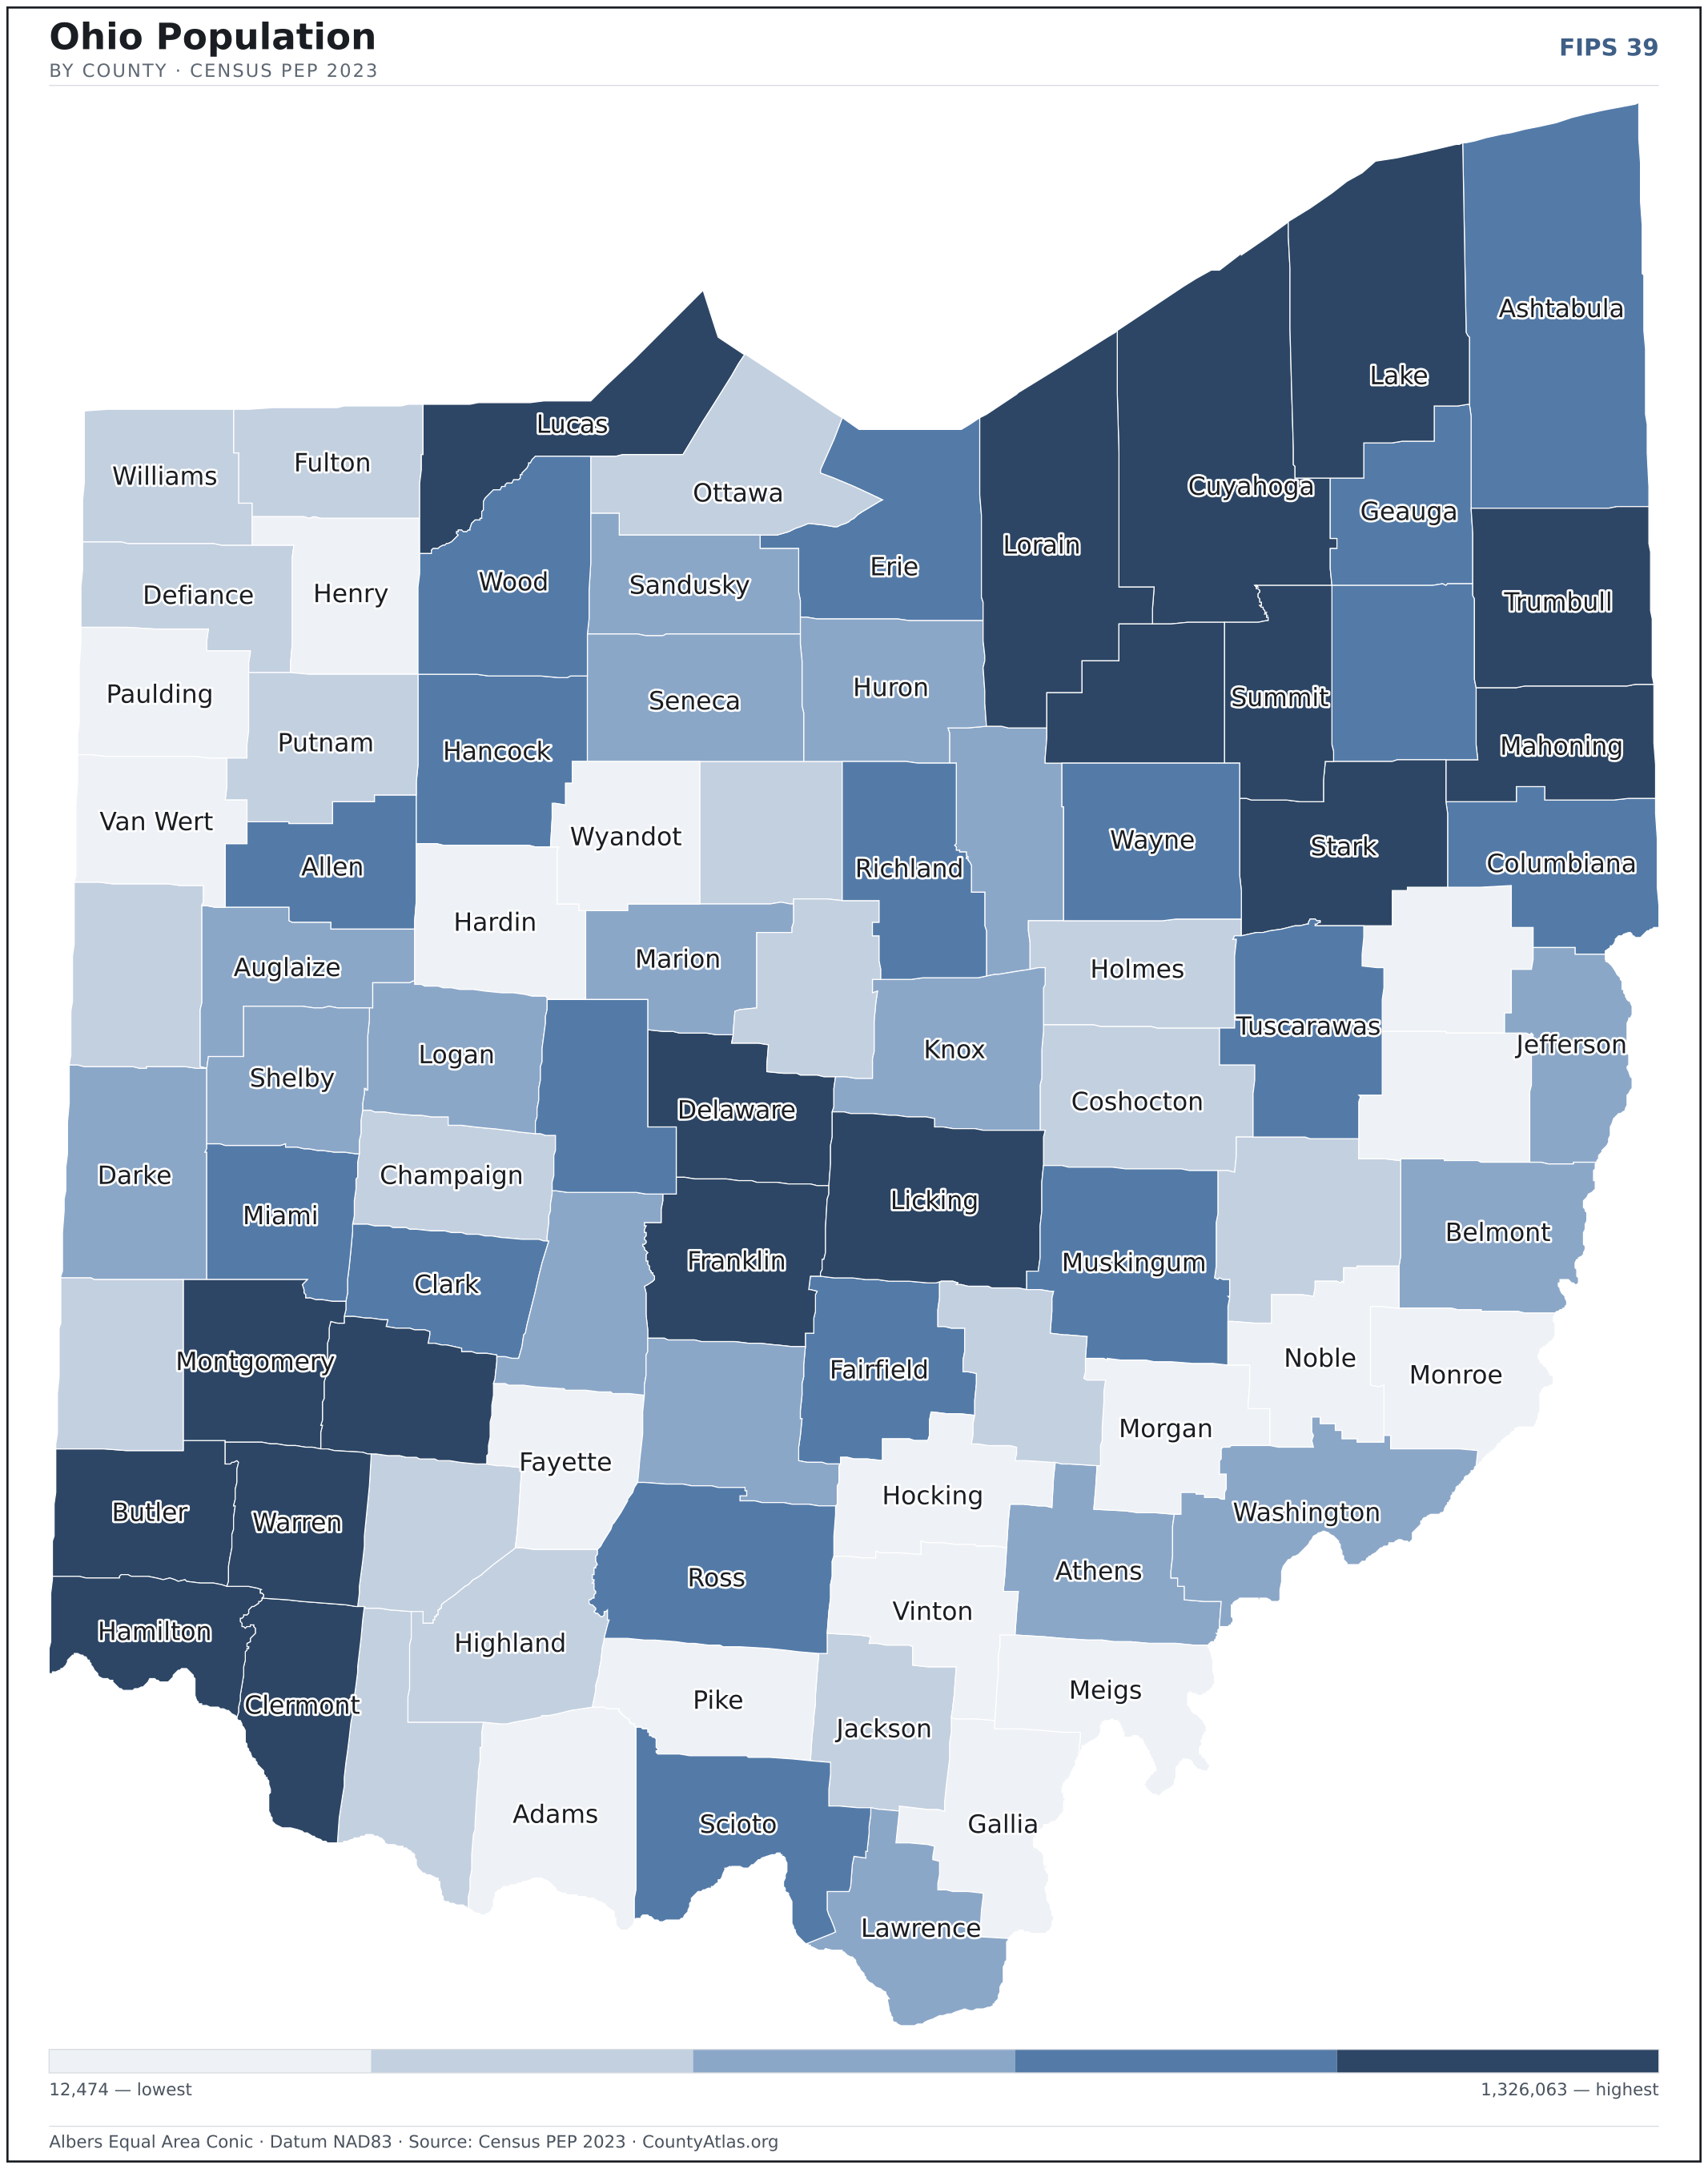
- Concentrated. Half of Ohio’s 11,785,935 residents live in just 9 of 88 counties, and the five largest hold 37.8% of the total. Census PEP 2023
- Income tracks poverty. The gap from richest to poorest runs 2.6×, and the 10 highest-income counties average 7.5% in poverty against 18.7% for the 10 lowest. Census SAIPE 2023
- Mostly small. Half of Ohio’s counties have fewer than 58,388 residents, and half report a median household income below $65,205 — a few metros lift the statewide totals well above both. Census PEP 2023 · SAIPE 2023
- Lopsided density. Only 21 of 88 counties are denser than Ohio’s statewide average of 288 people per square mile — the rest are more rural. Census PEP 2023 · TIGER
| Adams County | 27,521 | $55,693 | 3.4% | 47/sq mi | 584 sq mi | West Union |
| Allen County | 100,838 | $65,665 | 3.0% | 250/sq mi | 403 sq mi | Lima |
| Ashland County | 52,190 | $66,149 | 2.7% | 123/sq mi | 423 sq mi | Ashland |
| Ashtabula County | 96,845 | $58,152 | 3.2% | 138/sq mi | 702 sq mi | Jefferson |
| Athens County | 62,706 | $53,616 | 3.3% | 125/sq mi | 504 sq mi | Athens |
| Auglaize County | 46,050 | $73,542 | 2.2% | 115/sq mi | 401 sq mi | Wapakoneta |
| Belmont County | 64,918 | $56,716 | 3.2% | 122/sq mi | 532 sq mi | St. Clairsville |
| Brown County | 43,777 | $68,289 | 3.1% | 89/sq mi | 490 sq mi | Georgetown |
| Butler County | 393,043 | $80,066 | 2.9% | 842/sq mi | 467 sq mi | Hamilton |
| Carroll County | 26,758 | $67,044 | 3.1% | 68/sq mi | 395 sq mi | Carrollton |
| Champaign County | 38,845 | $70,230 | 2.6% | 91/sq mi | 429 sq mi | Urbana |
| Clark County | 134,610 | $58,684 | 3.2% | 340/sq mi | 396 sq mi | Springfield |
| Clermont County | 211,972 | $82,143 | 2.7% | 468/sq mi | 453 sq mi | Batavia |
| Clinton County | 41,938 | $67,813 | 2.7% | 103/sq mi | 409 sq mi | Wilmington |
| Columbiana County | 100,182 | $55,744 | 3.1% | 188/sq mi | 532 sq mi | Lisbon |
| Coshocton County | 36,869 | $57,694 | 3.1% | 65/sq mi | 564 sq mi | Coshocton |
| Crawford County | 41,529 | $58,982 | 3.2% | 103/sq mi | 402 sq mi | Bucyrus |
| Cuyahoga County | 1,233,088 | $61,912 | 3.2% | 2,697/sq mi | 457 sq mi | Cleveland |
| Darke County | 51,415 | $67,609 | 2.9% | 86/sq mi | 598 sq mi | Greenville |
| Defiance County | 38,315 | $72,241 | 2.6% | 93/sq mi | 411 sq mi | Defiance |
| Delaware County | 231,636 | $128,300 | 2.4% | 523/sq mi | 443 sq mi | Delaware |
| Erie County | 74,035 | $62,547 | 2.9% | 295/sq mi | 251 sq mi | Sandusky |
| Fairfield County | 165,360 | $84,701 | 2.6% | 328/sq mi | 504 sq mi | Lancaster |
| Fayette County | 28,817 | $63,348 | 2.9% | 71/sq mi | 406 sq mi | Washington Court House |
| Franklin County | 1,326,063 | $71,730 | 2.7% | 2,491/sq mi | 532 sq mi | Columbus |
| Fulton County | 42,007 | $70,724 | 3.0% | 104/sq mi | 405 sq mi | Wauseon |
| Gallia County | 28,986 | $53,956 | 3.0% | 62/sq mi | 467 sq mi | Gallipolis |
| Geauga County | 95,407 | $99,863 | 2.6% | 238/sq mi | 400 sq mi | Chardon |
| Greene County | 169,691 | $84,015 | 2.8% | 410/sq mi | 414 sq mi | Xenia |
| Guernsey County | 38,089 | $54,757 | 3.1% | 73/sq mi | 522 sq mi | Cambridge |
| Hamilton County | 827,058 | $68,810 | 2.9% | 2,040/sq mi | 405 sq mi | Cincinnati |
| Hancock County | 74,704 | $72,065 | 2.6% | 141/sq mi | 531 sq mi | Findlay |
| Hardin County | 30,368 | $59,713 | 3.0% | 65/sq mi | 470 sq mi | Kenton |
| Harrison County | 14,159 | $57,050 | 3.1% | 35/sq mi | 402 sq mi | Cadiz |
| Henry County | 27,520 | $81,899 | 2.7% | 66/sq mi | 416 sq mi | Napoleon |
| Highland County | 43,614 | $61,760 | 3.4% | 79/sq mi | 553 sq mi | Hillsboro |
| Hocking County | 27,540 | $58,018 | 3.2% | 65/sq mi | 421 sq mi | Logan |
| Holmes County | 44,386 | $74,490 | 2.0% | 105/sq mi | 423 sq mi | Millersburg |
| Huron County | 58,199 | $64,331 | 2.9% | 118/sq mi | 492 sq mi | Norwalk |
| Jackson County | 32,606 | $54,431 | 3.2% | 78/sq mi | 420 sq mi | Jackson |
| Jefferson County | 64,026 | $56,276 | 3.5% | 157/sq mi | 408 sq mi | Steubenville |
| Knox County | 63,320 | $66,844 | 2.7% | 120/sq mi | 526 sq mi | Mount Vernon |
| Lake County | 231,640 | $73,559 | 2.8% | 1,010/sq mi | 229 sq mi | Painesville |
| Lawrence County | 56,118 | $56,879 | 3.2% | 124/sq mi | 453 sq mi | Ironton |
| Licking County | 183,201 | $76,496 | 2.7% | 268/sq mi | 682 sq mi | Newark |
| Logan County | 46,057 | $68,964 | 2.5% | 100/sq mi | 459 sq mi | Bellefontaine |
| Lorain County | 317,910 | $75,496 | 3.2% | 648/sq mi | 491 sq mi | Elyria |
| Lucas County | 425,484 | $60,525 | 3.9% | 1,253/sq mi | 340 sq mi | Toledo |
| Madison County | 44,602 | $81,836 | 2.4% | 96/sq mi | 467 sq mi | London |
| Mahoning County | 225,596 | $52,914 | 3.8% | 548/sq mi | 412 sq mi | Youngstown |
| Marion County | 64,851 | $56,991 | 2.9% | 161/sq mi | 404 sq mi | Marion |
| Medina County | 184,042 | $90,211 | 2.7% | 437/sq mi | 421 sq mi | Medina |
| Meigs County | 21,767 | $50,127 | 3.7% | 51/sq mi | 430 sq mi | Pomeroy |
| Mercer County | 42,439 | $79,974 | 2.1% | 92/sq mi | 462 sq mi | Celina |
| Miami County | 110,876 | $75,735 | 2.6% | 273/sq mi | 407 sq mi | Troy |
| Monroe County | 13,153 | $54,285 | 3.7% | 29/sq mi | 456 sq mi | Woodsfield |
| Montgomery County | 533,796 | $62,650 | 3.1% | 1,157/sq mi | 461 sq mi | Dayton |
| Morgan County | 13,646 | $52,585 | 3.1% | 33/sq mi | 416 sq mi | McConnelsville |
| Morrow County | 35,595 | $70,109 | 2.7% | 88/sq mi | 406 sq mi | Mount Gilead |
| Muskingum County | 86,305 | $58,806 | 2.8% | 130/sq mi | 665 sq mi | Zanesville |
| Noble County | 14,311 | $61,751 | 3.6% | 36/sq mi | 398 sq mi | Caldwell |
| Ottawa County | 39,803 | $76,582 | 3.2% | 156/sq mi | 255 sq mi | Port Clinton |
| Paulding County | 18,706 | $67,692 | 2.5% | 45/sq mi | 416 sq mi | Paulding |
| Perry County | 35,551 | $62,677 | 3.2% | 87/sq mi | 408 sq mi | New Lexington |
| Pickaway County | 61,086 | $76,471 | 2.8% | 122/sq mi | 501 sq mi | Circleville |
| Pike County | 27,001 | $54,256 | 3.8% | 61/sq mi | 440 sq mi | Waverly |
| Portage County | 162,665 | $73,911 | 2.9% | 334/sq mi | 487 sq mi | Ravenna |
| Preble County | 40,556 | $76,621 | 2.5% | 96/sq mi | 424 sq mi | Eaton |
| Putnam County | 34,199 | $79,412 | 2.3% | 71/sq mi | 483 sq mi | Ottawa |
| Richland County | 125,064 | $57,261 | 3.2% | 253/sq mi | 495 sq mi | Mansfield |
| Ross County | 76,501 | $61,651 | 3.5% | 111/sq mi | 689 sq mi | Chillicothe |
| Sandusky County | 58,709 | $64,744 | 3.2% | 144/sq mi | 408 sq mi | Fremont |
| Scioto County | 71,969 | $52,447 | 3.8% | 118/sq mi | 610 sq mi | Portsmouth |
| Seneca County | 54,527 | $62,966 | 2.8% | 99/sq mi | 551 sq mi | Tiffin |
| Shelby County | 47,765 | $67,351 | 2.5% | 117/sq mi | 408 sq mi | Sidney |
| Stark County | 372,716 | $63,673 | 3.0% | 648/sq mi | 575 sq mi | Canton |
| Summit County | 535,733 | $69,786 | 3.0% | 1,298/sq mi | 413 sq mi | Akron |
| Trumbull County | 200,373 | $51,668 | 4.1% | 324/sq mi | 618 sq mi | Warren |
| Tuscarawas County | 91,874 | $62,098 | 2.6% | 162/sq mi | 568 sq mi | New Philadelphia |
| Union County | 69,637 | $104,592 | 2.2% | 161/sq mi | 432 sq mi | Marysville |
| Van Wert County | 28,704 | $60,555 | 2.5% | 70/sq mi | 409 sq mi | Van Wert |
| Vinton County | 12,474 | $52,999 | 3.3% | 30/sq mi | 412 sq mi | McArthur |
| Warren County | 252,148 | $107,973 | 2.6% | 628/sq mi | 401 sq mi | Lebanon |
| Washington County | 58,577 | $59,646 | 3.0% | 93/sq mi | 632 sq mi | Marietta |
| Wayne County | 116,510 | $69,834 | 2.5% | 210/sq mi | 555 sq mi | Wooster |
| Williams County | 36,591 | $61,183 | 3.0% | 87/sq mi | 421 sq mi | Bryan |
| Wood County | 132,650 | $73,906 | 2.9% | 215/sq mi | 617 sq mi | Bowling Green |
| Wyandot County | 21,457 | $69,913 | 2.3% | 53/sq mi | 407 sq mi | Upper Sandusky |
All 88 counties, sortable by any column — click a heading. A suppressed estimate (coefficient of variation ≥ 0.30) shows a marker, never a guess. County seats are from Wikidata (CC0), each validated to a Census place inside its county; a county with no validated seat is left blank. See the methodology.
Download & print this Ohio map
Ohio maps, coloured by the data
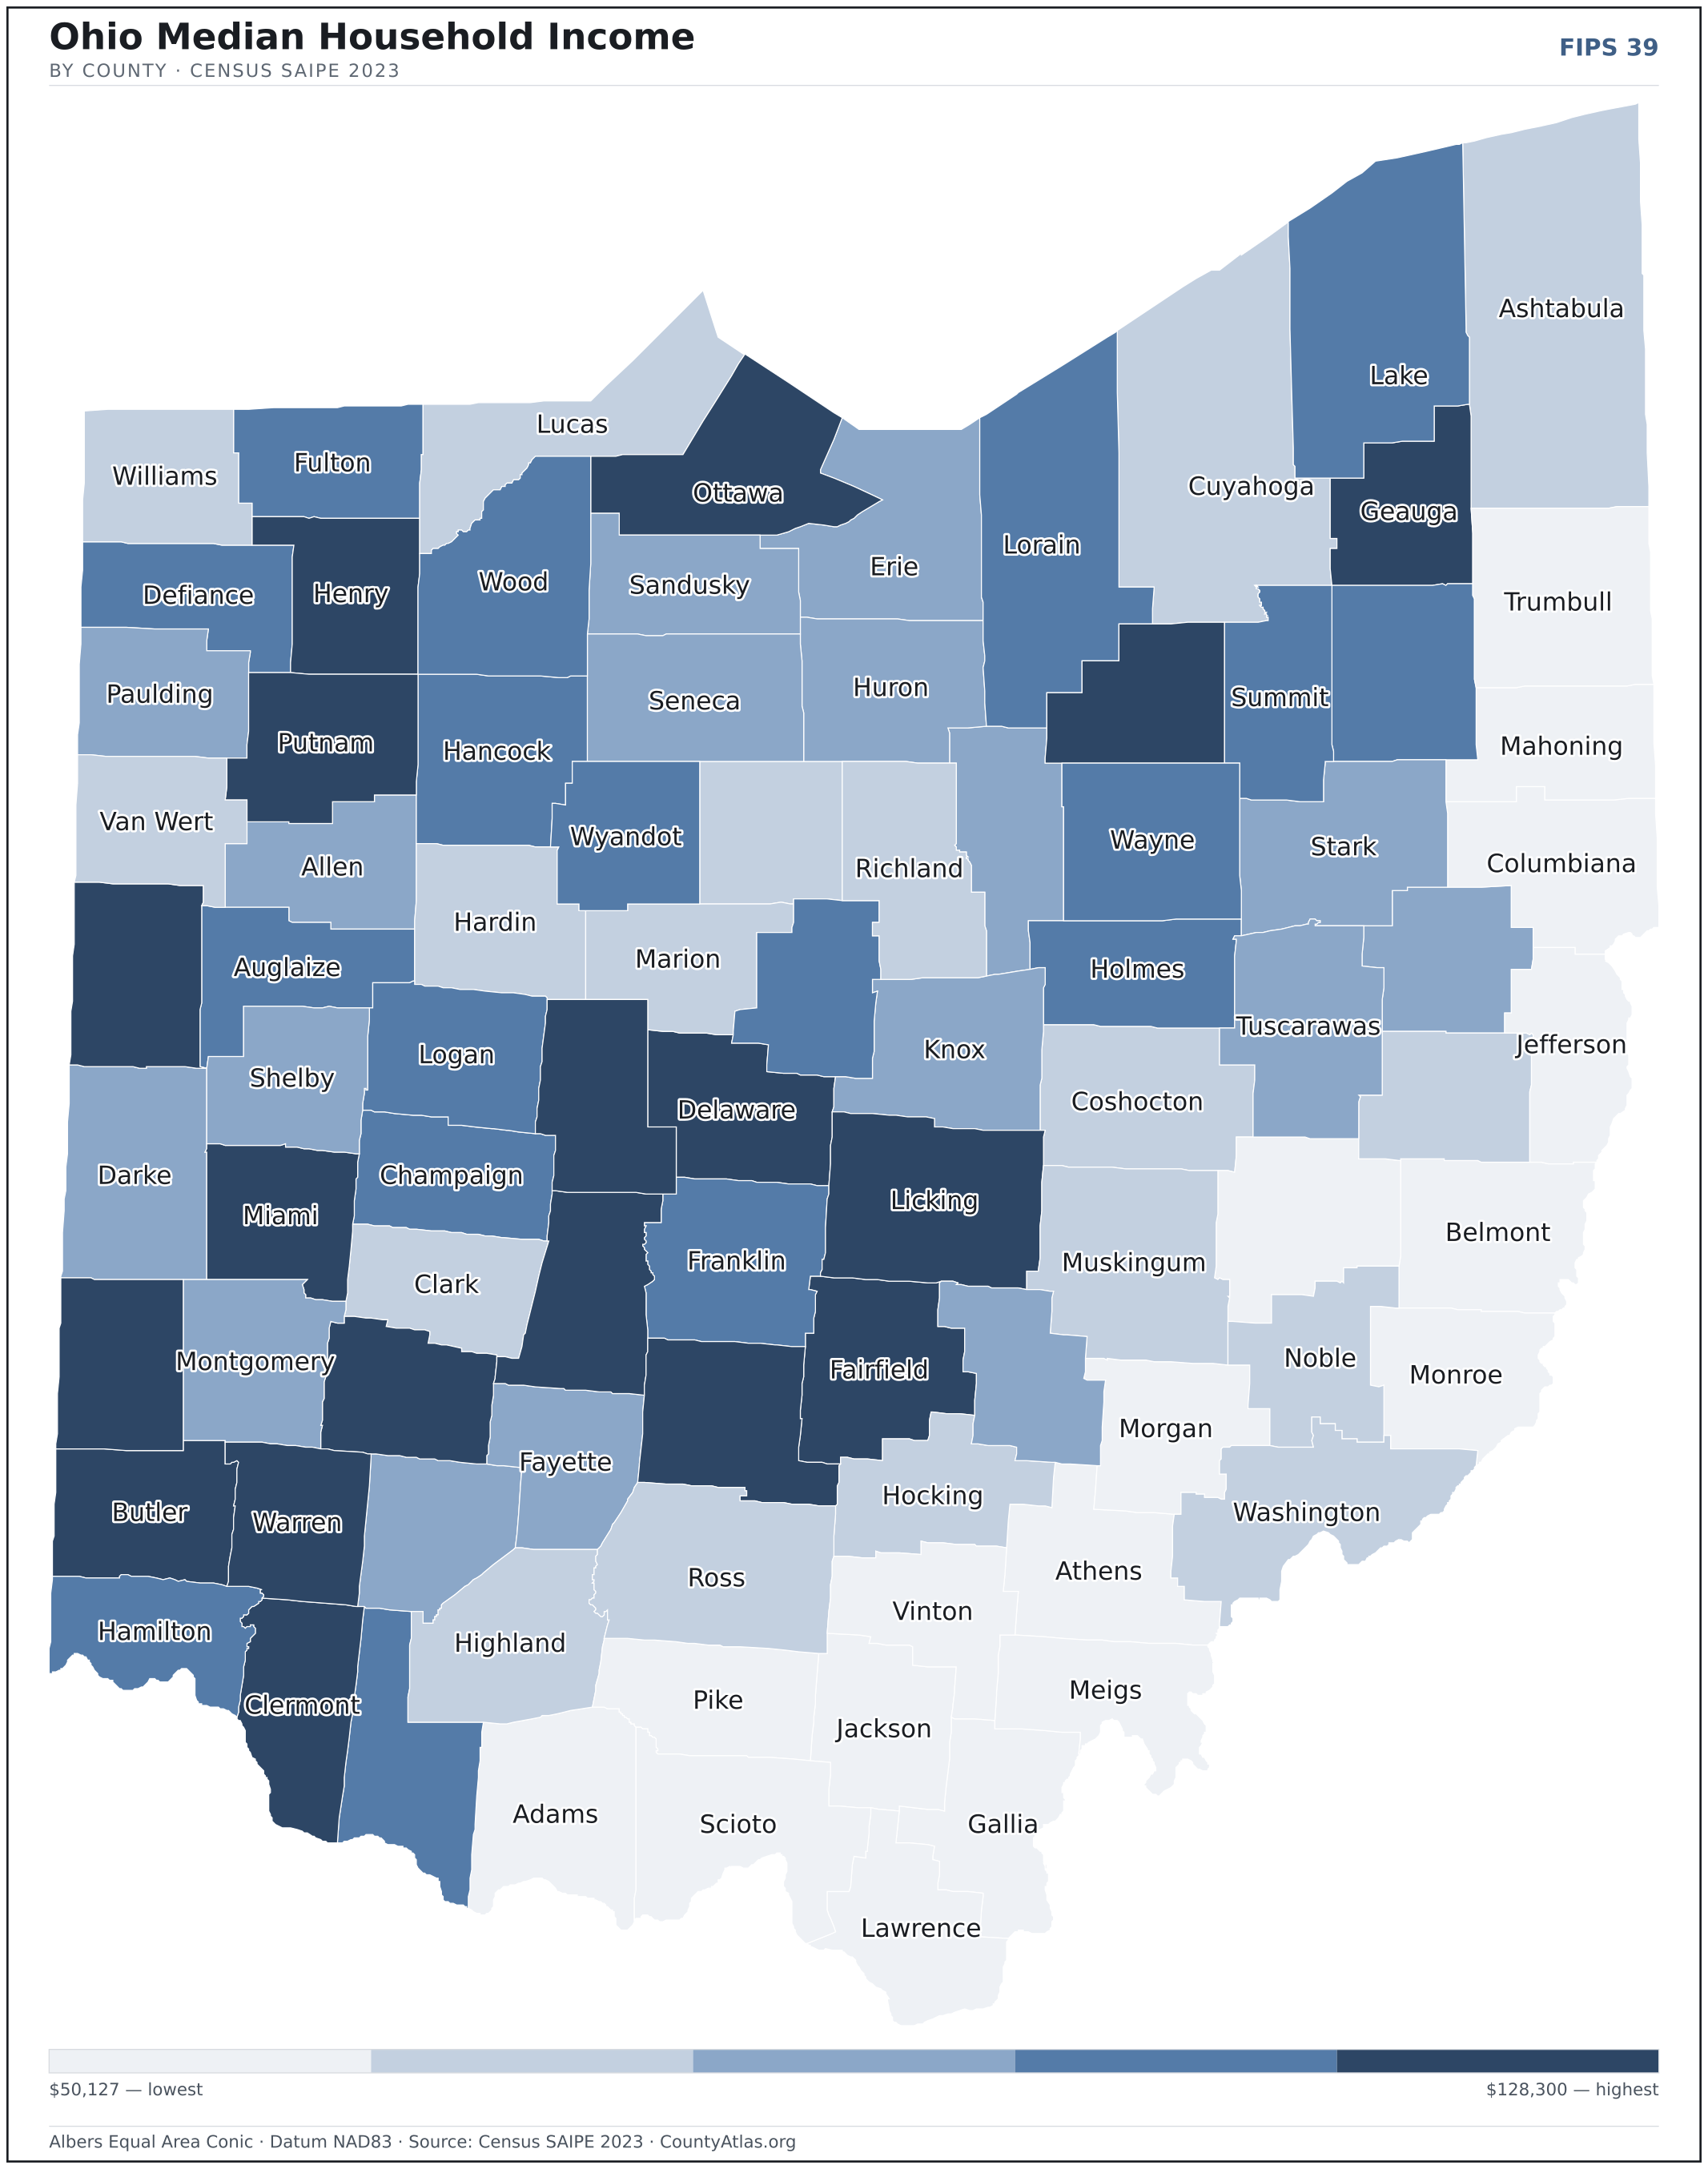
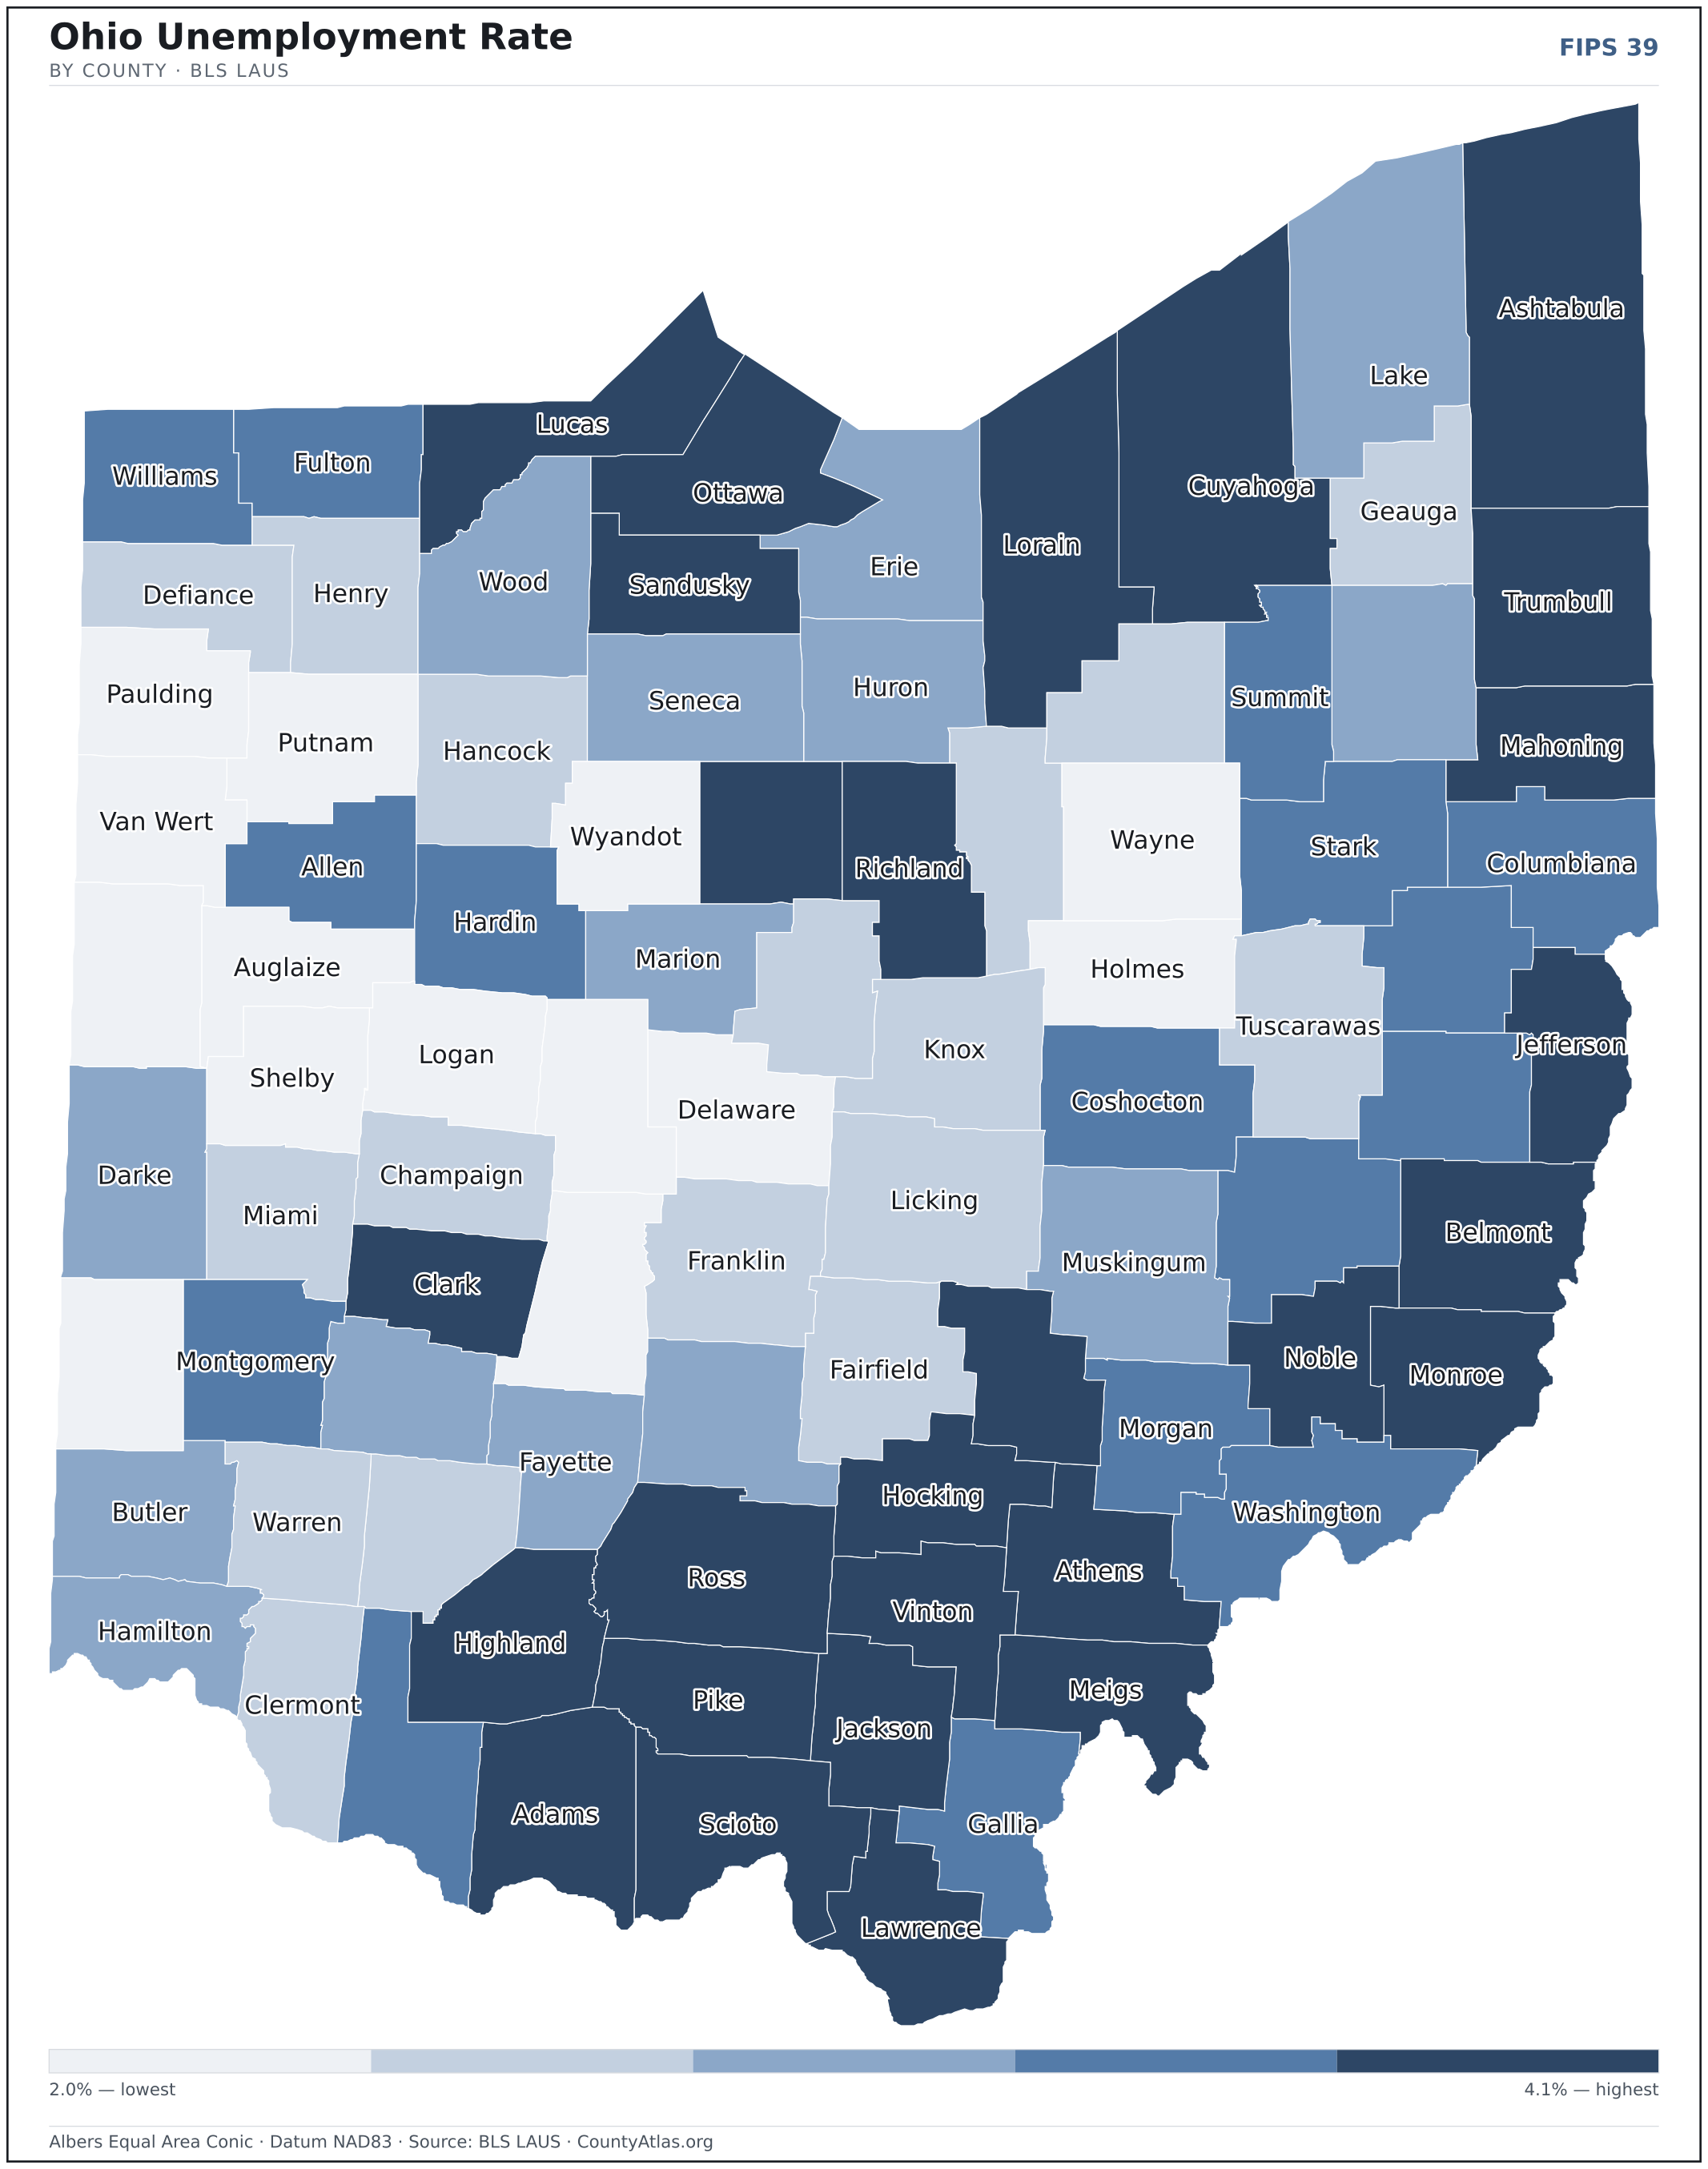
Cities in Ohio
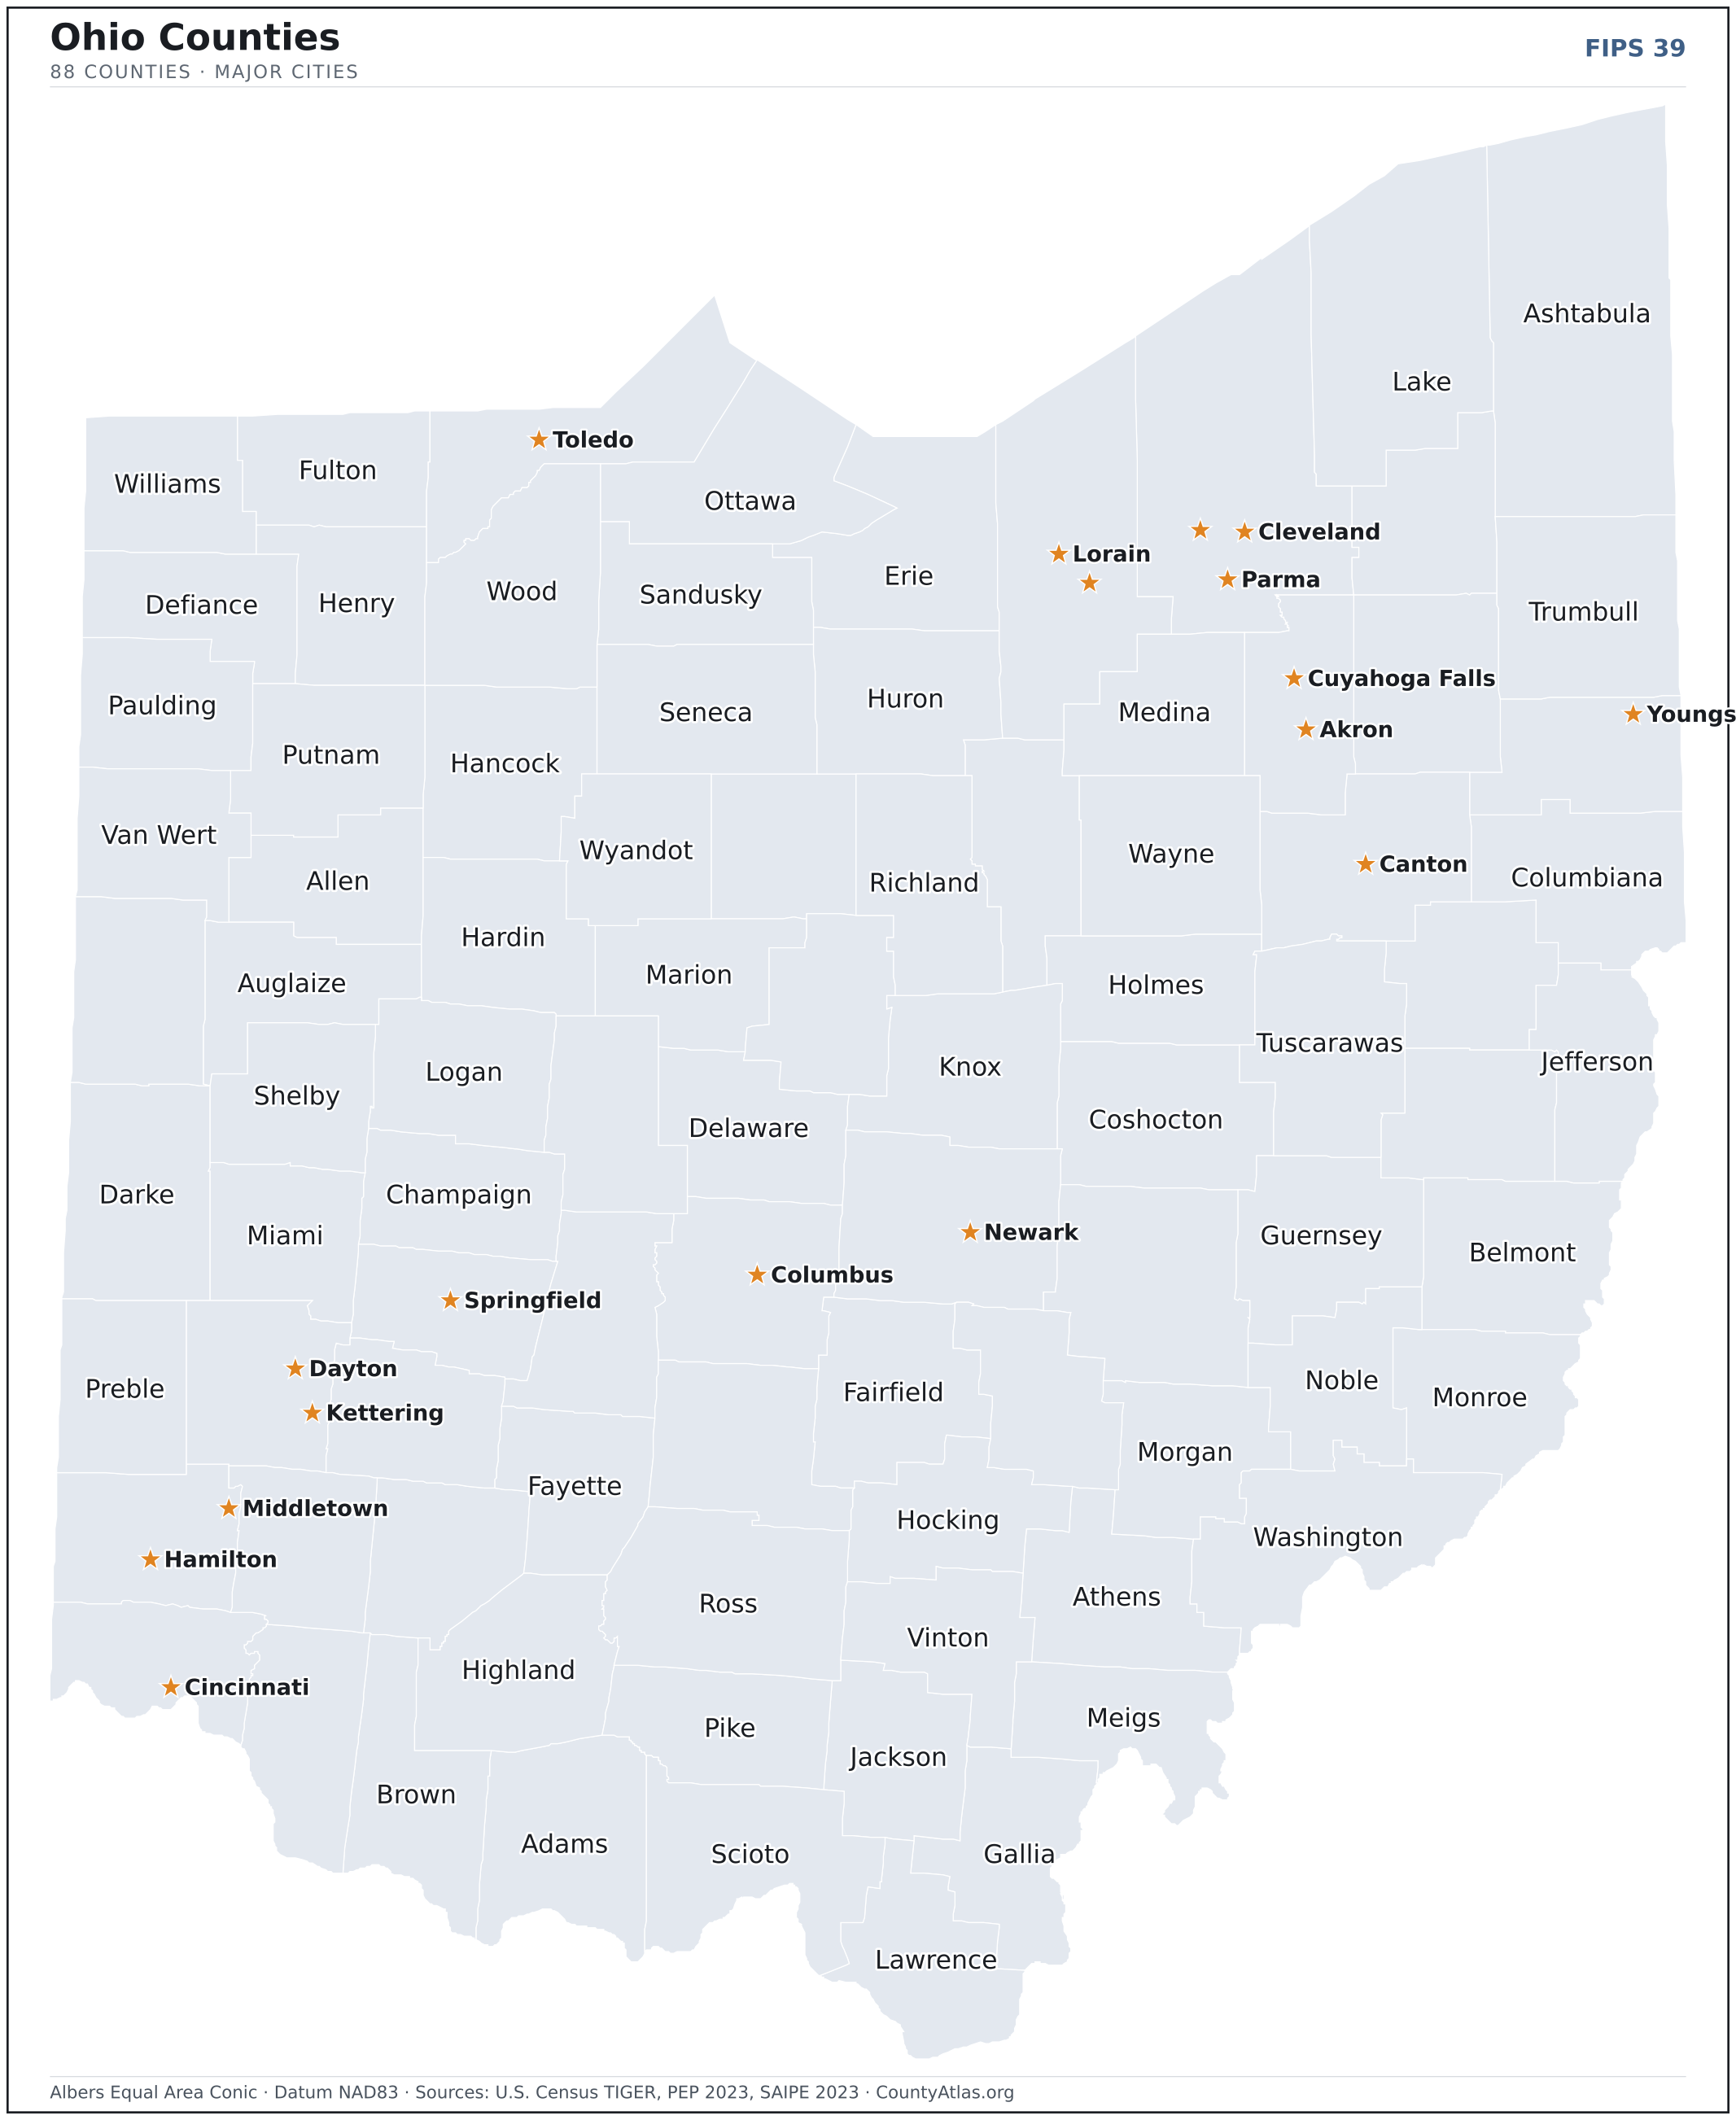
Ohio has 924 incorporated cities and villages. The largest is Columbus in Franklin County with 906,480 residents. Use the search on the map above to find any city and highlight the county it sits in.
| Columbus | Franklin County | 906,480 |
| Cleveland | Cuyahoga County | 367,523 |
| Cincinnati | Hamilton County | 309,595 |
| Toledo | Lucas County | 268,461 |
| Akron | Summit County | 189,526 |
| Dayton | Montgomery County | 136,741 |
| Parma | Cuyahoga County | 80,131 |
| Canton | Stark County | 70,105 |
| Lorain | Lorain County | 65,207 |
| Hamilton | Butler County | 63,124 |
| Youngstown | Mahoning County | 59,605 |
| Springfield | Clark County | 58,410 |
| Kettering | Montgomery County | 57,442 |
| Elyria | Lorain County | 52,833 |
| Cuyahoga Falls | Summit County | 50,864 |
| Middletown | Butler County | 50,607 |
| Newark | Licking County | 50,393 |
| Lakewood | Cuyahoga County | 50,229 |
| Dublin | Franklin County | 49,031 |
| Euclid | Cuyahoga County | 48,991 |
| Mansfield | Richland County | 47,686 |
| Mentor | Lake County | 47,215 |
| Beavercreek | Greene County | 46,787 |
| Strongsville | Cuyahoga County | 46,022 |
| Cleveland Heights | Cuyahoga County | 44,694 |
| Fairfield | Butler County | 44,597 |
| Huber Heights | Montgomery County | 43,266 |
| Delaware | Delaware County | 43,168 |
| Grove City | Franklin County | 41,831 |
| Reynoldsburg | Franklin County | 41,032 |
| Lancaster | Fairfield County | 40,902 |
| Findlay | Hancock County | 40,280 |
| Warren | Trumbull County | 39,057 |
| Westerville | Franklin County | 38,543 |
| Hilliard | Franklin County | 36,560 |
| Upper Arlington | Franklin County | 36,319 |
| North Ridgeville | Lorain County | 36,043 |
| Marion | Marion County | 35,771 |
| Gahanna | Franklin County | 35,438 |
| Lima | Allen County | 35,304 |
| Brunswick | Medina County | 35,284 |
| Mason | Warren County | 35,148 |
| Fairborn | Greene County | 34,506 |
| Stow | Summit County | 34,317 |
| Westlake | Cuyahoga County | 34,036 |
| Massillon | Stark County | 32,177 |
| North Olmsted | Cuyahoga County | 32,031 |
| North Royalton | Cuyahoga County | 31,013 |
| Bowling Green | Wood County | 30,051 |
| Garfield Heights | Cuyahoga County | 29,369 |
Showing the 50 most populous — and 874 more. Search the map above for any Ohio city or village.
A city can span more than one county; each is listed in its primary county — the one its center falls in.
Which Ohio county is the richest, largest, most crowded? The answers
- Ohio’s highest median household income is in Delaware County ($128,300); the lowest is in Meigs County ($50,127). Census SAIPE 2023
- Ohio’s most populous county is Franklin County (1,326,063); the least populous is Vinton County (12,474) — a 106× spread. Census PEP 2023
- Ohio’s largest county by land area is Ashtabula County (702 sq mi); the smallest is Lake County (229 sq mi). Census TIGER
- Ohio’s highest population density is in Cuyahoga County (2,697/sq mi); the lowest is in Monroe County (29/sq mi). Census PEP 2023 · TIGER
- Ohio’s highest poverty rate is in Athens County (25.3%); the lowest is in Delaware County (5.0%). Census SAIPE 2023
- In Ohio, unemployment is highest in Trumbull County (4.1%) and lowest in Holmes County (2.0%), for May 2026. BLS LAUS
- Ohio’s highest median age is in Noble County (51.3); the lowest is in Holmes County (32.5). Census ACS 2019–2023
- Ohio’s highest share of bachelor’s degrees is in Delaware County (58.0% of adults); the lowest is in Monroe County (10.7%). Census ACS 2019–2023
- In Ohio, Stark County borders the most neighbours (8); its interior county lines run 6,112 km in total, land only. Census TIGER, water-clipped
Every figure is a current official estimate from the source named — not a crowd-sourced or copied value. Suppressed estimates (coefficient of variation ≥ 0.30) are omitted, never guessed. See the full methodology.
Ohio counties: common questions
How many counties are in Ohio?
Ohio has 88 counties covering 40,859 sq mi and about 11.8M residents. Every one is on the map above and in the table below.
What is the largest county in Ohio?
It depends on the measure. By land area it’s Ashtabula County (702 sq mi); by population it’s Franklin County (1,326,063 residents).
What county is Columbus in?
Columbus (population 906,480) is in Franklin County. Use the search on the map to find any Ohio city’s county.
What is the richest county in Ohio?
By median household income, Delaware County is the richest at $128,300; the poorest is Meigs County at $50,127 (Census SAIPE 2023).
What is the most populous county in Ohio?
Franklin County, with 1,326,063 residents — about 11.3% of Ohio’s people, and 106× the least populous, Vinton County (12,474).
Sources & vintages
- Population — PEP Vintage 2023 (July 1, 2023) — pep/charv
- Median household income & poverty — SAIPE 2023
- Unemployment — BLS LAUS May 2026 (preliminary)
- Geometry & boundaries — Census TIGERweb
- Cities & city population — Census TIGERweb Incorporated Places + ACS 5-year 2019–2023
Data current through .