CountyAtlas Oklahoma
Oklahoma County Map with Cities — All 77 Counties
All 77 of Oklahoma's counties, mapped from official U.S. Census boundaries with population, income, and unemployment for every one. Colour the map by any measure, tap a county for its data, or download a print-ready copy.
Tap any county for its population, income, and more.
Oklahoma at a glance
- Scale. Oklahoma is divided into 77 counties across 68,597 sq mi of land — an average of 891 sq mi each. Census TIGER
- People. Its counties are home to 4,053,824 residents — an average of 52,647 each, or 59 per square mile statewide. Census PEP 2023
- Water. Another 1,302 sq mi is water — 1.9% of the state’s area, led by McIntosh County. Census TIGER
Oklahoma’s 77 counties, by the numbers
Every county’s population, median household income, unemployment, density, and land area — sortable by any column, so you can find yours or rank by what matters to you. A few patterns run through the data:
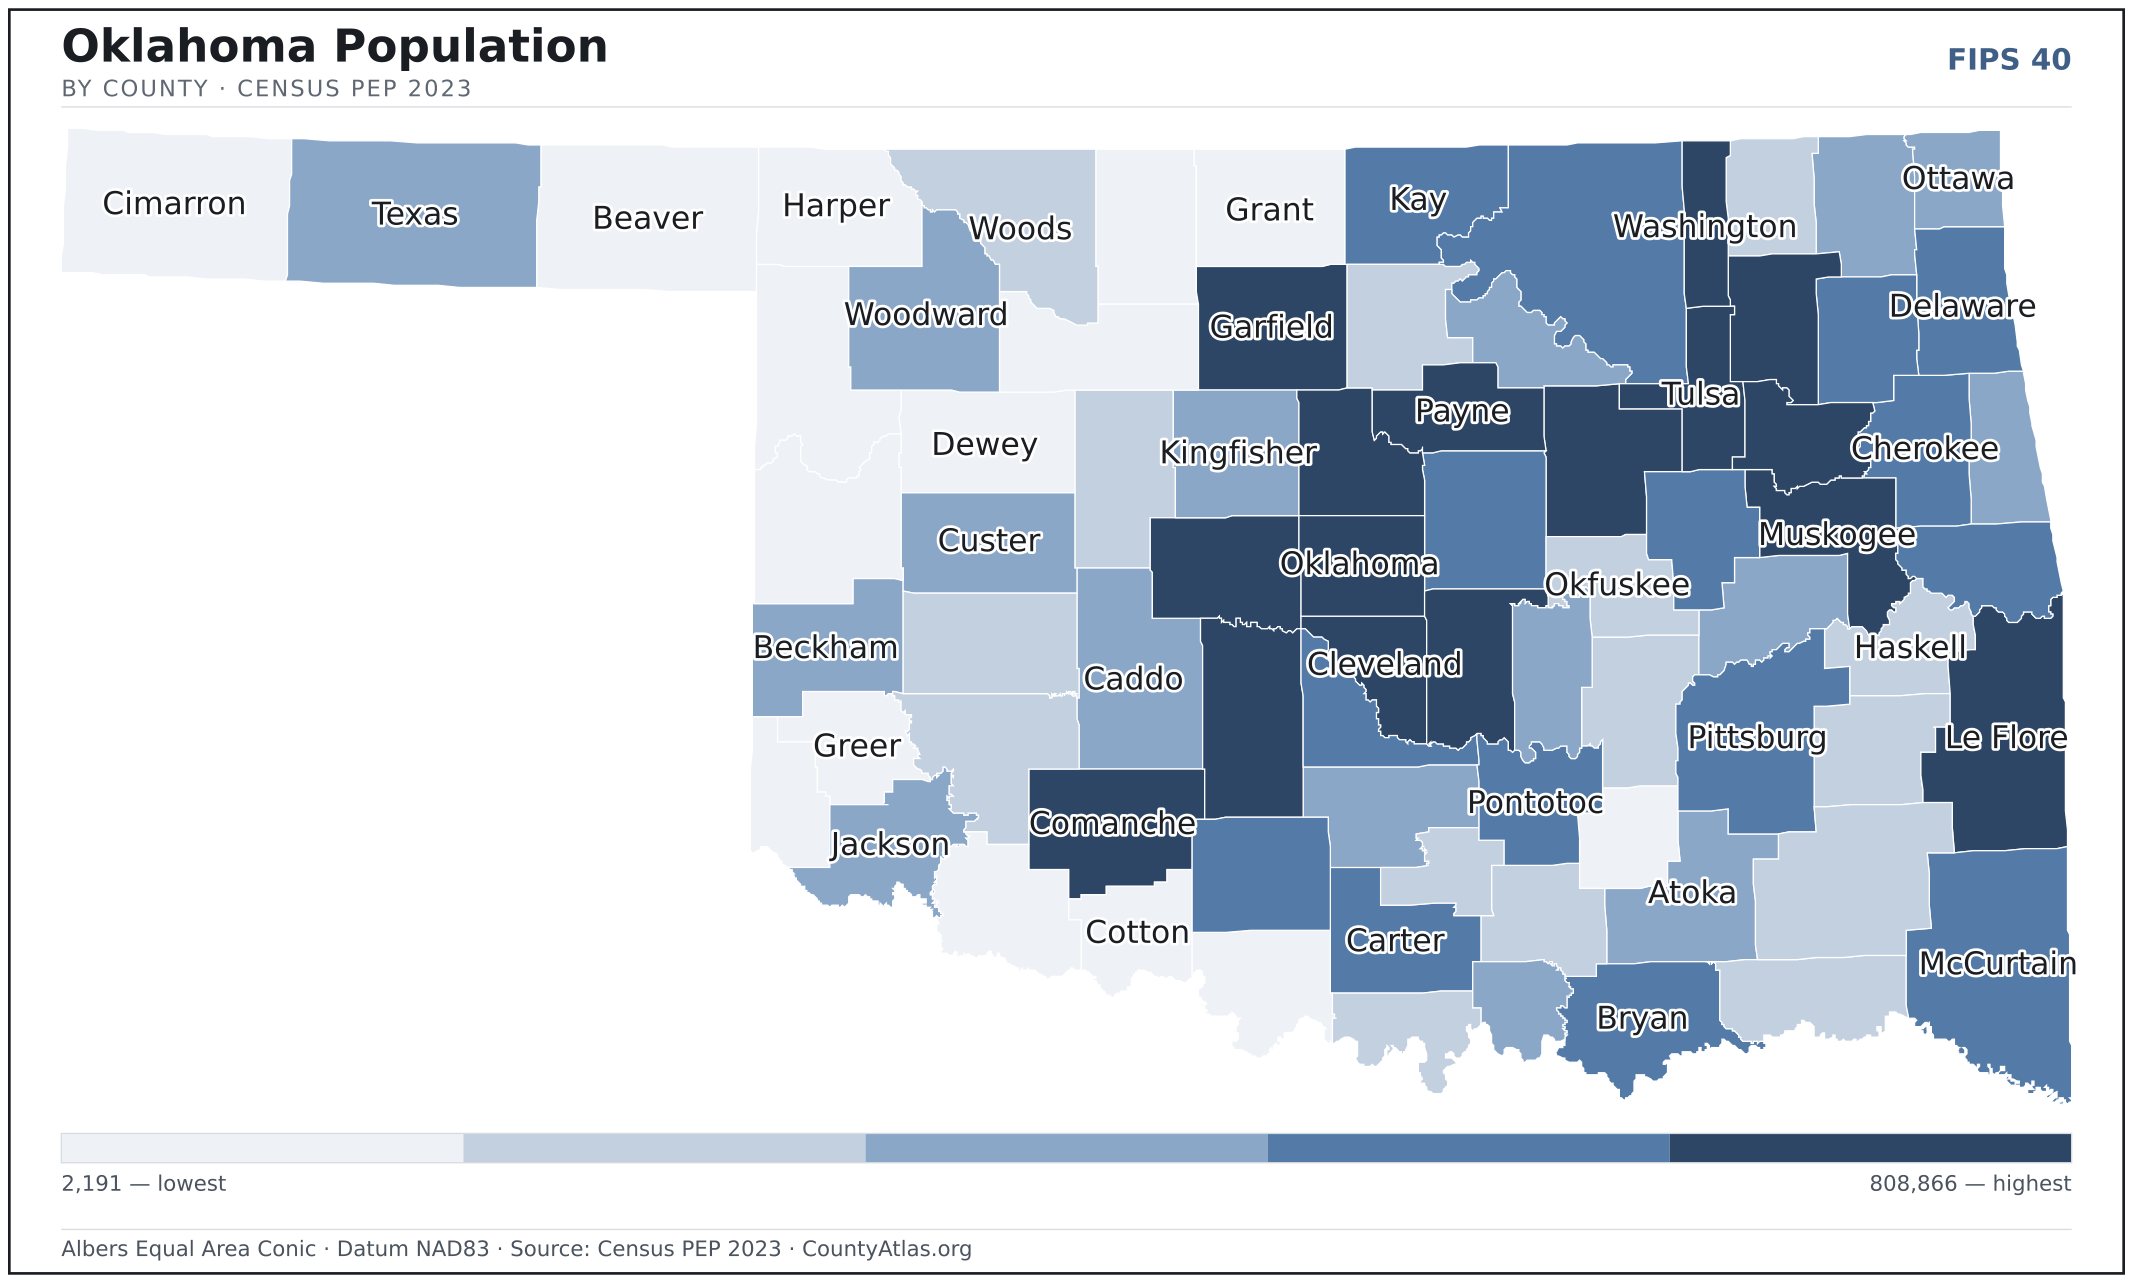
- Concentrated. Half of Oklahoma’s 4,053,824 residents live in just 5 of 77 counties, and the five largest hold 51.6% of the total. Census PEP 2023
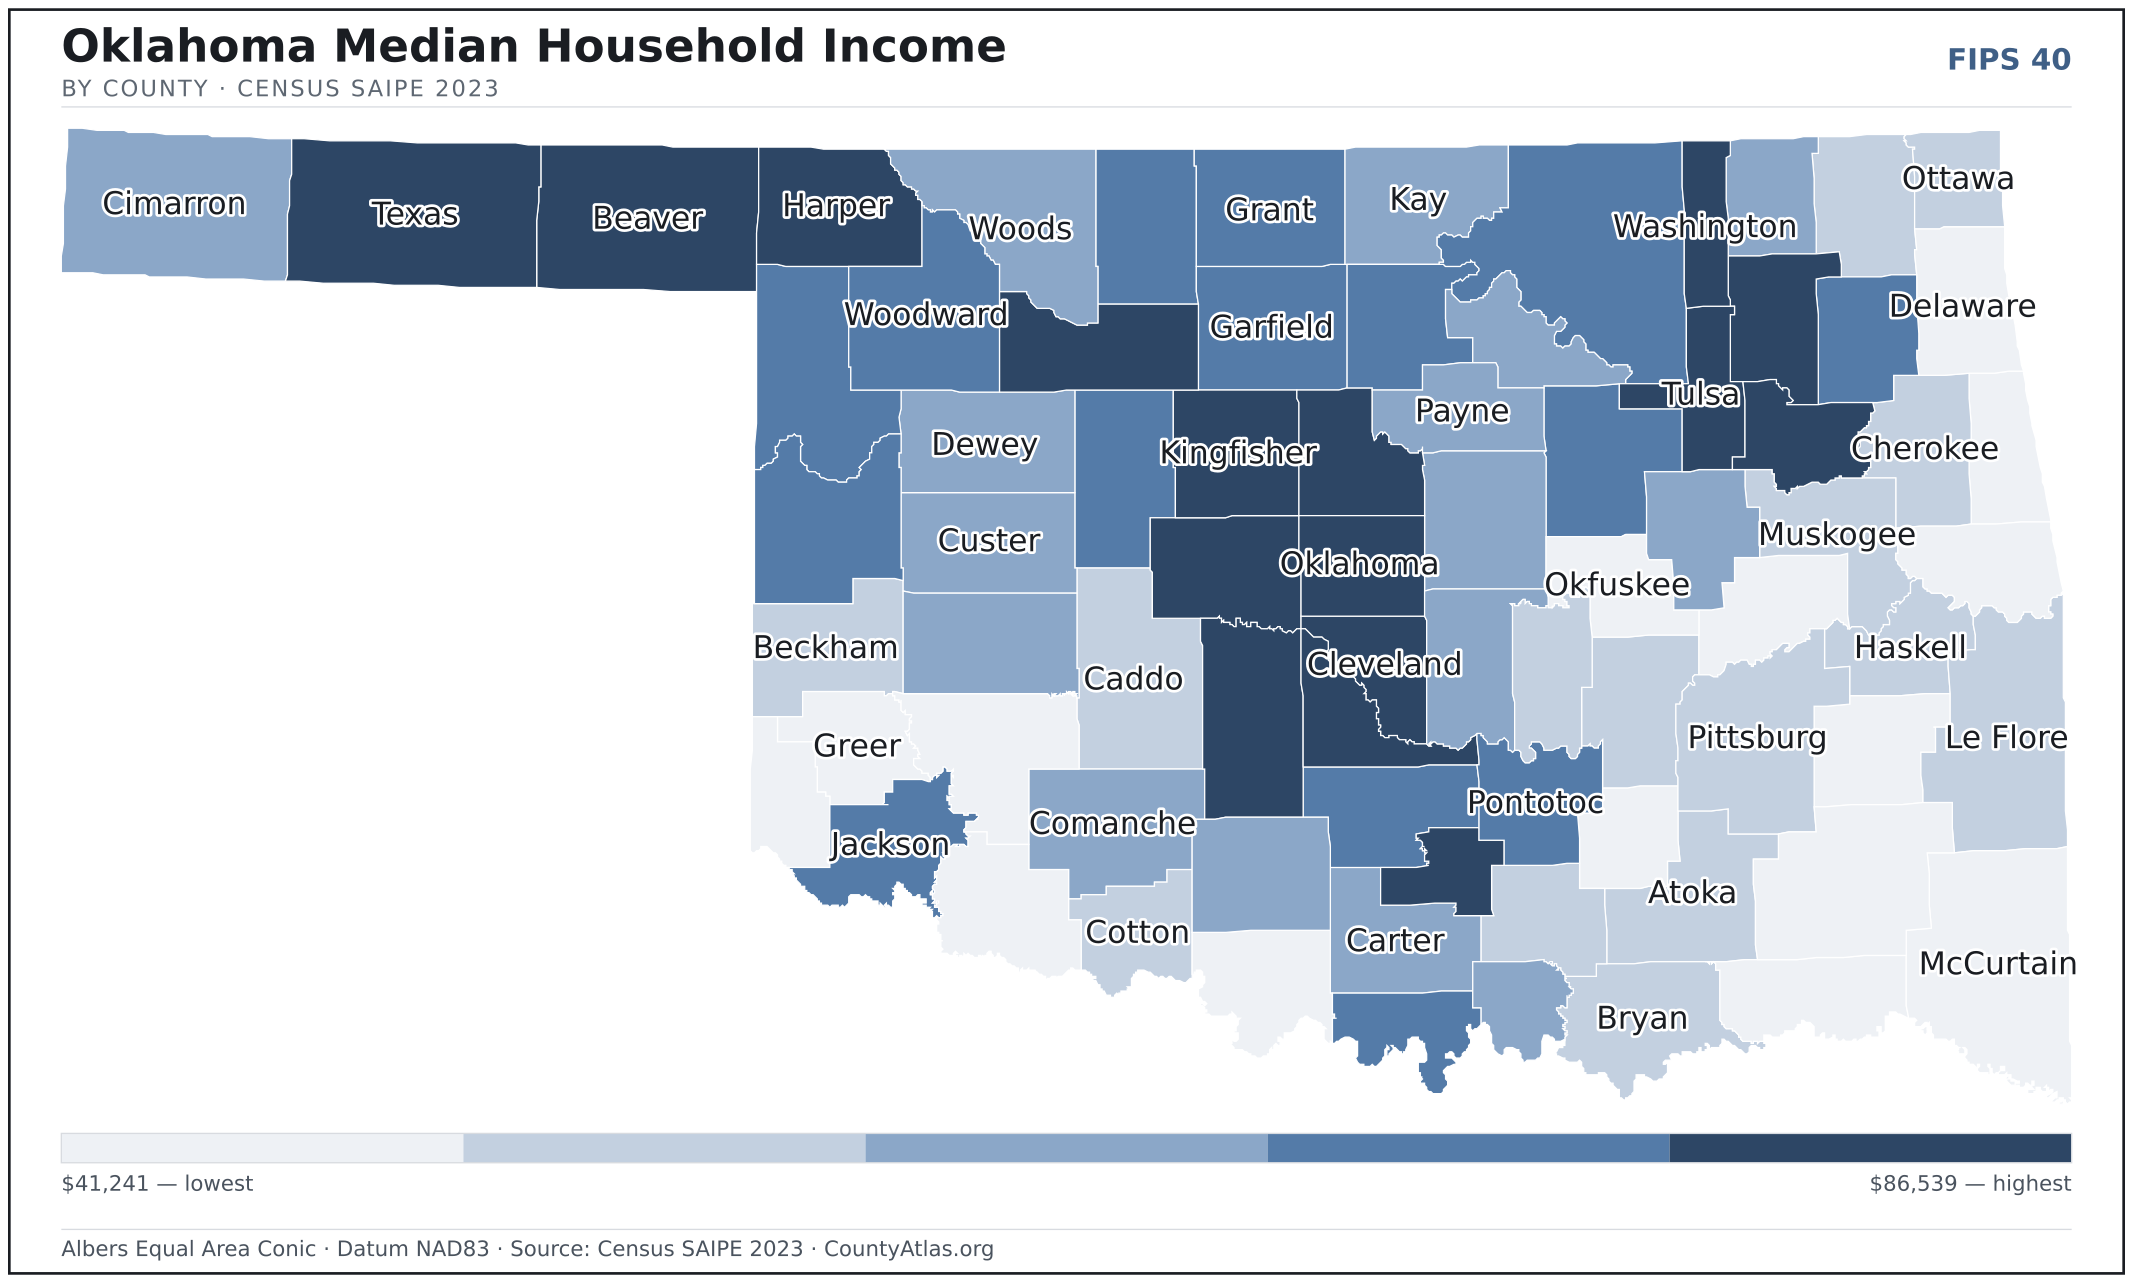
- Income tracks poverty. The gap from richest to poorest runs 2.1×, and the 10 highest-income counties average 11.2% in poverty against 23.5% for the 10 lowest. Census SAIPE 2023
- Mostly small. Half of Oklahoma’s counties have fewer than 20,371 residents, and half report a median household income below $56,166 — a few metros lift the statewide totals well above both. Census PEP 2023 · SAIPE 2023
- Lopsided density. Only 19 of 77 counties are denser than Oklahoma’s statewide average of 59 people per square mile — the rest are more rural. Census PEP 2023 · TIGER
| Adair County | 19,627 | $44,808 | 5.2% | 34/sq mi | 574 sq mi | Stilwell |
| Alfalfa County | 5,673 | $57,517 | 3.6% | 7/sq mi | 867 sq mi | Cherokee |
| Atoka County | 14,525 | $49,815 | 4.6% | 15/sq mi | 975 sq mi | Atoka |
| Beaver County | 5,018 | $67,112 | 3.7% | 3/sq mi | 1,815 sq mi | Beaver |
| Beckham County | 22,042 | $51,960 | 4.4% | 24/sq mi | 902 sq mi | Sayre |
| Blaine County | 8,539 | $58,573 | 4.2% | 9/sq mi | 928 sq mi | Watonga |
| Bryan County | 48,967 | $50,105 | 4.4% | 54/sq mi | 904 sq mi | Durant |
| Caddo County | 26,214 | $50,742 | 4.1% | 21/sq mi | 1,278 sq mi | Anadarko |
| Canadian County | 175,829 | $86,539 | 3.9% | 196/sq mi | 897 sq mi | El Reno |
| Carter County | 48,596 | $56,270 | 6.2% | 59/sq mi | 822 sq mi | Ardmore |
| Cherokee County | 48,185 | $50,434 | 4.4% | 64/sq mi | 749 sq mi | Tahlequah |
| Choctaw County | 14,276 | $44,307 | 4.1% | 19/sq mi | 770 sq mi | Hugo |
| Cimarron County | 2,191 | $56,166 | 3.1% | 1/sq mi | 1,835 sq mi | Boise City |
| Cleveland County | 301,193 | $74,889 | 4.0% | 559/sq mi | 539 sq mi | Norman |
| Coal County | 5,266 | $46,921 | 5.4% | 10/sq mi | 517 sq mi | Coalgate |
| Comanche County | 121,574 | $56,973 | 4.9% | 114/sq mi | 1,069 sq mi | Lawton |
| Cotton County | 5,427 | $52,735 | 4.0% | 9/sq mi | 633 sq mi | Walters |
| Craig County | 14,494 | $49,914 | 4.7% | 19/sq mi | 761 sq mi | Vinita |
| Creek County | 73,332 | $58,195 | 4.6% | 77/sq mi | 950 sq mi | Sapulpa |
| Custer County | 28,266 | $55,458 | 3.6% | 29/sq mi | 989 sq mi | Arapaho |
| Delaware County | 41,703 | $48,763 | 4.6% | 57/sq mi | 738 sq mi | Jay |
| Dewey County | 4,286 | $55,952 | 2.6% | 4/sq mi | 1,000 sq mi | Taloga |
| Ellis County | 3,648 | $57,212 | 3.5% | 3/sq mi | 1,231 sq mi | Arnett |
| Garfield County | 62,023 | $61,132 | 4.1% | 59/sq mi | 1,059 sq mi | Enid |
| Garvin County | 25,865 | $57,170 | 4.8% | 32/sq mi | 802 sq mi | Pauls Valley |
| Grady County | 57,375 | $70,838 | 4.3% | 52/sq mi | 1,101 sq mi | Chickasha |
| Grant County | 4,083 | $57,737 | 3.5% | 4/sq mi | 1,001 sq mi | Medford |
| Greer County | 5,466 | $43,089 | 4.7% | 9/sq mi | 639 sq mi | Mangum |
| Harmon County | 2,392 | $45,931 | 3.2% | 4/sq mi | 537 sq mi | Hollis |
| Harper County | 3,190 | $62,950 | 3.2% | 3/sq mi | 1,039 sq mi | Buffalo |
| Haskell County | 11,832 | $49,471 | 5.4% | 21/sq mi | 577 sq mi | Stigler |
| Hughes County | 13,436 | $50,872 | 6.4% | 17/sq mi | 804 sq mi | Holdenville |
| Jackson County | 24,669 | $58,371 | 3.8% | 31/sq mi | 803 sq mi | Altus |
| Jefferson County | 5,347 | $43,298 | 5.9% | 7/sq mi | 759 sq mi | Waurika |
| Johnston County | 10,216 | $49,984 | 6.2% | 16/sq mi | 643 sq mi | Tishomingo |
| Kay County | 43,641 | $55,440 | 4.5% | 47/sq mi | 920 sq mi | Newkirk |
| Kingfisher County | 15,481 | $72,345 | 3.4% | 17/sq mi | 898 sq mi | Kingfisher |
| Kiowa County | 8,398 | $44,393 | 4.3% | 8/sq mi | 1,015 sq mi | Hobart |
| Latimer County | 9,526 | $41,241 | 4.9% | 13/sq mi | 722 sq mi | Wilburton |
| Le Flore County | 49,596 | $50,469 | 5.0% | 31/sq mi | 1,589 sq mi | Poteau |
| Lincoln County | 34,562 | $56,344 | 4.4% | 36/sq mi | 952 sq mi | Chandler |
| Logan County | 53,029 | $77,836 | 4.4% | 71/sq mi | 744 sq mi | Guthrie |
| Love County | 10,296 | $58,771 | 7.0% | 20/sq mi | 514 sq mi | Marietta |
| Major County | 7,581 | $64,527 | 3.9% | 8/sq mi | 955 sq mi | Fairview |
| Marshall County | 15,970 | $54,966 | 4.9% | 43/sq mi | 371 sq mi | Madill |
| Mayes County | 39,889 | $59,498 | 4.2% | 61/sq mi | 655 sq mi | Pryor Creek |
| McClain County | 47,072 | $80,952 | 3.8% | 82/sq mi | 571 sq mi | Purcell |
| McCurtain County | 30,660 | $48,589 | 4.8% | 17/sq mi | 1,851 sq mi | Idabel |
| McIntosh County | 19,603 | $46,509 | 6.1% | 32/sq mi | 618 sq mi | Eufaula |
| Murray County | 13,754 | $63,623 | 4.8% | 33/sq mi | 416 sq mi | Sulphur |
| Muskogee County | 66,677 | $52,188 | 5.7% | 82/sq mi | 811 sq mi | Muskogee |
| Noble County | 10,832 | $60,758 | 3.7% | 15/sq mi | 732 sq mi | Perry |
| Nowata County | 9,438 | $54,831 | 4.7% | 17/sq mi | 566 sq mi | Nowata |
| Okfuskee County | 11,300 | $44,661 | 5.3% | 18/sq mi | 618 sq mi | Okemah |
| Oklahoma County | 808,866 | $65,979 | 4.4% | 1,141/sq mi | 709 sq mi | Oklahoma City |
| Okmulgee County | 37,035 | $53,938 | 5.5% | 53/sq mi | 697 sq mi | Okmulgee |
| Osage County | 46,130 | $61,279 | 5.0% | 21/sq mi | 2,247 sq mi | Pawhuska |
| Ottawa County | 30,287 | $48,937 | 4.7% | 64/sq mi | 471 sq mi | Miami |
| Pawnee County | 15,864 | $52,744 | 5.2% | 28/sq mi | 568 sq mi | Pawnee |
| Payne County | 83,352 | $56,811 | 4.4% | 122/sq mi | 685 sq mi | Stillwater |
| Pittsburg County | 43,479 | $51,514 | 5.5% | 33/sq mi | 1,306 sq mi | McAlester |
| Pontotoc County | 38,396 | $61,269 | 3.9% | 53/sq mi | 720 sq mi | Ada |
| Pottawatomie County | 73,791 | $57,089 | 5.0% | 94/sq mi | 788 sq mi | Shawnee |
| Pushmataha County | 10,800 | $45,012 | 5.4% | 8/sq mi | 1,396 sq mi | Antlers |
| Roger Mills County | 3,295 | $57,132 | 3.8% | 3/sq mi | 1,141 sq mi | Cheyenne |
| Rogers County | 100,248 | $73,688 | 4.1% | 148/sq mi | 676 sq mi | Claremore |
| Seminole County | 23,565 | $49,000 | 5.8% | 37/sq mi | 633 sq mi | Wewoka |
| Sequoyah County | 40,291 | $48,050 | 5.3% | 60/sq mi | 674 sq mi | Sallisaw |
| Stephens County | 44,014 | $56,649 | 5.0% | 51/sq mi | 870 sq mi | Duncan |
| Texas County | 20,371 | $67,901 | 2.8% | 10/sq mi | 2,041 sq mi | Guymon |
| Tillman County | 6,869 | $46,314 | 4.9% | 8/sq mi | 871 sq mi | Frederick |
| Tulsa County | 682,868 | $65,619 | 4.5% | 1,198/sq mi | 570 sq mi | Tulsa |
| Wagoner County | 89,280 | $80,246 | 4.3% | 159/sq mi | 562 sq mi | Wagoner |
| Washington County | 53,706 | $66,236 | 5.1% | 129/sq mi | 416 sq mi | Bartlesville |
| Washita County | 10,736 | $54,874 | 3.5% | 11/sq mi | 1,003 sq mi | New Cordell |
| Woods County | 8,564 | $56,740 | 3.7% | 7/sq mi | 1,286 sq mi | Alva |
| Woodward County | 19,947 | $59,312 | 3.9% | 16/sq mi | 1,243 sq mi | Woodward |
All 77 counties, sortable by any column — click a heading. A suppressed estimate (coefficient of variation ≥ 0.30) shows a marker, never a guess. County seats are from Wikidata (CC0), each validated to a Census place inside its county; a county with no validated seat is left blank. See the methodology.
Download & print this Oklahoma map
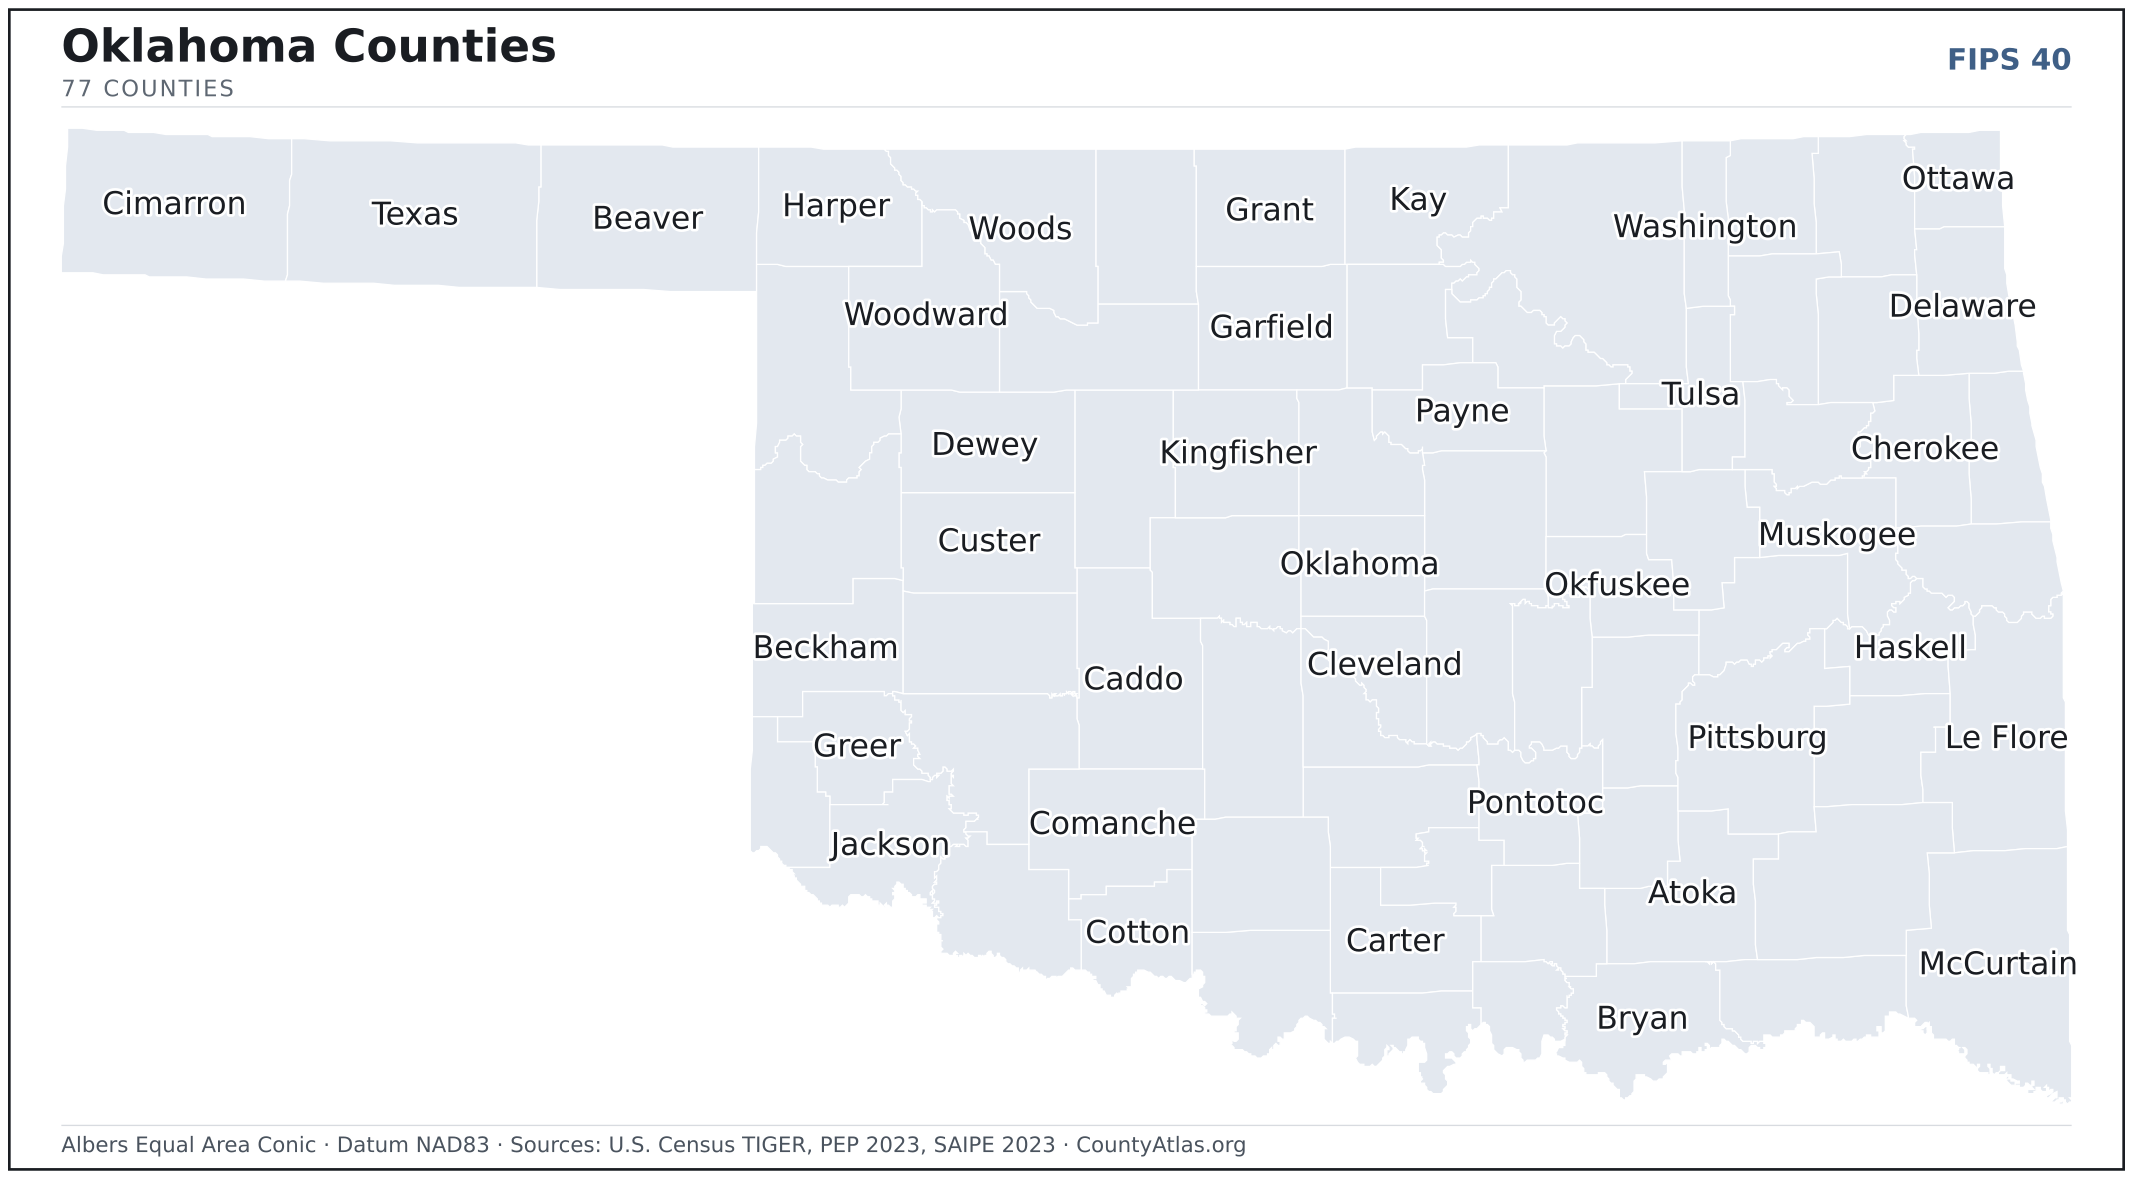
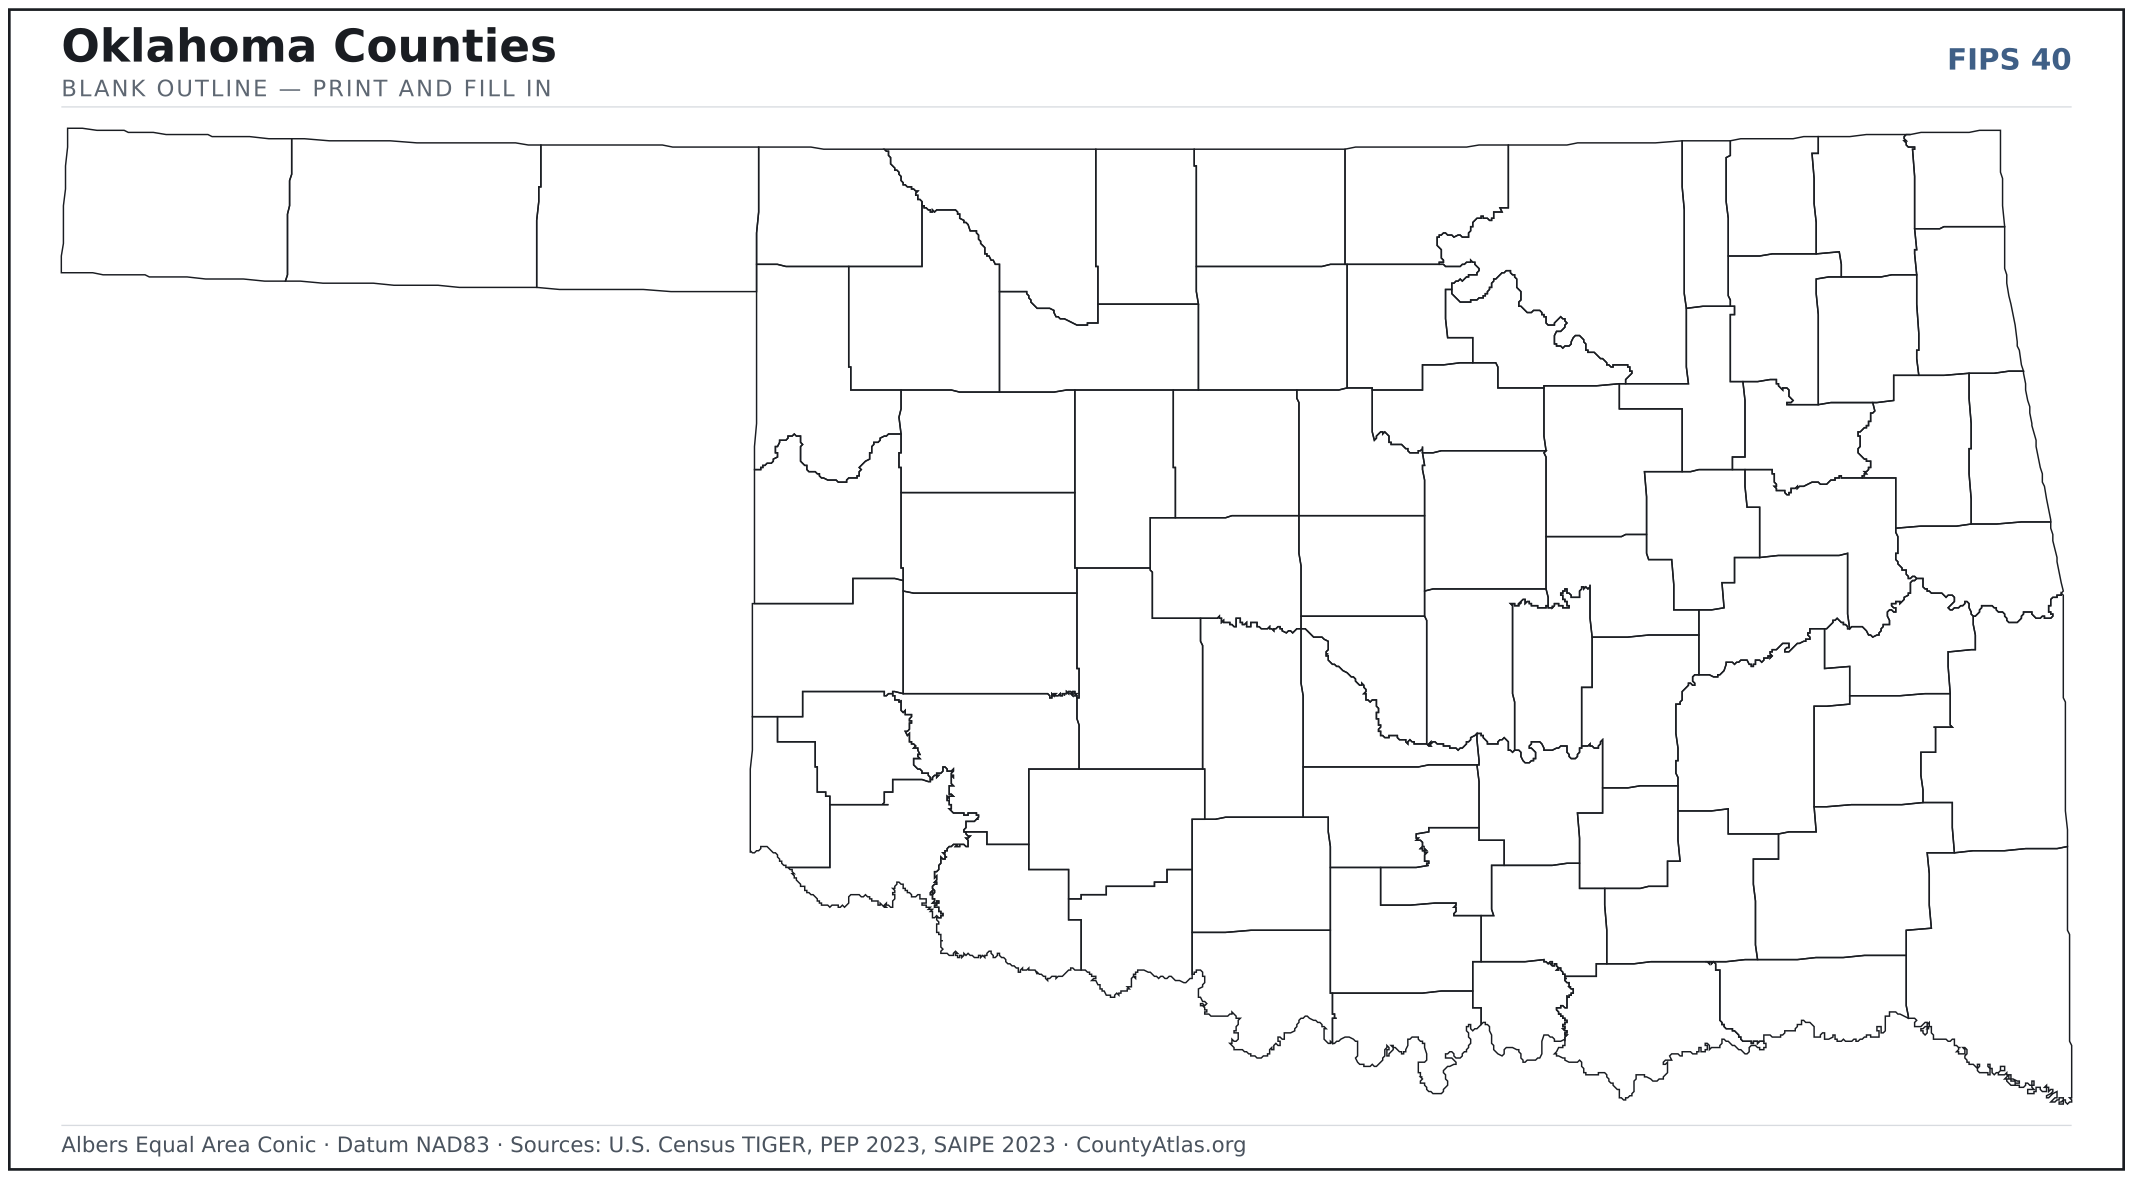
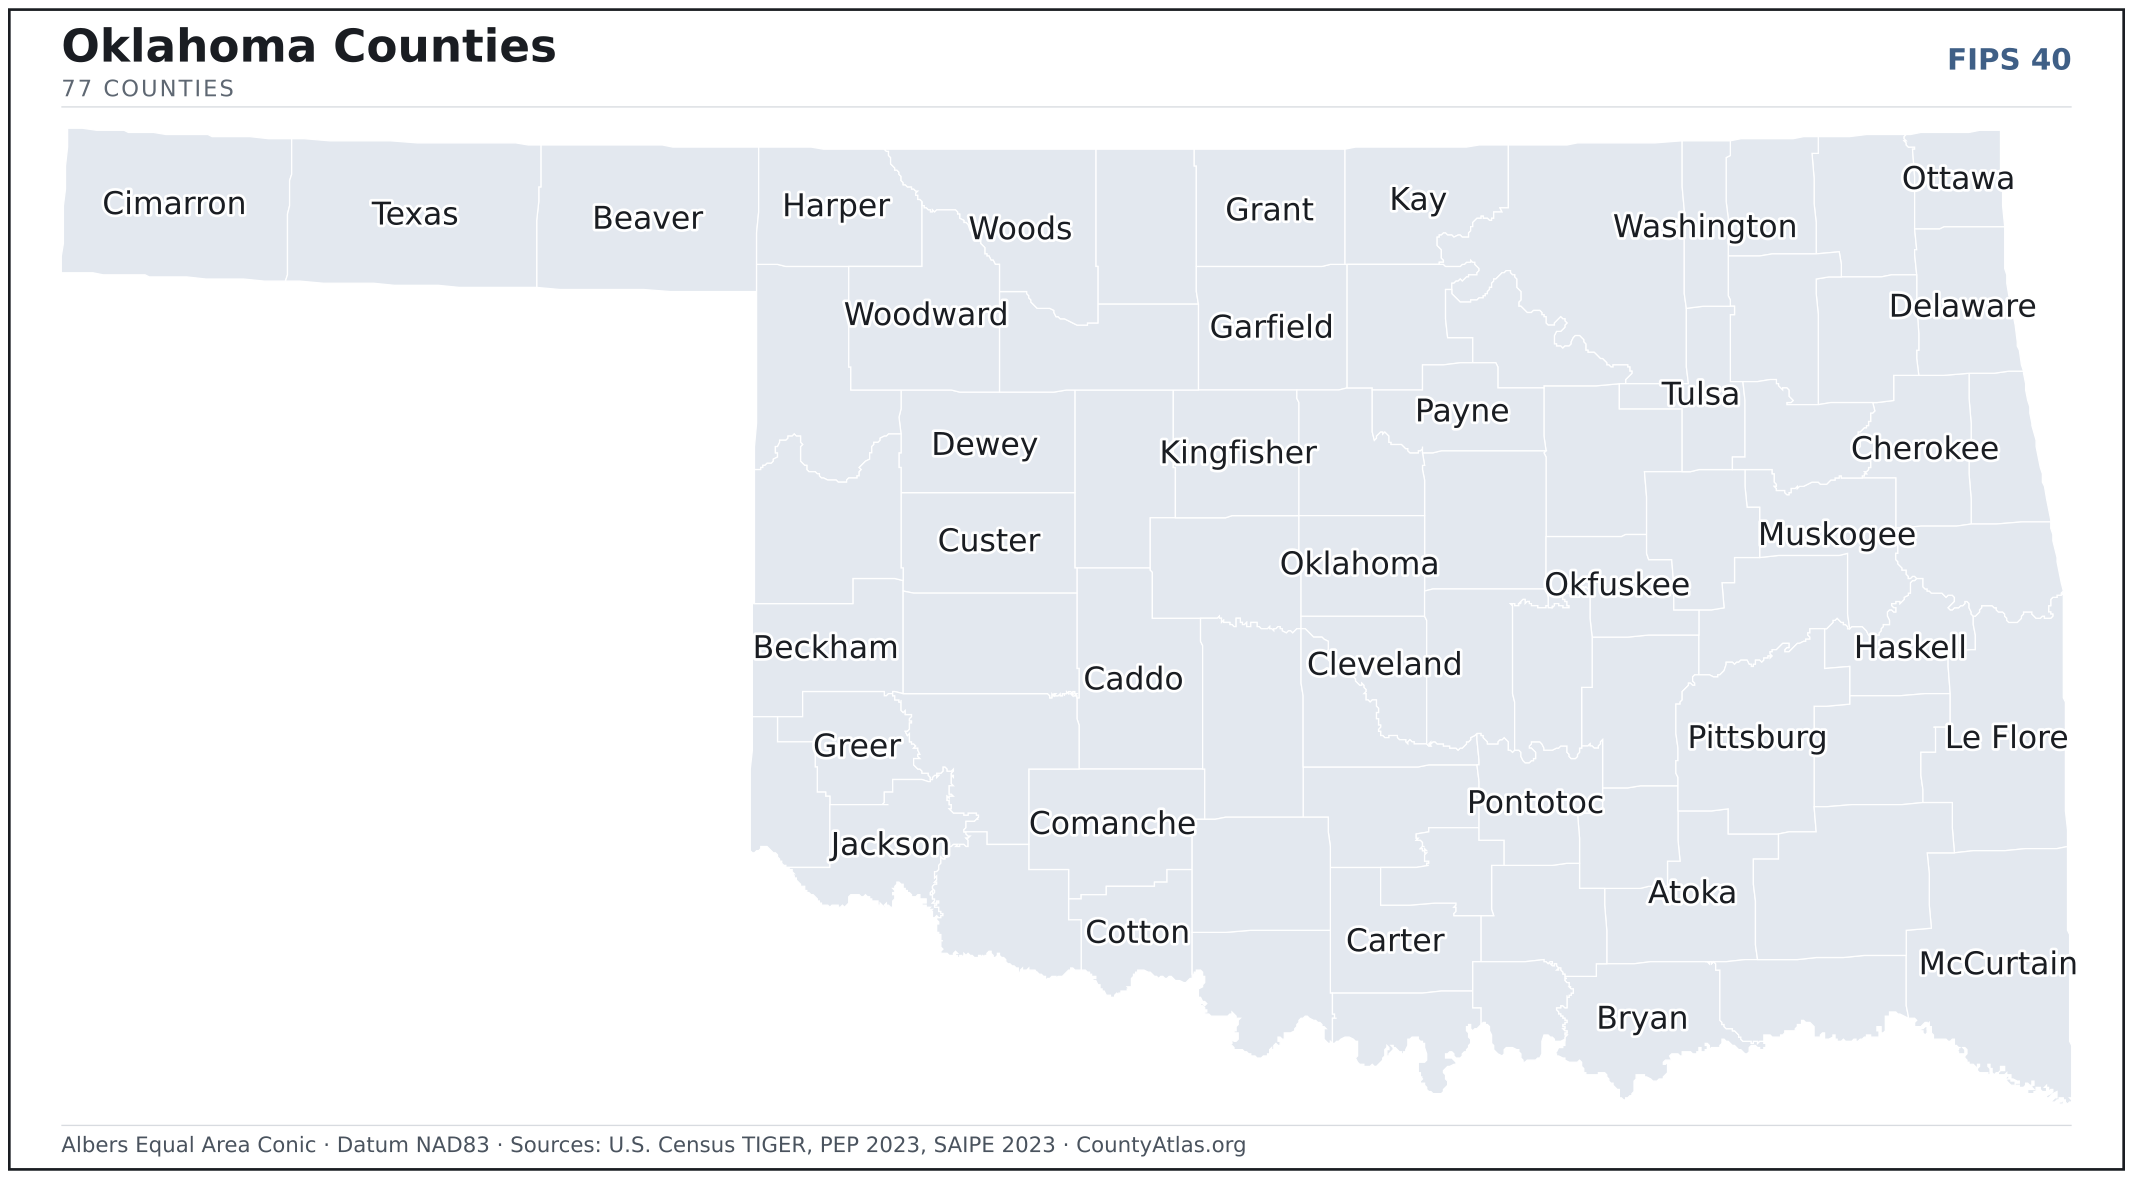
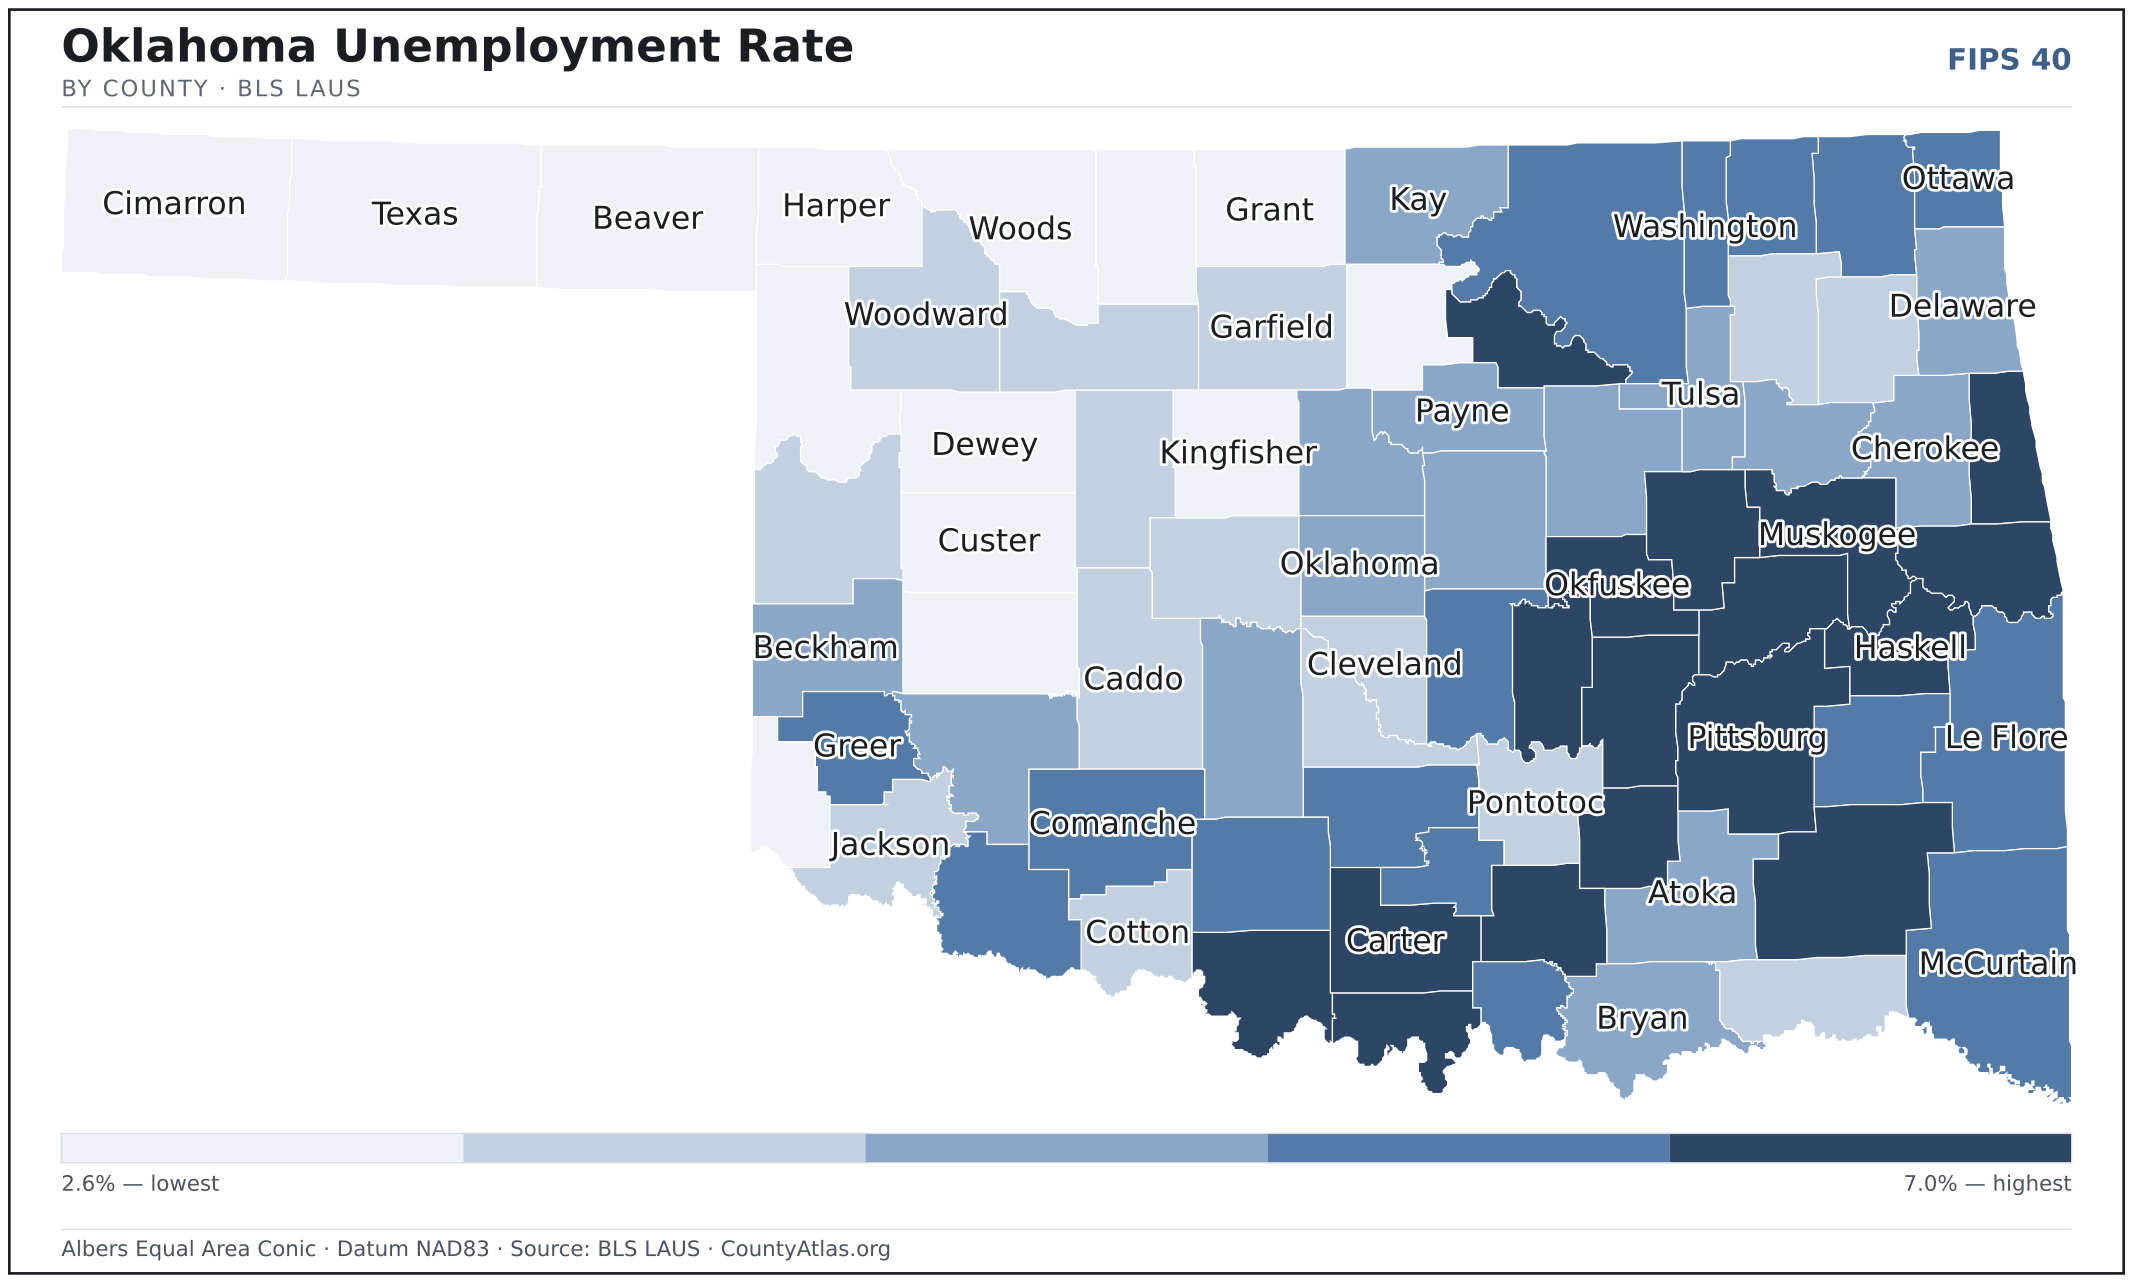
Oklahoma maps, coloured by the data
Cities in Oklahoma
Oklahoma has 600 incorporated cities and towns. The largest is Oklahoma City in Oklahoma County with 688,693 residents. Use the search on the map above to find any city and highlight the county it sits in.
| Oklahoma City | Oklahoma County | 688,693 |
| Tulsa | Tulsa County | 412,322 |
| Norman | Cleveland County | 128,714 |
| Broken Arrow | Tulsa County | 115,919 |
| Edmond | Oklahoma County | 95,618 |
| Lawton | Comanche County | 90,662 |
| Moore | Cleveland County | 63,045 |
| Midwest City | Oklahoma County | 58,170 |
| Enid | Garfield County | 50,821 |
| Stillwater | Payne County | 48,818 |
| Owasso | Tulsa County | 39,013 |
| Bartlesville | Washington County | 37,559 |
| Muskogee | Muskogee County | 36,819 |
| Shawnee | Pottawatomie County | 31,511 |
| Bixby | Tulsa County | 29,402 |
| Jenks | Tulsa County | 26,519 |
| Yukon | Canadian County | 24,802 |
| Ardmore | Carter County | 24,757 |
| Ponca City | Kay County | 24,377 |
| Duncan | Stephens County | 22,872 |
| Sapulpa | Creek County | 22,268 |
| Del City | Oklahoma County | 21,561 |
| Mustang | Canadian County | 21,290 |
| Bethany | Oklahoma County | 20,606 |
| Sand Springs | Tulsa County | 19,973 |
| Claremore | Rogers County | 19,921 |
| Durant | Bryan County | 19,209 |
| Altus | Jackson County | 18,670 |
| McAlester | Pittsburg County | 18,098 |
| El Reno | Canadian County | 17,919 |
| Ada | Pontotoc County | 16,536 |
| Tahlequah | Cherokee County | 16,513 |
| Chickasha | Grady County | 16,349 |
| Glenpool | Tulsa County | 13,885 |
| Miami | Ottawa County | 12,960 |
| Guymon | Texas County | 12,596 |
| Newcastle | McClain County | 12,238 |
| Choctaw | Oklahoma County | 12,208 |
| Weatherford | Custer County | 12,014 |
| Woodward | Woodward County | 11,976 |
| Elk City | Beckham County | 11,406 |
| Okmulgee | Okmulgee County | 11,370 |
| Guthrie | Logan County | 11,021 |
| Warr Acres | Oklahoma County | 10,437 |
| Coweta | Wagoner County | 10,157 |
| Pryor Creek | Mayes County | 9,520 |
| The Village | Oklahoma County | 9,470 |
| Blanchard | McClain County | 9,276 |
| Poteau | Le Flore County | 8,903 |
| Sallisaw | Sequoyah County | 8,553 |
Showing the 50 most populous — and 550 more. Search the map above for any Oklahoma city or village.
A city can span more than one county; each is listed in its primary county — the one its center falls in.
Which Oklahoma county is the richest, largest, most crowded? The answers
- Oklahoma’s highest median household income is in Canadian County ($86,539); the lowest is in Latimer County ($41,241). Census SAIPE 2023
- Oklahoma’s most populous county is Oklahoma County (808,866); the least populous is Cimarron County (2,191) — a 369× spread. Census PEP 2023
- Oklahoma’s largest county by land area is Osage County (2,247 sq mi); the smallest is Marshall County (371 sq mi). Census TIGER
- Oklahoma’s highest population density is in Tulsa County (1,198/sq mi); the lowest is in Cimarron County (1/sq mi). Census PEP 2023 · TIGER
- Oklahoma’s highest poverty rate is in Greer County (25.7%); the lowest is in Canadian County (7.9%). Census SAIPE 2023
- In Oklahoma, unemployment is highest in Love County (7.0%) and lowest in Dewey County (2.6%), for May 2026. BLS LAUS
- Oklahoma’s highest median age is in McIntosh County (47.3); the lowest is in Payne County (27.7). Census ACS 2019–2023
- Oklahoma’s highest share of bachelor’s degrees is in Payne County (40.1% of adults); the lowest is in Latimer County (10.4%). Census ACS 2019–2023
Every figure is a current official estimate from the source named — not a crowd-sourced or copied value. Suppressed estimates (coefficient of variation ≥ 0.30) are omitted, never guessed. See the full methodology.
Oklahoma counties: common questions
How many counties are in Oklahoma?
Oklahoma has 77 counties covering 68,597 sq mi and about 4.1M residents. Every one is on the map above and in the table below.
What is the largest county in Oklahoma?
It depends on the measure. By land area it’s Osage County (2,247 sq mi); by population it’s Oklahoma County (808,866 residents).
What county is Oklahoma City in?
Oklahoma City (population 688,693) is in Oklahoma County. Use the search on the map to find any Oklahoma city’s county.
What is the richest county in Oklahoma?
By median household income, Canadian County is the richest at $86,539; the poorest is Latimer County at $41,241 (Census SAIPE 2023).
What is the most populous county in Oklahoma?
Oklahoma County, with 808,866 residents — about 20.0% of Oklahoma’s people, and 369× the least populous, Cimarron County (2,191).
Sources & vintages
- Population — PEP Vintage 2023 (July 1, 2023) — pep/charv
- Median household income & poverty — SAIPE 2023
- Unemployment — BLS LAUS May 2026 (preliminary)
- Geometry & boundaries — Census TIGERweb
- Cities & city population — Census TIGERweb Incorporated Places + ACS 5-year 2019–2023
Data current through .