CountyAtlas Oregon
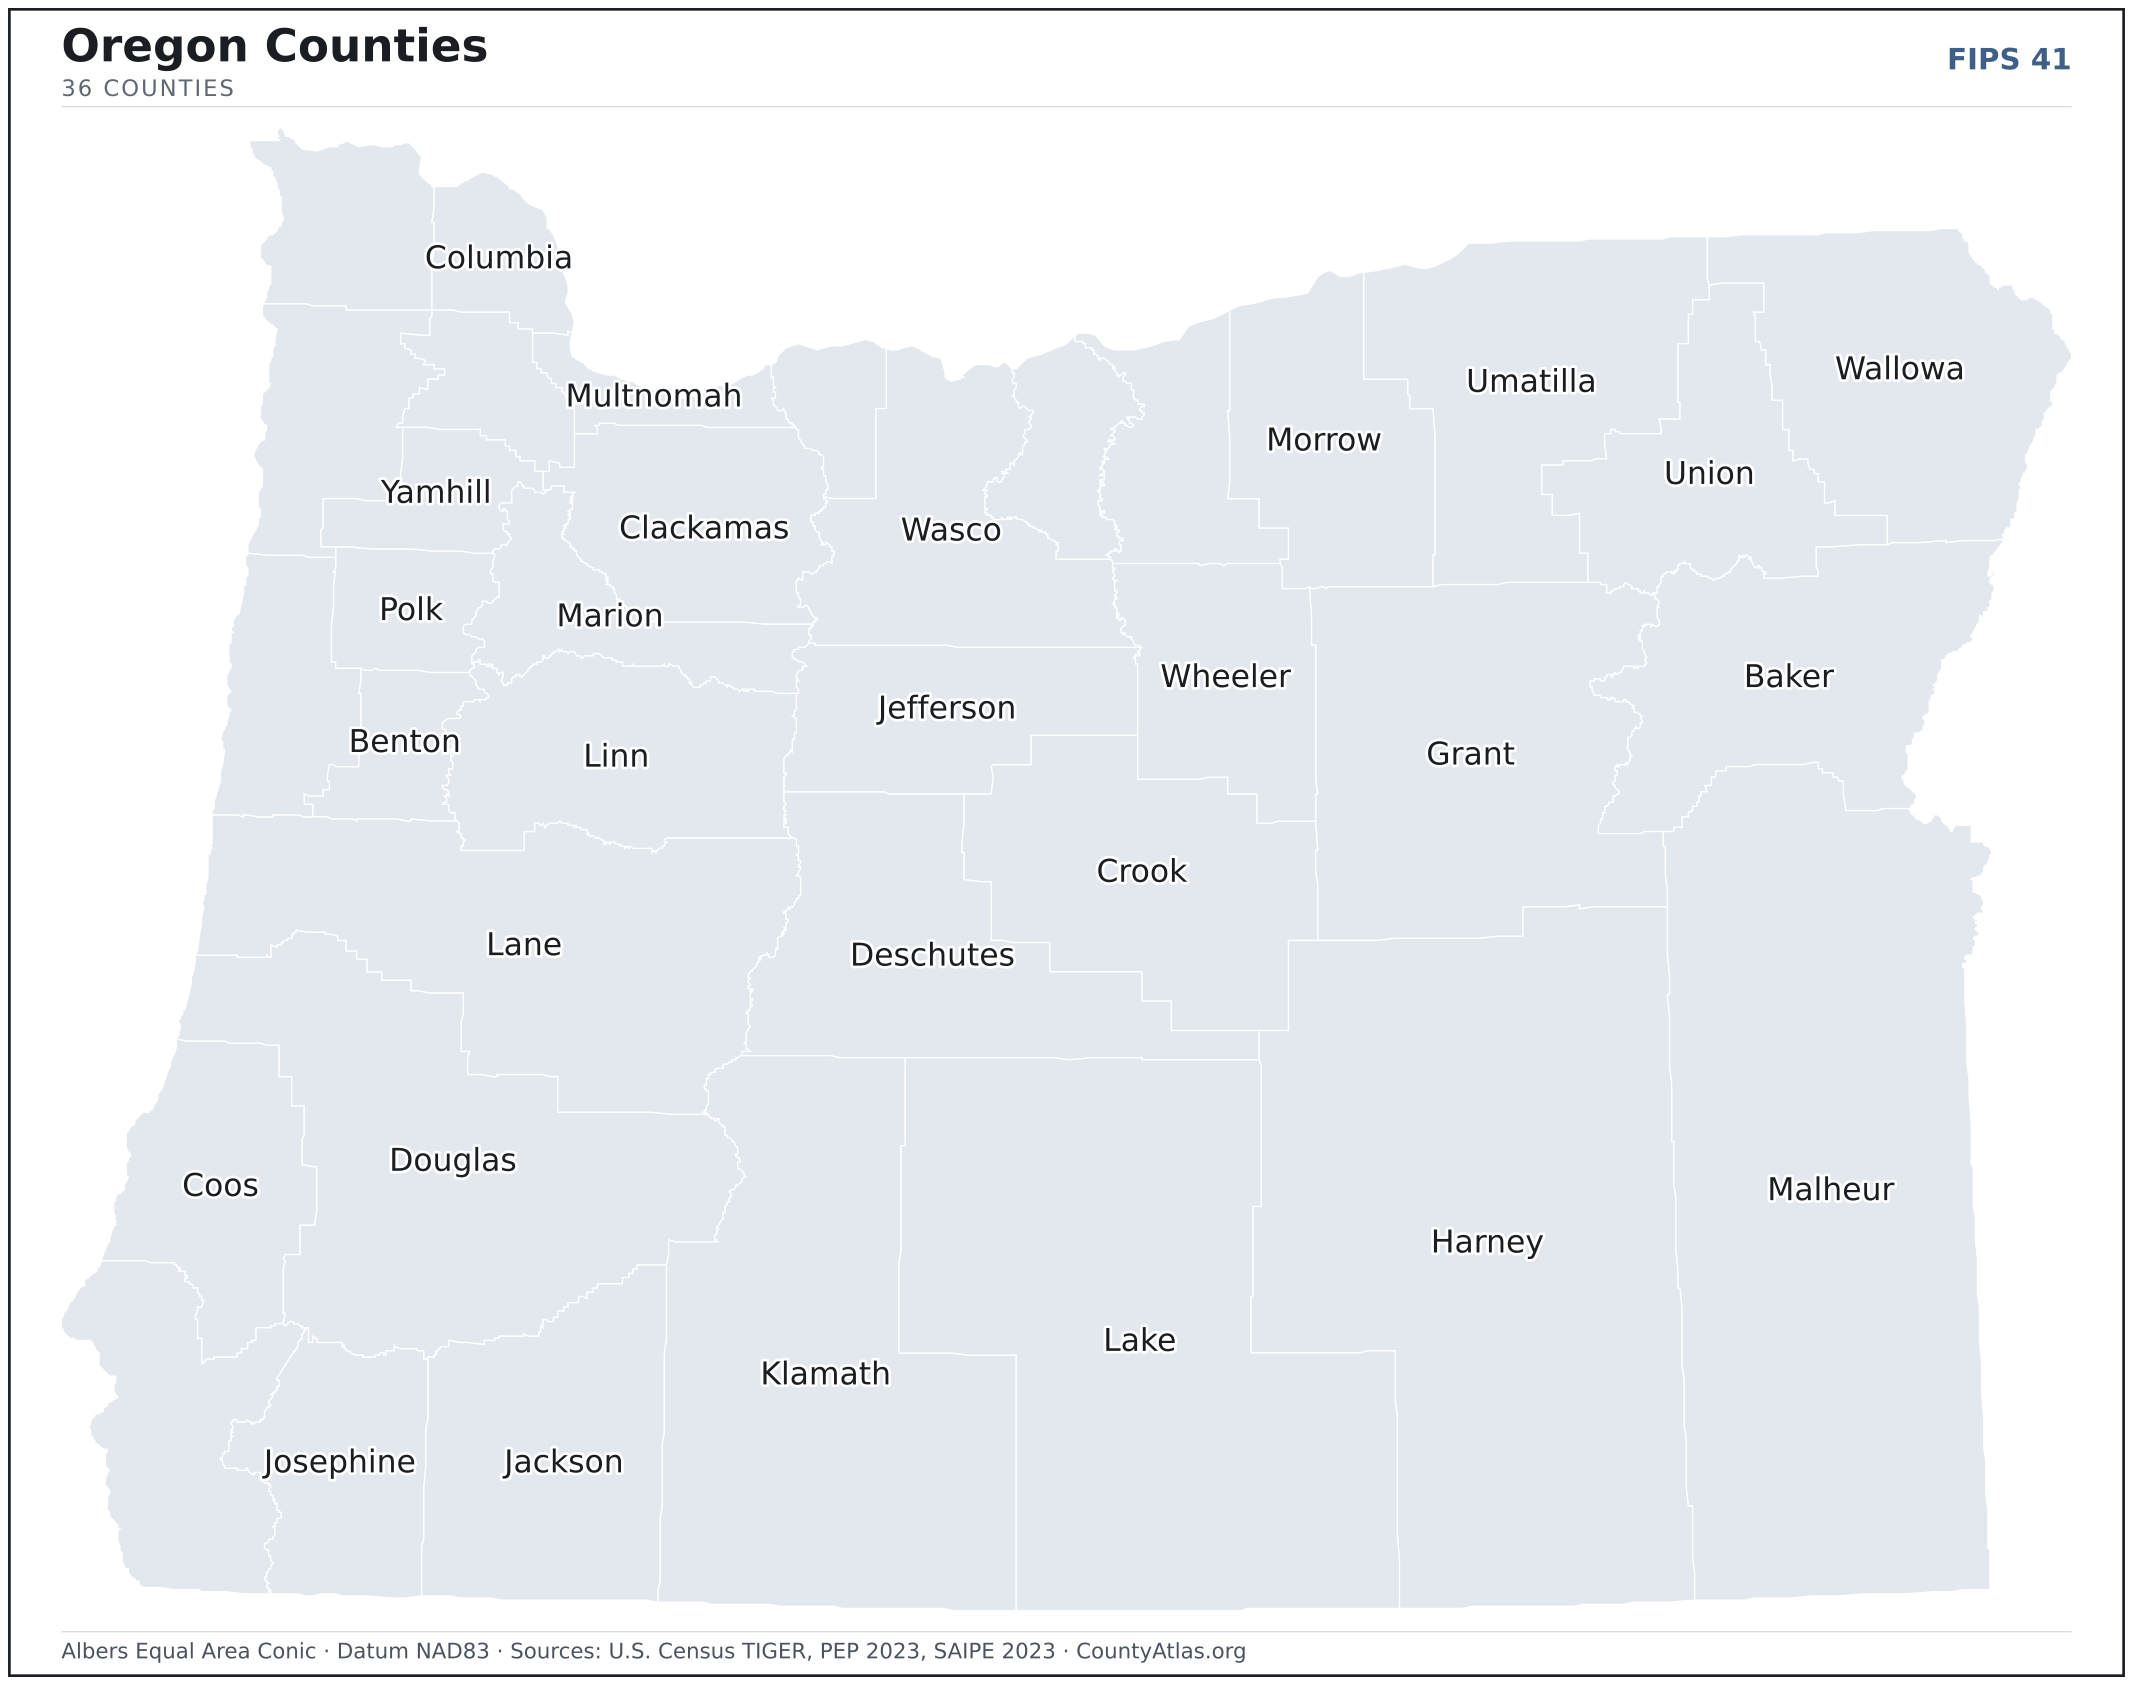
Oregon County Map with Cities — All 36 Counties
All 36 of Oregon's counties, mapped from official U.S. Census boundaries with population, income, and unemployment for every one. Colour the map by any measure, tap a county for its data, or download a print-ready copy.
Tap any county for its population, income, and more.
Oregon at a glance
- Scale. Oregon is divided into 36 counties across 95,997 sq mi of land — an average of 2,667 sq mi each. Census TIGER
- People. Its counties are home to 4,233,358 residents — an average of 117,593 each, or 44 per square mile statewide. Census PEP 2023
- Water. Another 2,382 sq mi is water — 2.4% of the state’s area, led by Curry County. Census TIGER
Oregon’s 36 counties, by the numbers
Every county’s population, median household income, unemployment, density, and land area — sortable by any column, so you can find yours or rank by what matters to you. A few patterns run through the data:
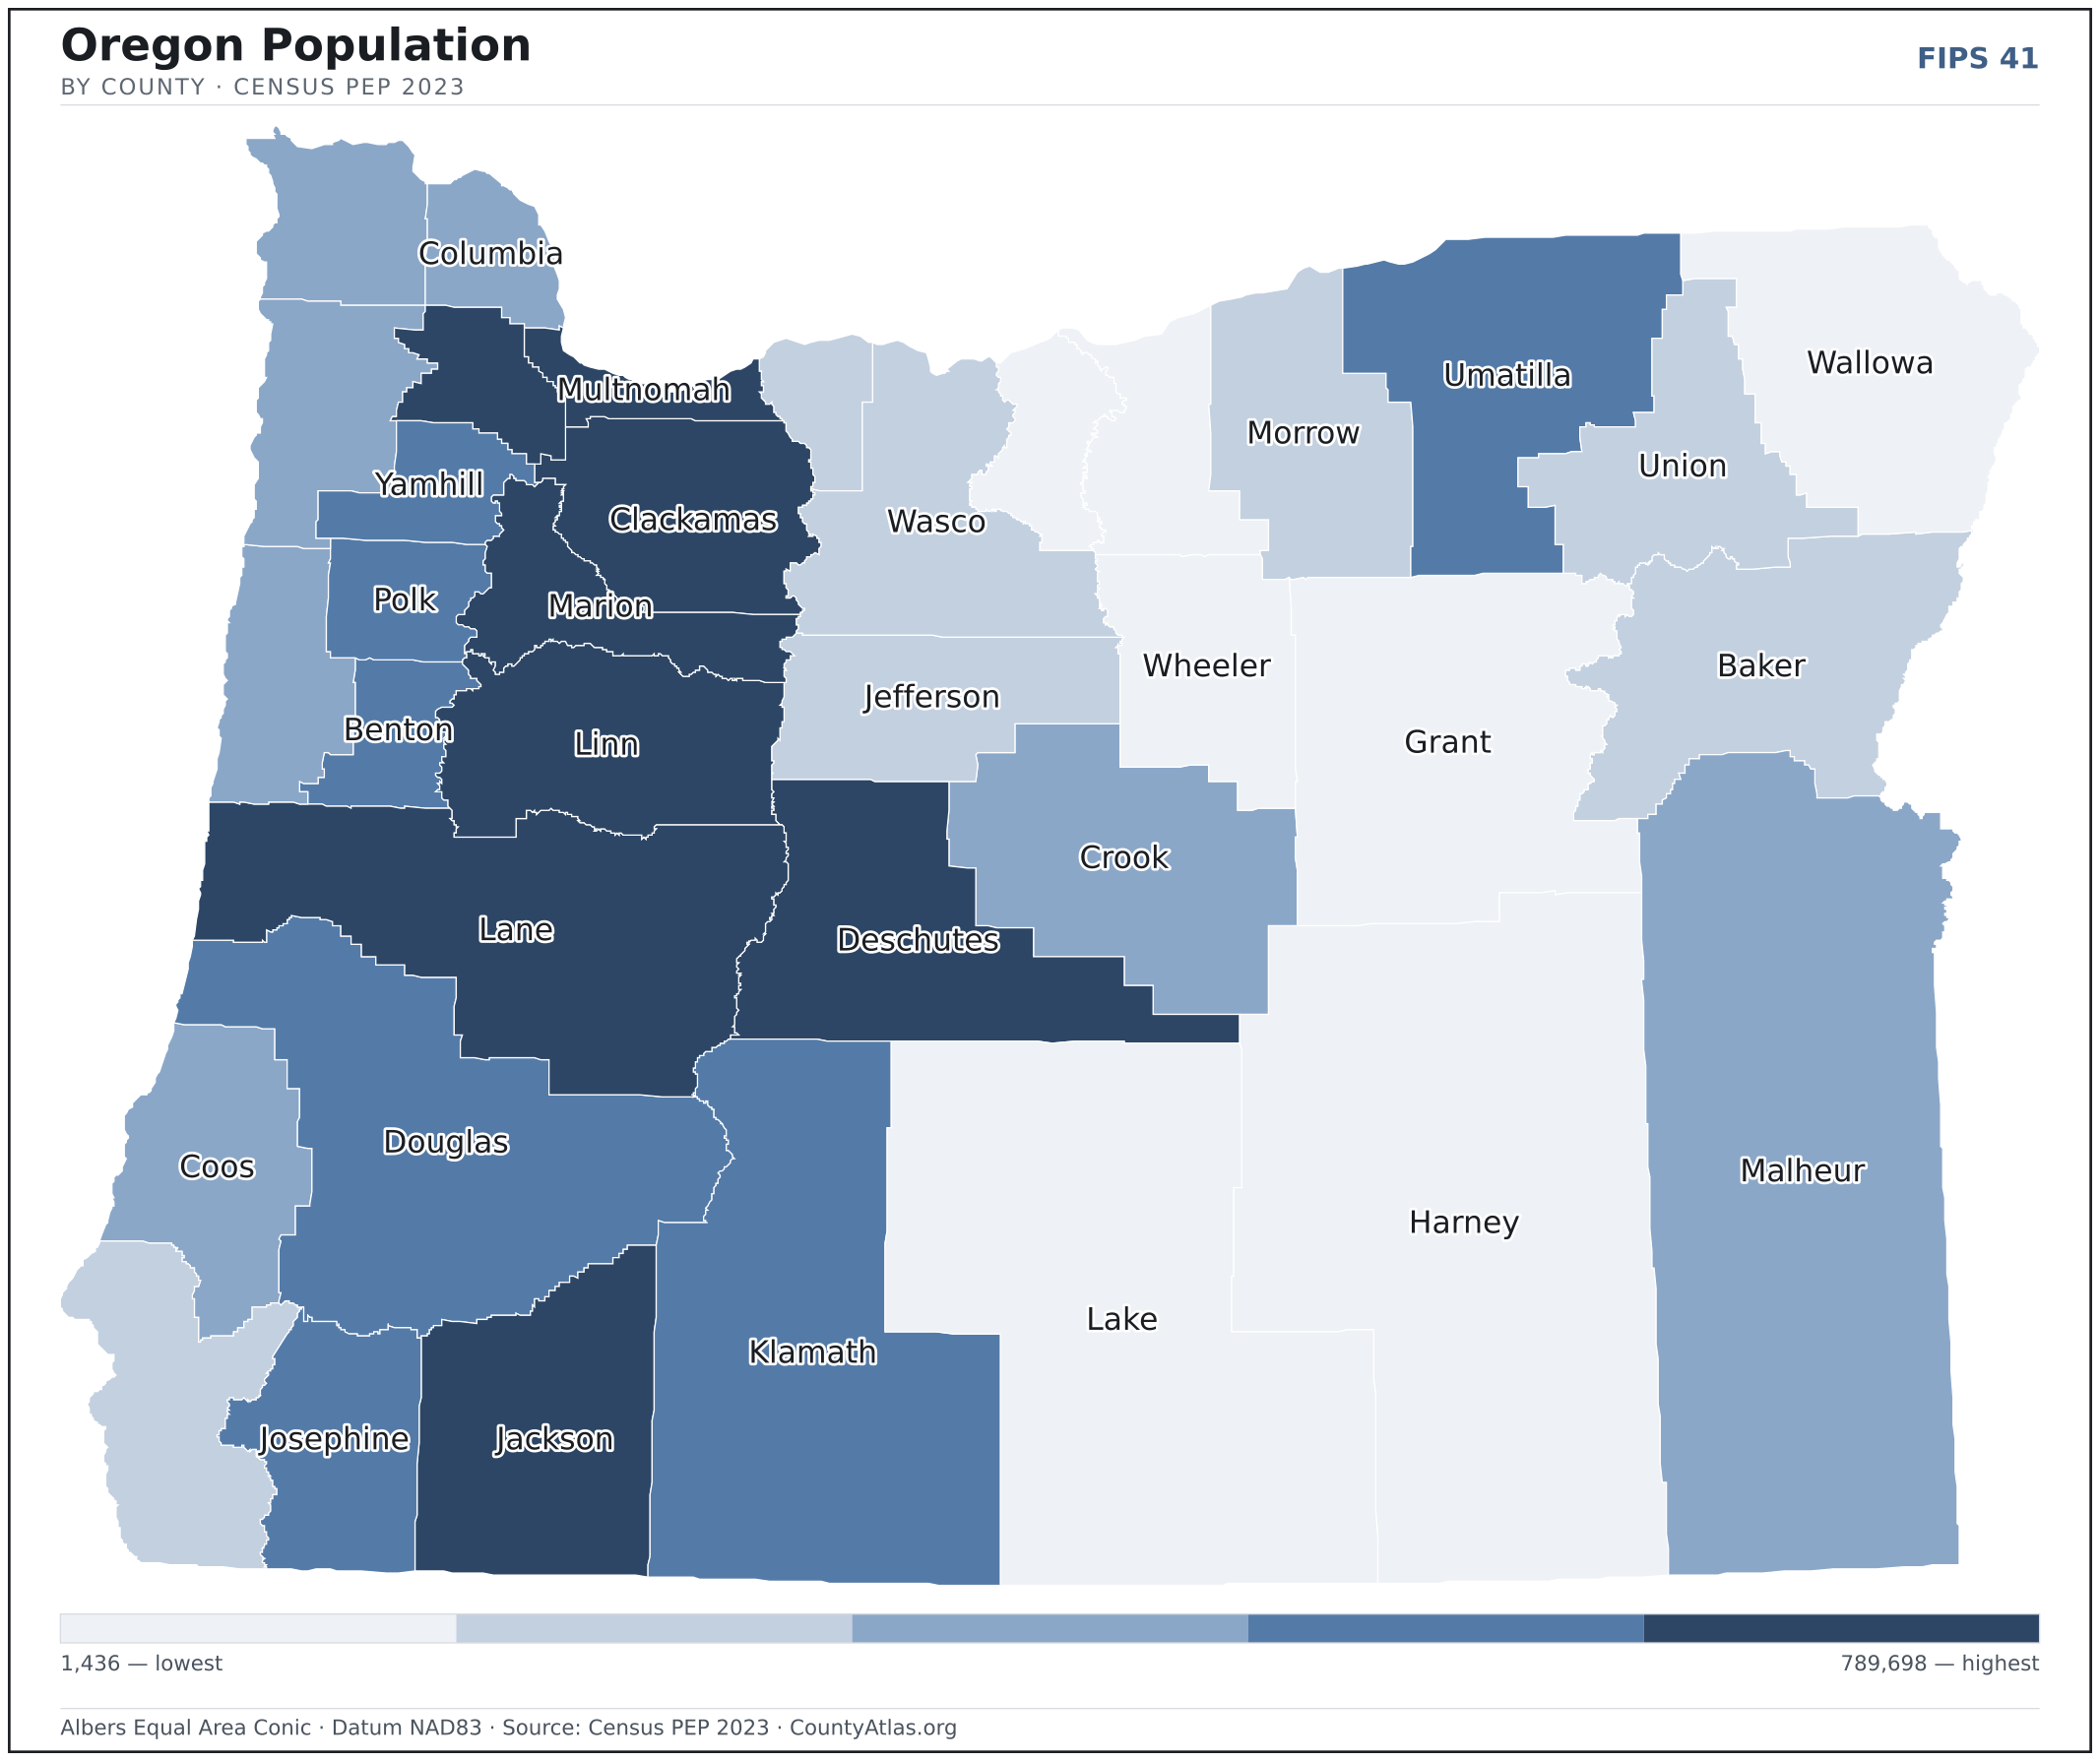
- Concentrated. Half of Oregon’s 4,233,358 residents live in just 4 of 36 counties, and the five largest hold 60.0% of the total. Census PEP 2023
- Income tracks poverty. The gap from richest to poorest runs 2.2×, and the 10 highest-income counties average 10.8% in poverty against 16.6% for the 10 lowest. Census SAIPE 2023
- Mostly small. Half of Oregon’s counties have fewer than 45,962 residents, and half report a median household income below $68,568 — a few metros lift the statewide totals well above both. Census PEP 2023 · SAIPE 2023
- Lopsided density. Only 16 of 36 counties are denser than Oregon’s statewide average of 44 people per square mile — the rest are more rural. Census PEP 2023 · TIGER
| Baker County | 16,912 | $59,123 | 4.9% | 6/sq mi | 3,068 sq mi | Baker City |
| Benton County | 97,713 | $74,800 | 4.1% | 145/sq mi | 675 sq mi | Corvallis |
| Clackamas County | 423,173 | $100,376 | 4.6% | 226/sq mi | 1,871 sq mi | Oregon City |
| Clatsop County | 41,102 | $65,160 | 4.4% | 50/sq mi | 828 sq mi | Astoria |
| Columbia County | 53,880 | $81,463 | 5.5% | 82/sq mi | 659 sq mi | St. Helens |
| Coos County | 64,212 | $61,386 | 5.3% | 40/sq mi | 1,596 sq mi | Coquille |
| Crook County | 26,952 | $73,421 | 5.5% | 9/sq mi | 2,979 sq mi | Prineville |
| Curry County | 23,296 | $55,238 | 5.8% | 14/sq mi | 1,628 sq mi | Gold Beach |
| Deschutes County | 208,513 | $95,414 | 4.4% | 69/sq mi | 3,018 sq mi | Bend |
| Douglas County | 112,435 | $60,296 | 5.7% | 22/sq mi | 5,036 sq mi | Roseburg |
| Gilliam County | 2,026 | $74,010 | 4.6% | 2/sq mi | 1,205 sq mi | Condon |
| Grant County | 7,215 | $61,024 | 5.7% | 2/sq mi | 4,528 sq mi | Canyon City |
| Harney County | 7,440 | $56,649 | 4.4% | 1/sq mi | 10,134 sq mi | Burns |
| Hood River County | 23,745 | $79,092 | 3.9% | 45/sq mi | 522 sq mi | Hood River |
| Jackson County | 220,768 | $71,030 | 5.3% | 79/sq mi | 2,783 sq mi | Medford |
| Jefferson County | 25,454 | $68,419 | 4.9% | 14/sq mi | 1,782 sq mi | Madras |
| Josephine County | 87,821 | $61,575 | 6.2% | 54/sq mi | 1,639 sq mi | Grants Pass |
| Klamath County | 70,003 | $54,630 | 6.3% | 12/sq mi | 5,950 sq mi | Klamath Falls |
| Lake County | 8,293 | $56,518 | 5.6% | 1/sq mi | 8,139 sq mi | Lakeview |
| Lane County | 381,181 | $70,065 | 4.8% | 84/sq mi | 4,554 sq mi | Eugene |
| Lincoln County | 50,821 | $61,603 | 5.4% | 52/sq mi | 981 sq mi | Newport |
| Linn County | 131,496 | $70,242 | 5.0% | 57/sq mi | 2,290 sq mi | Albany |
| Malheur County | 32,044 | $53,762 | 4.3% | 3/sq mi | 9,888 sq mi | Vale |
| Marion County | 346,741 | $73,210 | 4.7% | 294/sq mi | 1,181 sq mi | Salem |
| Morrow County | 12,302 | $80,508 | 4.3% | 6/sq mi | 2,031 sq mi | Heppner |
| Multnomah County | 789,698 | $83,290 | 4.8% | 1,832/sq mi | 431 sq mi | Portland |
| Polk County | 89,805 | $79,970 | 4.6% | 121/sq mi | 741 sq mi | Dallas |
| Sherman County | 1,951 | $73,123 | 5.1% | 2/sq mi | 824 sq mi | Moro |
| Tillamook County | 27,417 | $68,717 | 4.9% | 25/sq mi | 1,103 sq mi | Tillamook |
| Umatilla County | 80,053 | $62,890 | 4.8% | 25/sq mi | 3,215 sq mi | Pendleton |
| Union County | 25,944 | $63,524 | 4.5% | 13/sq mi | 2,037 sq mi | La Grande |
| Wallowa County | 7,674 | $61,173 | 5.5% | 2/sq mi | 3,146 sq mi | Enterprise |
| Wasco County | 26,333 | $65,701 | 4.9% | 11/sq mi | 2,381 sq mi | The Dalles |
| Washington County | 598,865 | $103,486 | 4.6% | 827/sq mi | 724 sq mi | Hillsboro |
| Wheeler County | 1,436 | $46,315 | 4.0% | 1/sq mi | 1,716 sq mi | Fossil |
| Yamhill County | 108,644 | $86,887 | 4.5% | 152/sq mi | 716 sq mi | McMinnville |
All 36 counties, sortable by any column — click a heading. A suppressed estimate (coefficient of variation ≥ 0.30) shows a marker, never a guess. County seats are from Wikidata (CC0), each validated to a Census place inside its county; a county with no validated seat is left blank. See the methodology.
Download & print this Oregon map
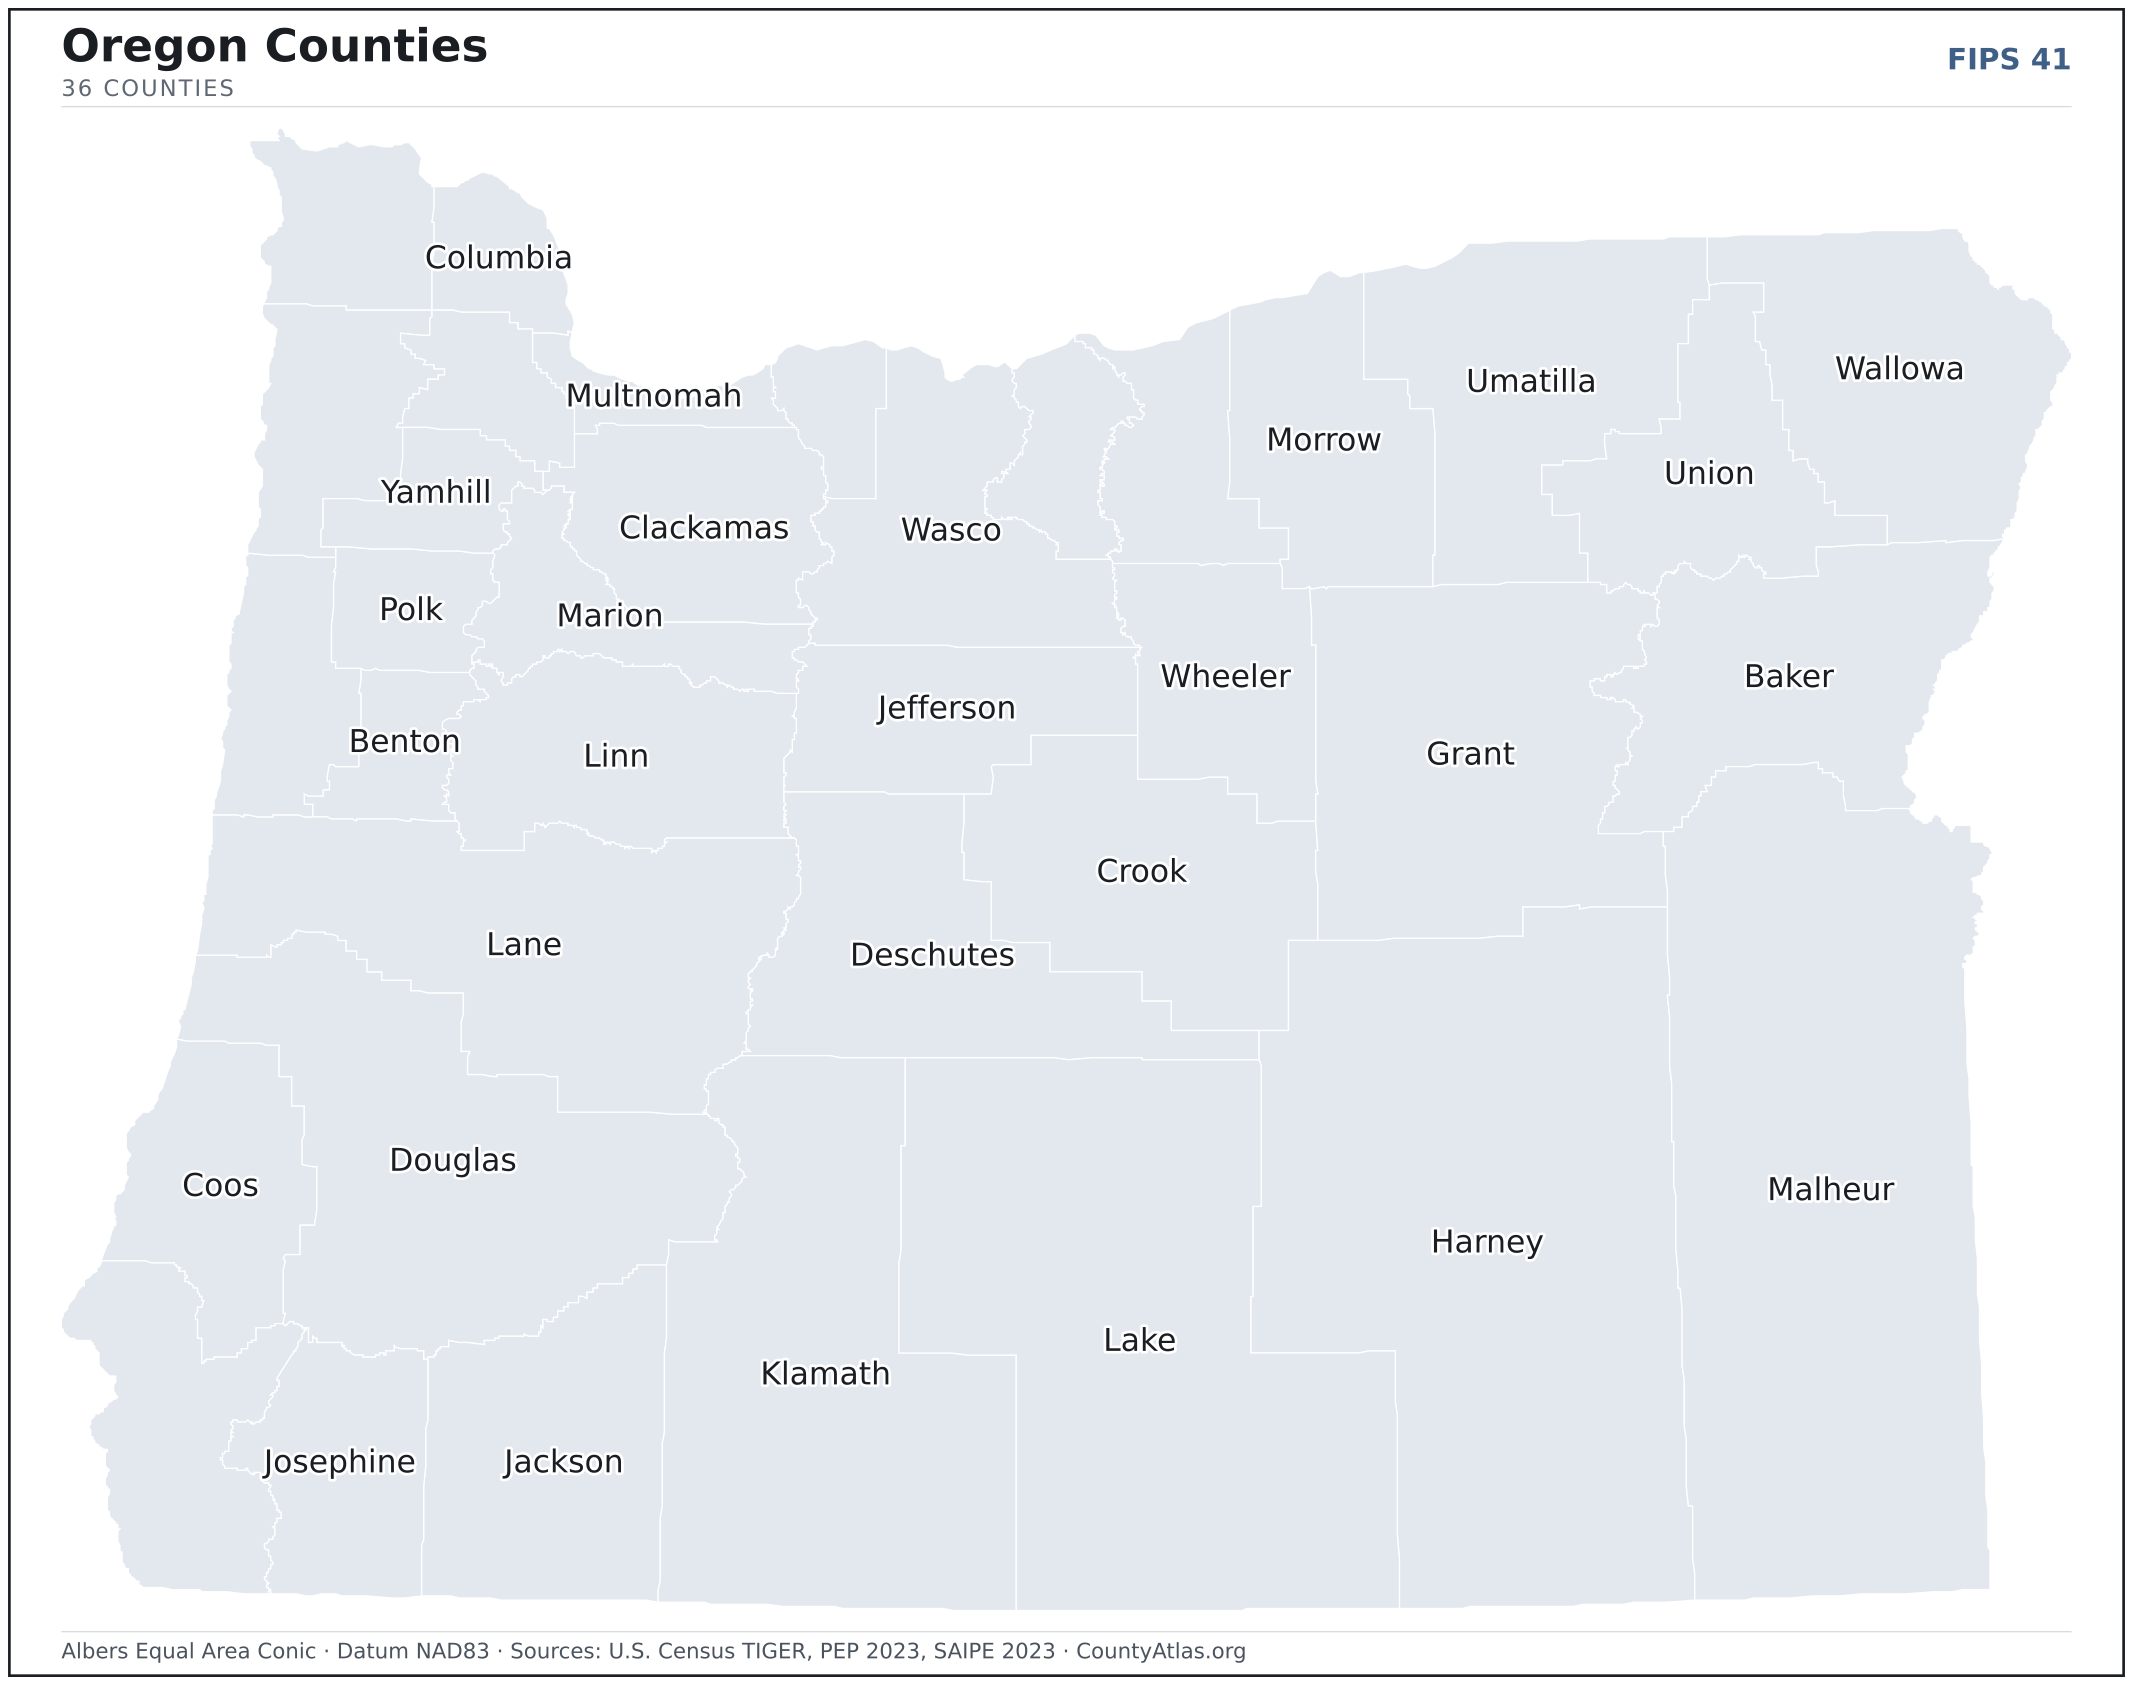
Oregon maps, coloured by the data
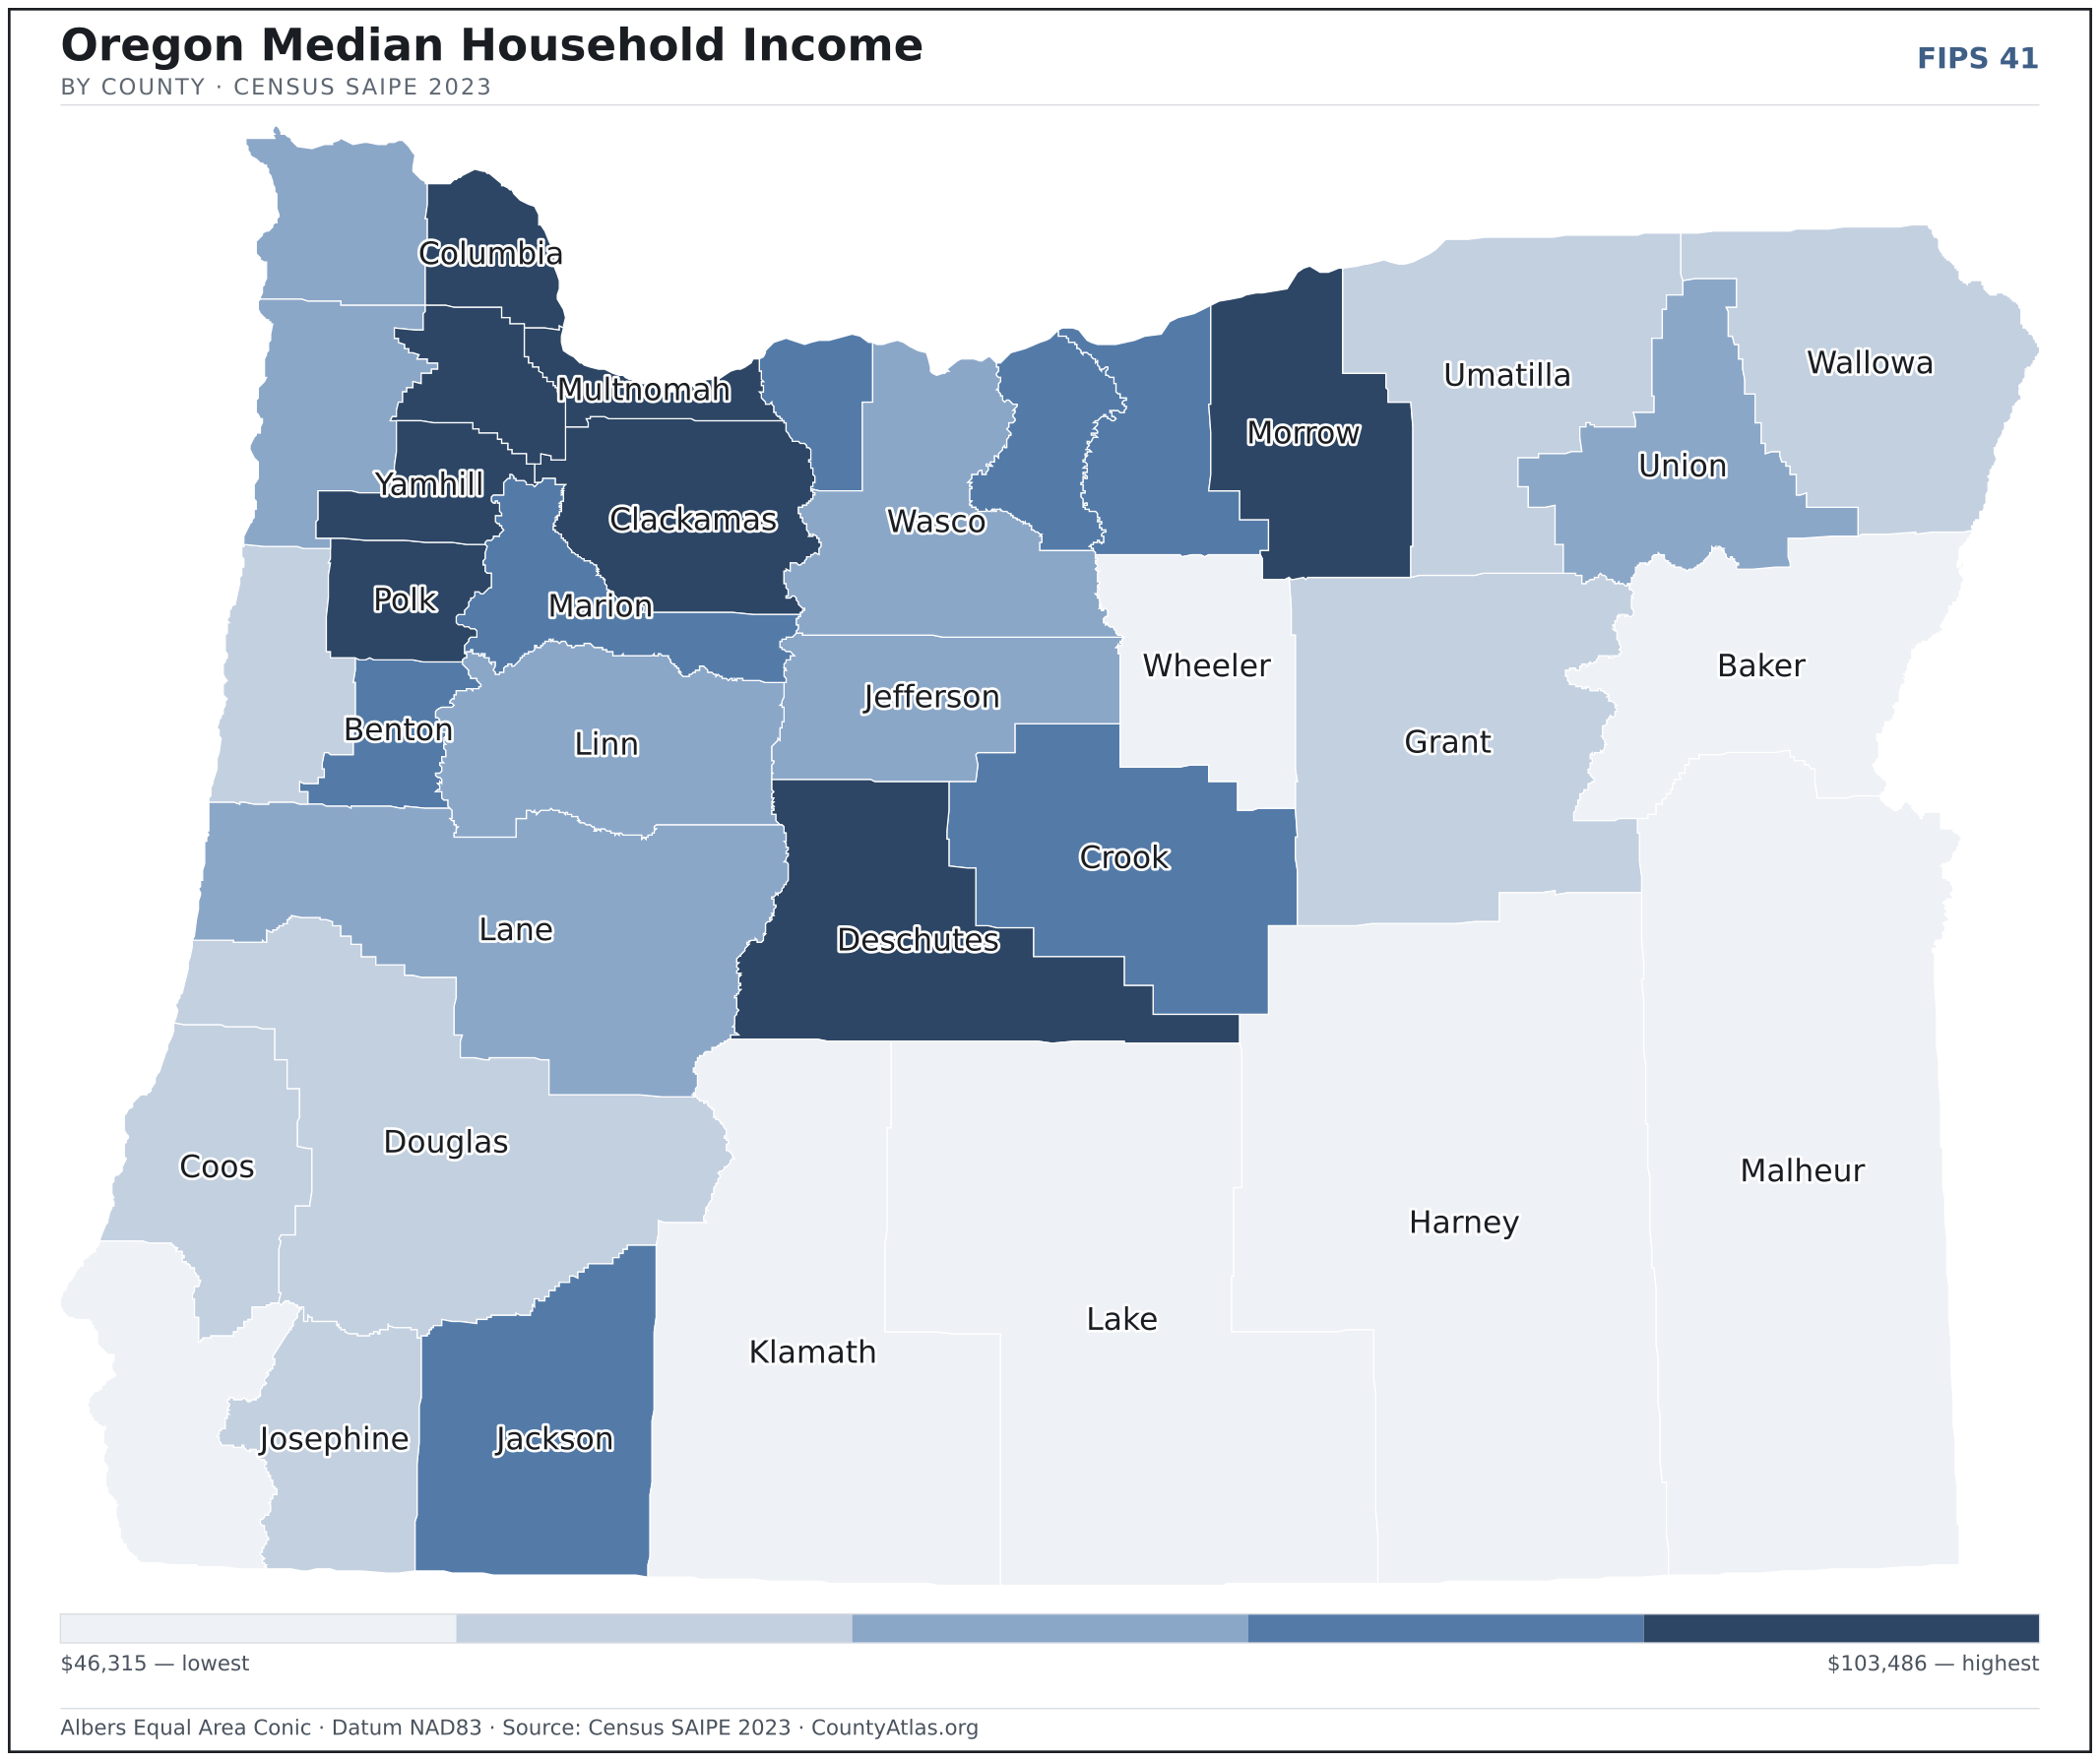
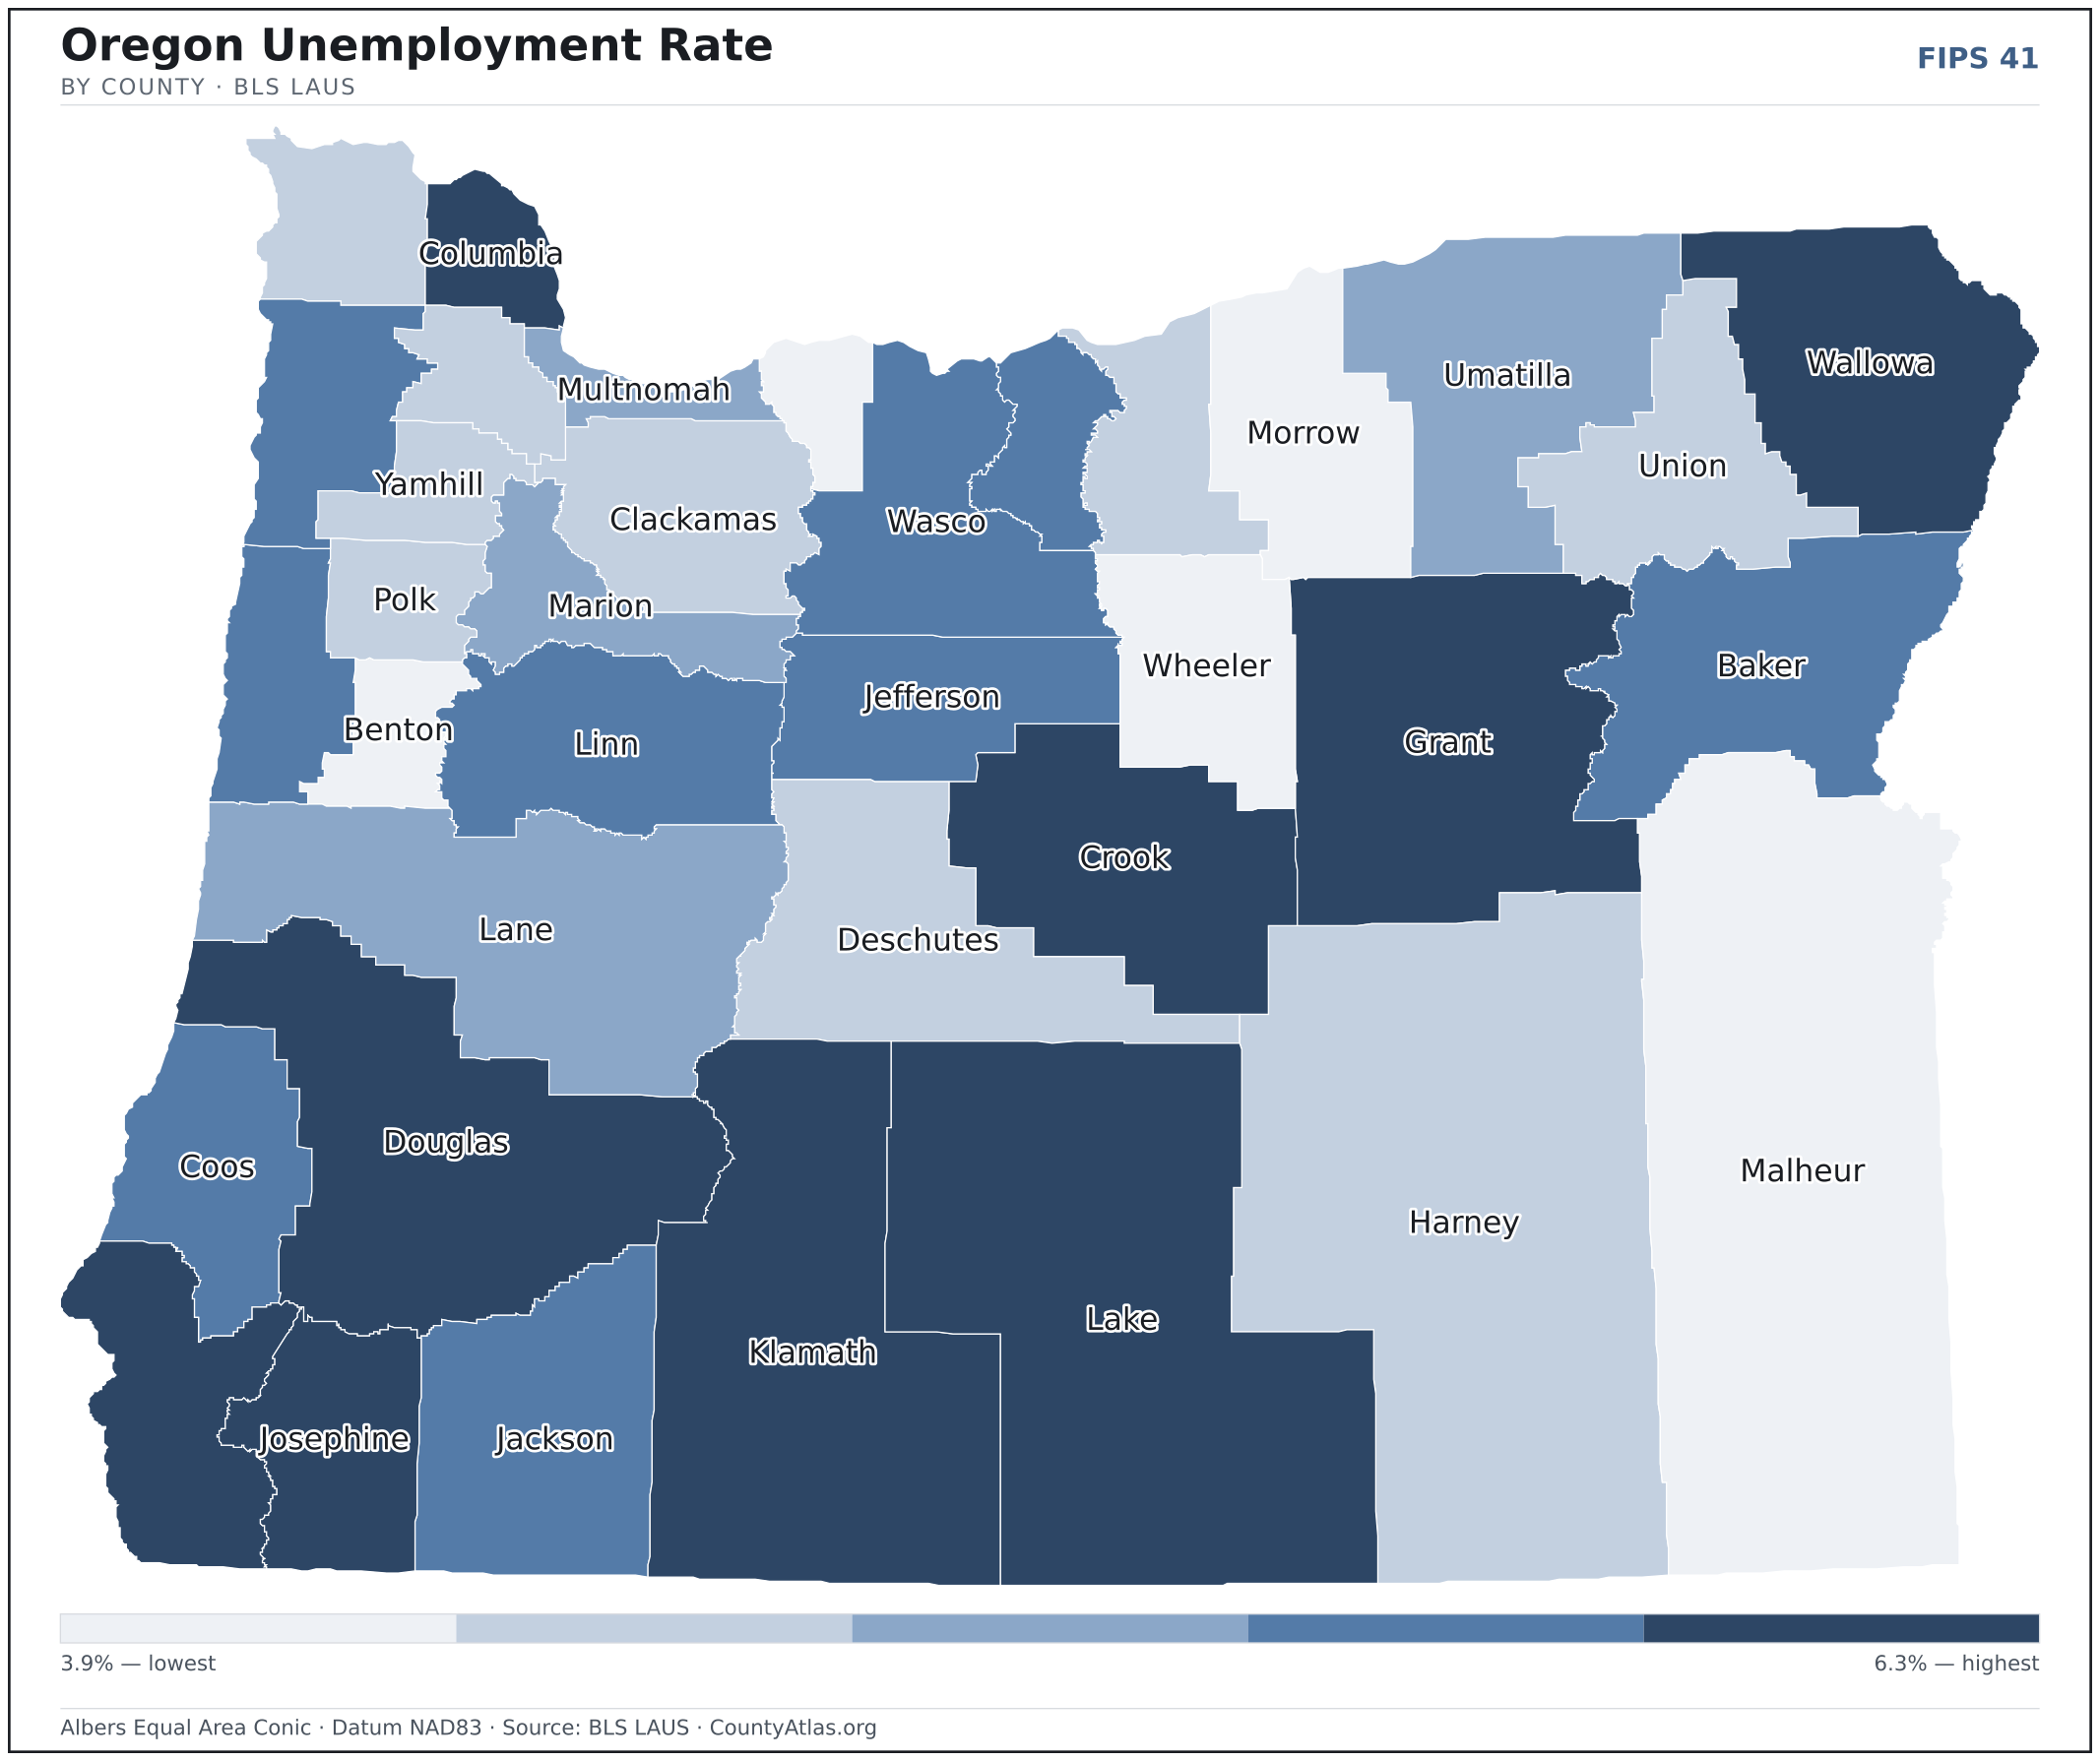
Cities in Oregon
Oregon has 241 incorporated cities and towns. The largest is Portland in Multnomah County with 642,715 residents. Use the search on the map above to find any city and highlight the county it sits in.
| Portland | Multnomah County | 642,715 |
| Eugene | Lane County | 177,520 |
| Salem | Marion County | 176,666 |
| Gresham | Multnomah County | 112,818 |
| Hillsboro | Washington County | 107,050 |
| Bend | Deschutes County | 101,472 |
| Beaverton | Washington County | 97,502 |
| Medford | Jackson County | 85,794 |
| Springfield | Lane County | 61,642 |
| Corvallis | Benton County | 60,424 |
| Albany | Linn County | 56,773 |
| Tigard | Washington County | 55,395 |
| Lake Oswego | Clackamas County | 40,367 |
| Grants Pass | Josephine County | 39,183 |
| Keizer | Marion County | 39,013 |
| Oregon City | Clackamas County | 37,482 |
| Redmond | Deschutes County | 35,161 |
| McMinnville | Yamhill County | 34,493 |
| Tualatin | Washington County | 27,710 |
| West Linn | Clackamas County | 27,065 |
| Woodburn | Marion County | 26,845 |
| Forest Grove | Washington County | 26,406 |
| Wilsonville | Clackamas County | 26,183 |
| Newberg | Yamhill County | 25,622 |
| Happy Valley | Clackamas County | 25,572 |
| Roseburg | Douglas County | 23,773 |
| Klamath Falls | Klamath County | 21,879 |
| Ashland | Jackson County | 21,343 |
| Milwaukie | Clackamas County | 21,256 |
| Sherwood | Washington County | 20,227 |
| Hermiston | Umatilla County | 19,406 |
| Central Point | Jackson County | 19,183 |
| Lebanon | Linn County | 18,978 |
| Canby | Clackamas County | 18,103 |
| Dallas | Polk County | 17,214 |
| Pendleton | Umatilla County | 17,070 |
| Troutdale | Multnomah County | 16,000 |
| The Dalles | Wasco County | 15,973 |
| Coos Bay | Coos County | 15,867 |
| St. Helens | Columbia County | 14,152 |
| Cornelius | Washington County | 13,700 |
| La Grande | Union County | 13,059 |
| Sandy | Clackamas County | 12,738 |
| Gladstone | Clackamas County | 11,986 |
| Ontario | Malheur County | 11,728 |
| Prineville | Crook County | 11,187 |
| Monmouth | Polk County | 11,176 |
| Cottage Grove | Lane County | 10,630 |
| Fairview | Multnomah County | 10,627 |
| Silverton | Marion County | 10,445 |
Showing the 50 most populous — and 191 more. Search the map above for any Oregon city or village.
A city can span more than one county; each is listed in its primary county — the one its center falls in.
Which Oregon county is the richest, largest, most crowded? The answers
- Oregon’s highest median household income is in Washington County ($103,486); the lowest is in Wheeler County ($46,315). Census SAIPE 2023
- Oregon’s most populous county is Multnomah County (789,698); the least populous is Wheeler County (1,436) — a 550× spread. Census PEP 2023
- Oregon’s largest county by land area is Harney County (10,134 sq mi); the smallest is Multnomah County (431 sq mi). Census TIGER
- Oregon’s highest population density is in Multnomah County (1,832/sq mi); the lowest is in Harney County (1/sq mi). Census PEP 2023 · TIGER
- Oregon’s highest poverty rate is in Malheur County (19.7%); the lowest is in Clackamas County (6.9%). Census SAIPE 2023
- In Oregon, unemployment is highest in Klamath County (6.3%) and lowest in Hood River County (3.9%), for May 2026. BLS LAUS
- Oregon’s highest median age is in Wheeler County (57.3); the lowest is in Benton County (33.8). Census ACS 2019–2023
- Oregon’s highest share of bachelor’s degrees is in Benton County (54.4% of adults); the lowest is in Morrow County (9.8%). Census ACS 2019–2023
Every figure is a current official estimate from the source named — not a crowd-sourced or copied value. Suppressed estimates (coefficient of variation ≥ 0.30) are omitted, never guessed. See the full methodology.
Oregon counties: common questions
How many counties are in Oregon?
Oregon has 36 counties covering 95,997 sq mi and about 4.2M residents. Every one is on the map above and in the table below.
What is the largest county in Oregon?
It depends on the measure. By land area it’s Harney County (10,134 sq mi); by population it’s Multnomah County (789,698 residents).
What county is Portland in?
Portland (population 642,715) is in Multnomah County. Use the search on the map to find any Oregon city’s county.
What is the richest county in Oregon?
By median household income, Washington County is the richest at $103,486; the poorest is Wheeler County at $46,315 (Census SAIPE 2023).
What is the most populous county in Oregon?
Multnomah County, with 789,698 residents — about 18.7% of Oregon’s people, and 550× the least populous, Wheeler County (1,436).
Sources & vintages
- Population — PEP Vintage 2023 (July 1, 2023) — pep/charv
- Median household income & poverty — SAIPE 2023
- Unemployment — BLS LAUS May 2026 (preliminary)
- Geometry & boundaries — Census TIGERweb
- Cities & city population — Census TIGERweb Incorporated Places + ACS 5-year 2019–2023
Data current through .