CountyAtlas South Carolina
South Carolina County Map with Cities — All 46 Counties
All 46 of South Carolina's counties, mapped from official U.S. Census boundaries with population, income, and unemployment for every one. Colour the map by any measure, tap a county for its data, or download a print-ready copy.
Tap any county for its population, income, and more.
South Carolina at a glance
- Scale. South Carolina is divided into 46 counties across 30,064 sq mi of land — an average of 654 sq mi each. Census TIGER
- People. Its counties are home to 5,373,555 residents — an average of 116,816 each, or 179 per square mile statewide. Census PEP 2023
- Water. Another 1,959 sq mi is water — 6.1% of the state’s area, led by Charleston County. Census TIGER
South Carolina’s 46 counties, by the numbers
Every county’s population, median household income, unemployment, density, and land area — sortable by any column, so you can find yours or rank by what matters to you. A few patterns run through the data:
- Concentrated. Half of South Carolina’s 5,373,555 residents live in just 7 of 46 counties, and the five largest hold 40.2% of the total. Census PEP 2023
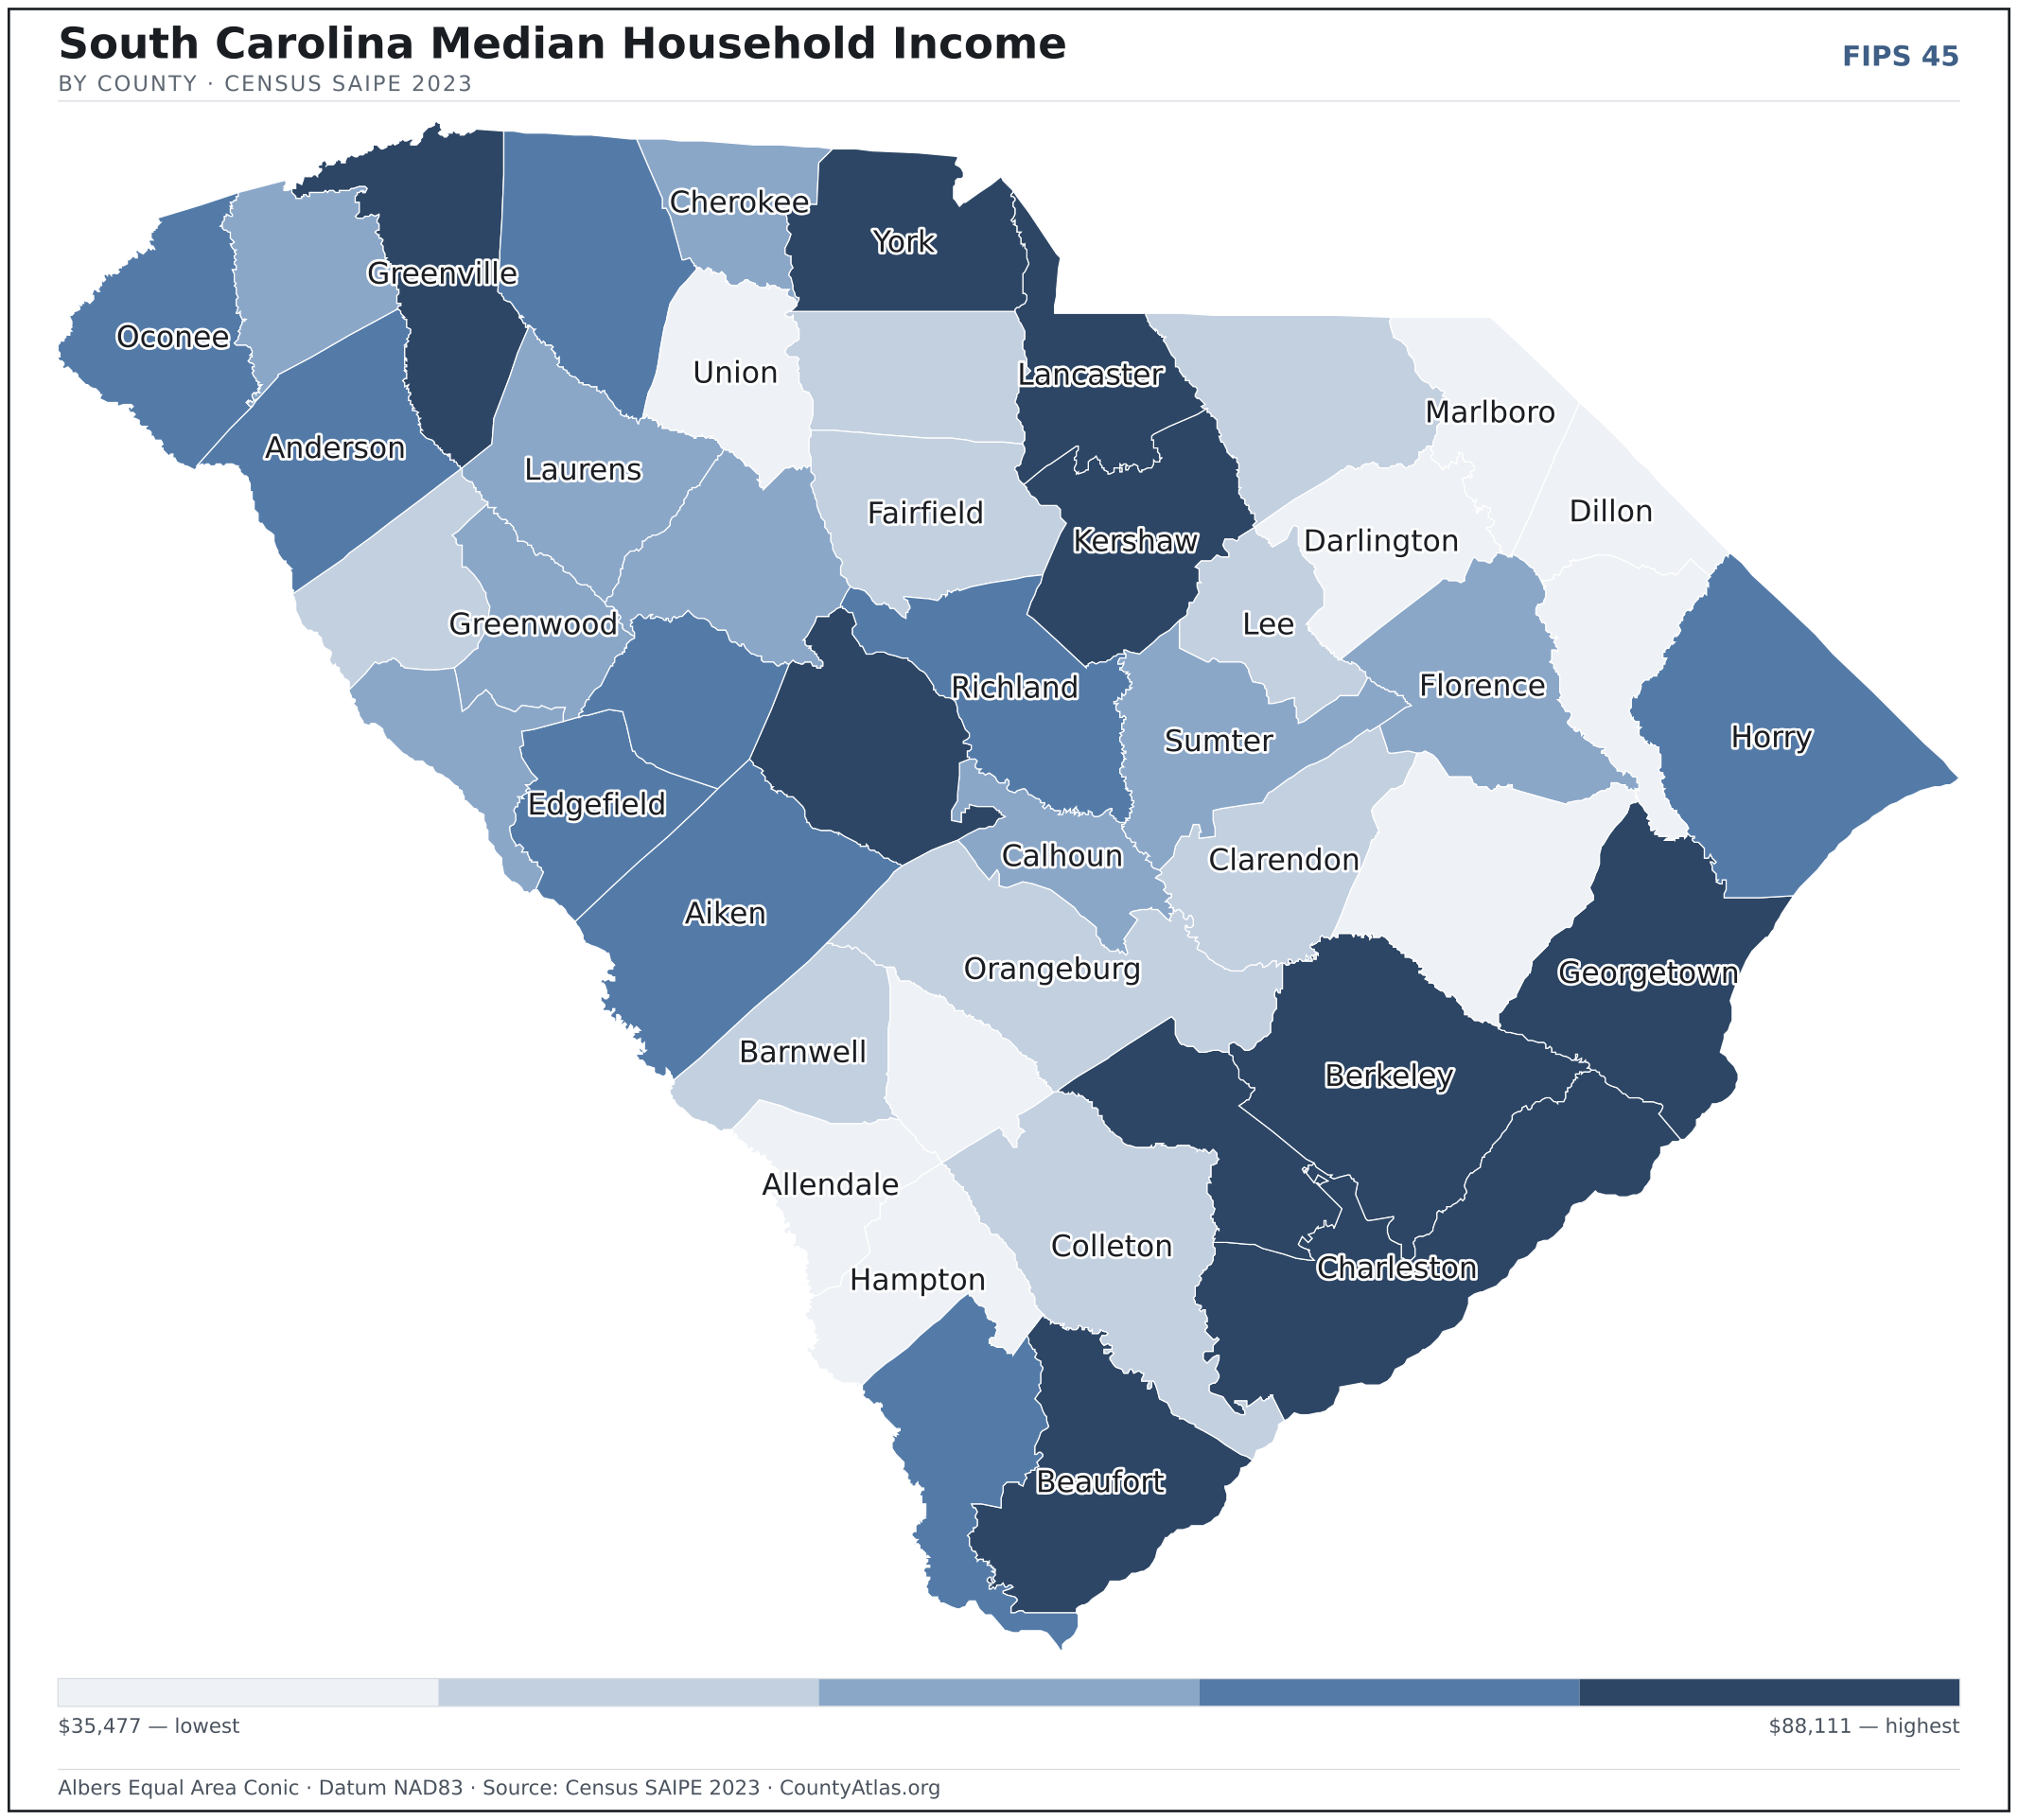
- Income tracks poverty. The gap from richest to poorest runs 2.5×, and the 10 highest-income counties average 11.0% in poverty against 25.6% for the 10 lowest. Census SAIPE 2023
- Mostly small. Half of South Carolina’s counties have fewer than 59,565 residents, and half report a median household income below $57,547 — a few metros lift the statewide totals well above both. Census PEP 2023 · SAIPE 2023
- Lopsided density. Only 13 of 46 counties are denser than South Carolina’s statewide average of 179 people per square mile — the rest are more rural. Census PEP 2023 · TIGER
| Abbeville County | 24,434 | $51,580 | 4.1% | 50/sq mi | 491 sq mi | Abbeville |
| Aiken County | 177,130 | $67,769 | 3.7% | 165/sq mi | 1,071 sq mi | Aiken |
| Allendale County | 7,369 | $35,477 | 5.8% | 18/sq mi | 408 sq mi | Allendale |
| Anderson County | 213,076 | $64,813 | 3.6% | 298/sq mi | 714 sq mi | Anderson |
| Bamberg County | 12,974 | $41,555 | 5.1% | 33/sq mi | 393 sq mi | Bamberg |
| Barnwell County | 20,447 | $46,482 | 4.9% | 37/sq mi | 548 sq mi | Barnwell |
| Beaufort County | 198,979 | $82,199 | 3.4% | 345/sq mi | 576 sq mi | Beaufort |
| Berkeley County | 255,217 | $82,414 | 3.4% | 231/sq mi | 1,104 sq mi | Moncks Corner |
| Calhoun County | 14,186 | $58,916 | 3.9% | 37/sq mi | 381 sq mi | St. Matthews |
| Charleston County | 424,367 | $88,111 | 3.0% | 462/sq mi | 918 sq mi | Charleston |
| Cherokee County | 56,714 | $57,768 | 5.0% | 144/sq mi | 393 sq mi | Gaffney |
| Chester County | 32,226 | $51,383 | 4.8% | 55/sq mi | 581 sq mi | Chester |
| Chesterfield County | 44,031 | $50,962 | 4.4% | 55/sq mi | 799 sq mi | Chesterfield |
| Clarendon County | 31,004 | $47,675 | 4.9% | 51/sq mi | 607 sq mi | Manning |
| Colleton County | 38,874 | $48,504 | 4.2% | 37/sq mi | 1,057 sq mi | Walterboro |
| Darlington County | 62,416 | $46,249 | 4.5% | 111/sq mi | 561 sq mi | Darlington |
| Dillon County | 27,698 | $45,269 | 5.0% | 68/sq mi | 405 sq mi | Dillon |
| Dorchester County | 169,833 | $78,329 | 3.4% | 299/sq mi | 568 sq mi | St. George |
| Edgefield County | 27,607 | $62,851 | 3.3% | 55/sq mi | 501 sq mi | Edgefield |
| Fairfield County | 20,422 | $48,123 | 4.6% | 30/sq mi | 686 sq mi | Winnsboro |
| Florence County | 137,214 | $56,144 | 4.3% | 171/sq mi | 800 sq mi | Florence |
| Georgetown County | 65,731 | $69,379 | 4.4% | 81/sq mi | 814 sq mi | Georgetown |
| Greenville County | 558,036 | $76,281 | 3.4% | 710/sq mi | 786 sq mi | Greenville |
| Greenwood County | 69,460 | $56,726 | 4.5% | 152/sq mi | 456 sq mi | Greenwood |
| Hampton County | 18,122 | $44,774 | 4.1% | 32/sq mi | 560 sq mi | Hampton |
| Horry County | 397,478 | $68,684 | 4.4% | 351/sq mi | 1,133 sq mi | Conway |
| Jasper County | 33,544 | $61,816 | 3.7% | 51/sq mi | 655 sq mi | Ridgeland |
| Kershaw County | 69,905 | $69,277 | 3.8% | 96/sq mi | 727 sq mi | Camden |
| Lancaster County | 108,215 | $74,417 | 4.0% | 197/sq mi | 549 sq mi | Lancaster |
| Laurens County | 68,873 | $56,237 | 4.0% | 97/sq mi | 713 sq mi | Laurens |
| Lee County | 15,967 | $46,256 | 5.6% | 39/sq mi | 410 sq mi | Bishopville |
| Lexington County | 309,528 | $76,559 | 3.3% | 443/sq mi | 699 sq mi | Lexington |
| Marion County | 28,508 | $40,171 | 5.7% | 58/sq mi | 489 sq mi | Marion |
| Marlboro County | 25,704 | $42,308 | 6.8% | 54/sq mi | 480 sq mi | Bennettsville |
| McCormick County | 9,941 | $58,475 | 4.2% | 28/sq mi | 359 sq mi | McCormick |
| Newberry County | 38,825 | $57,325 | 4.0% | 62/sq mi | 630 sq mi | Newberry |
| Oconee County | 81,221 | $67,161 | 3.6% | 130/sq mi | 627 sq mi | Walhalla |
| Orangeburg County | 82,820 | $50,959 | 5.4% | 75/sq mi | 1,106 sq mi | Orangeburg |
| Pickens County | 135,495 | $58,480 | 4.0% | 273/sq mi | 497 sq mi | Pickens |
| Richland County | 425,138 | $61,508 | 4.1% | 561/sq mi | 757 sq mi | Columbia |
| Saluda County | 19,123 | $60,220 | 3.3% | 42/sq mi | 453 sq mi | Saluda |
| Spartanburg County | 356,698 | $64,649 | 3.9% | 441/sq mi | 808 sq mi | Spartanburg |
| Sumter County | 104,165 | $55,481 | 4.9% | 157/sq mi | 665 sq mi | Sumter |
| Union County | 26,629 | $40,008 | 5.5% | 52/sq mi | 514 sq mi | Union |
| Williamsburg County | 29,891 | $43,711 | 6.4% | 32/sq mi | 934 sq mi | Kingstree |
| York County | 298,320 | $82,495 | 3.9% | 438/sq mi | 681 sq mi | York |
All 46 counties, sortable by any column — click a heading. A suppressed estimate (coefficient of variation ≥ 0.30) shows a marker, never a guess. County seats are from Wikidata (CC0), each validated to a Census place inside its county; a county with no validated seat is left blank. See the methodology.
Download & print this South Carolina map
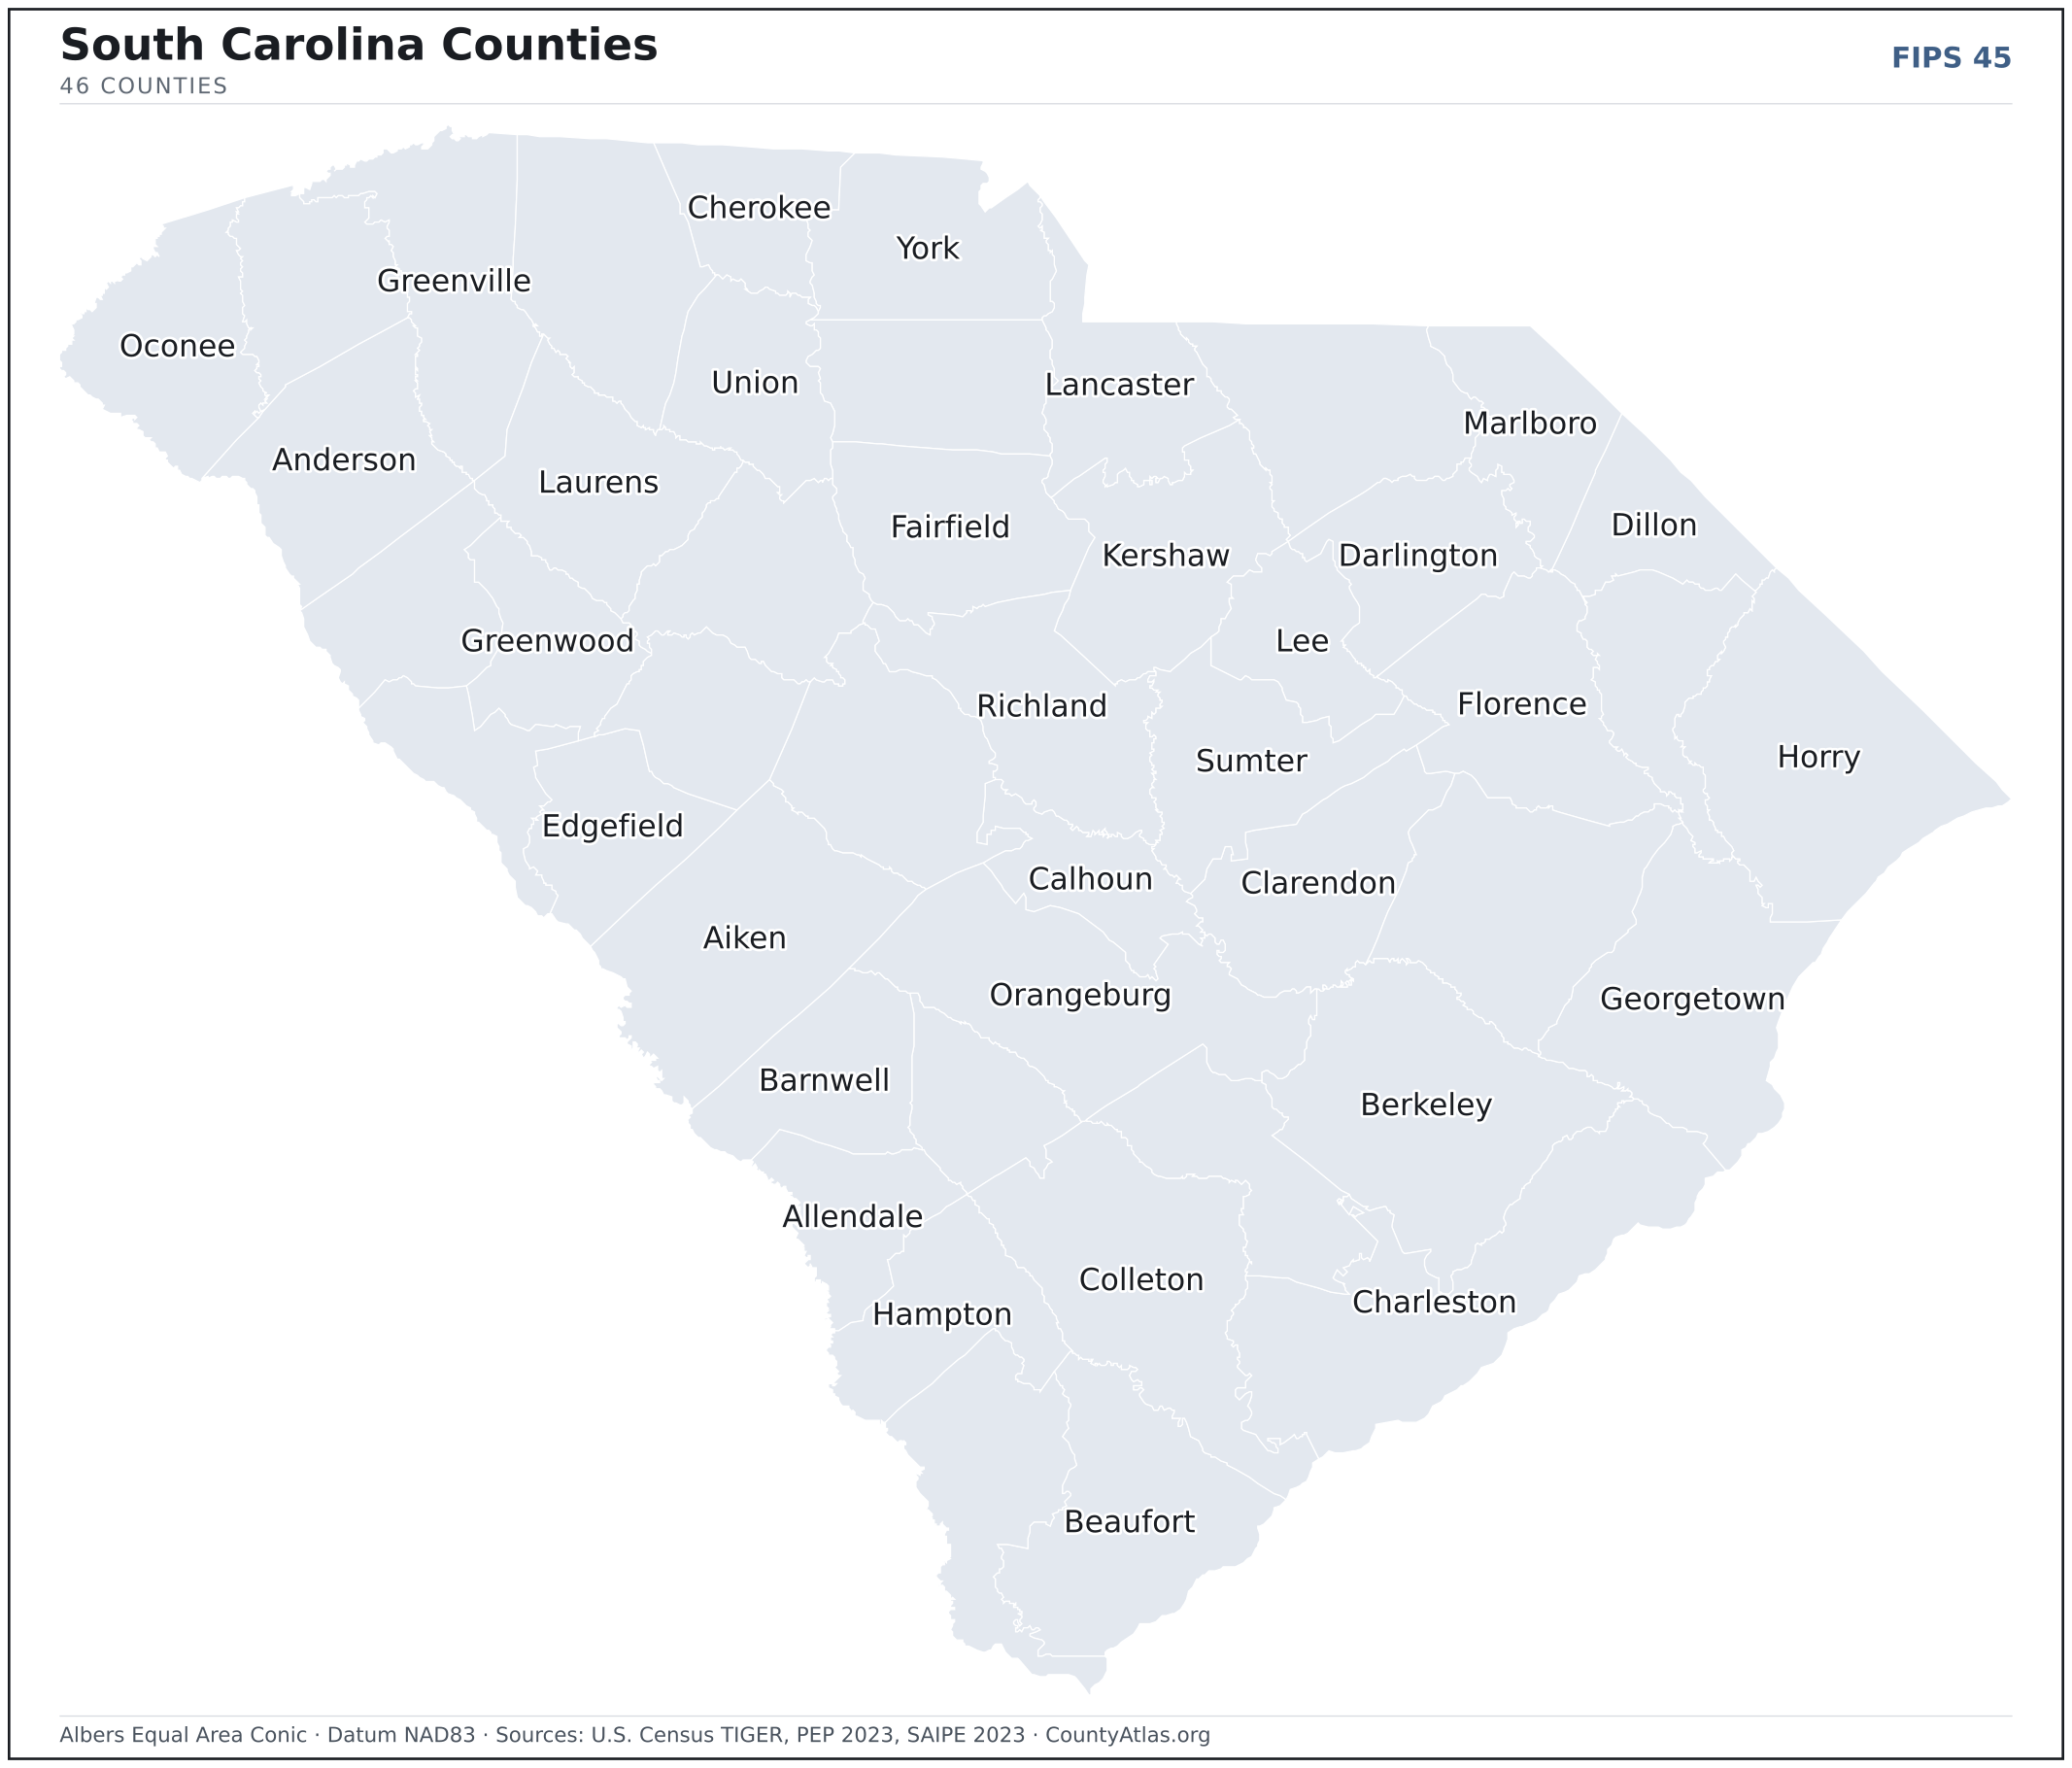
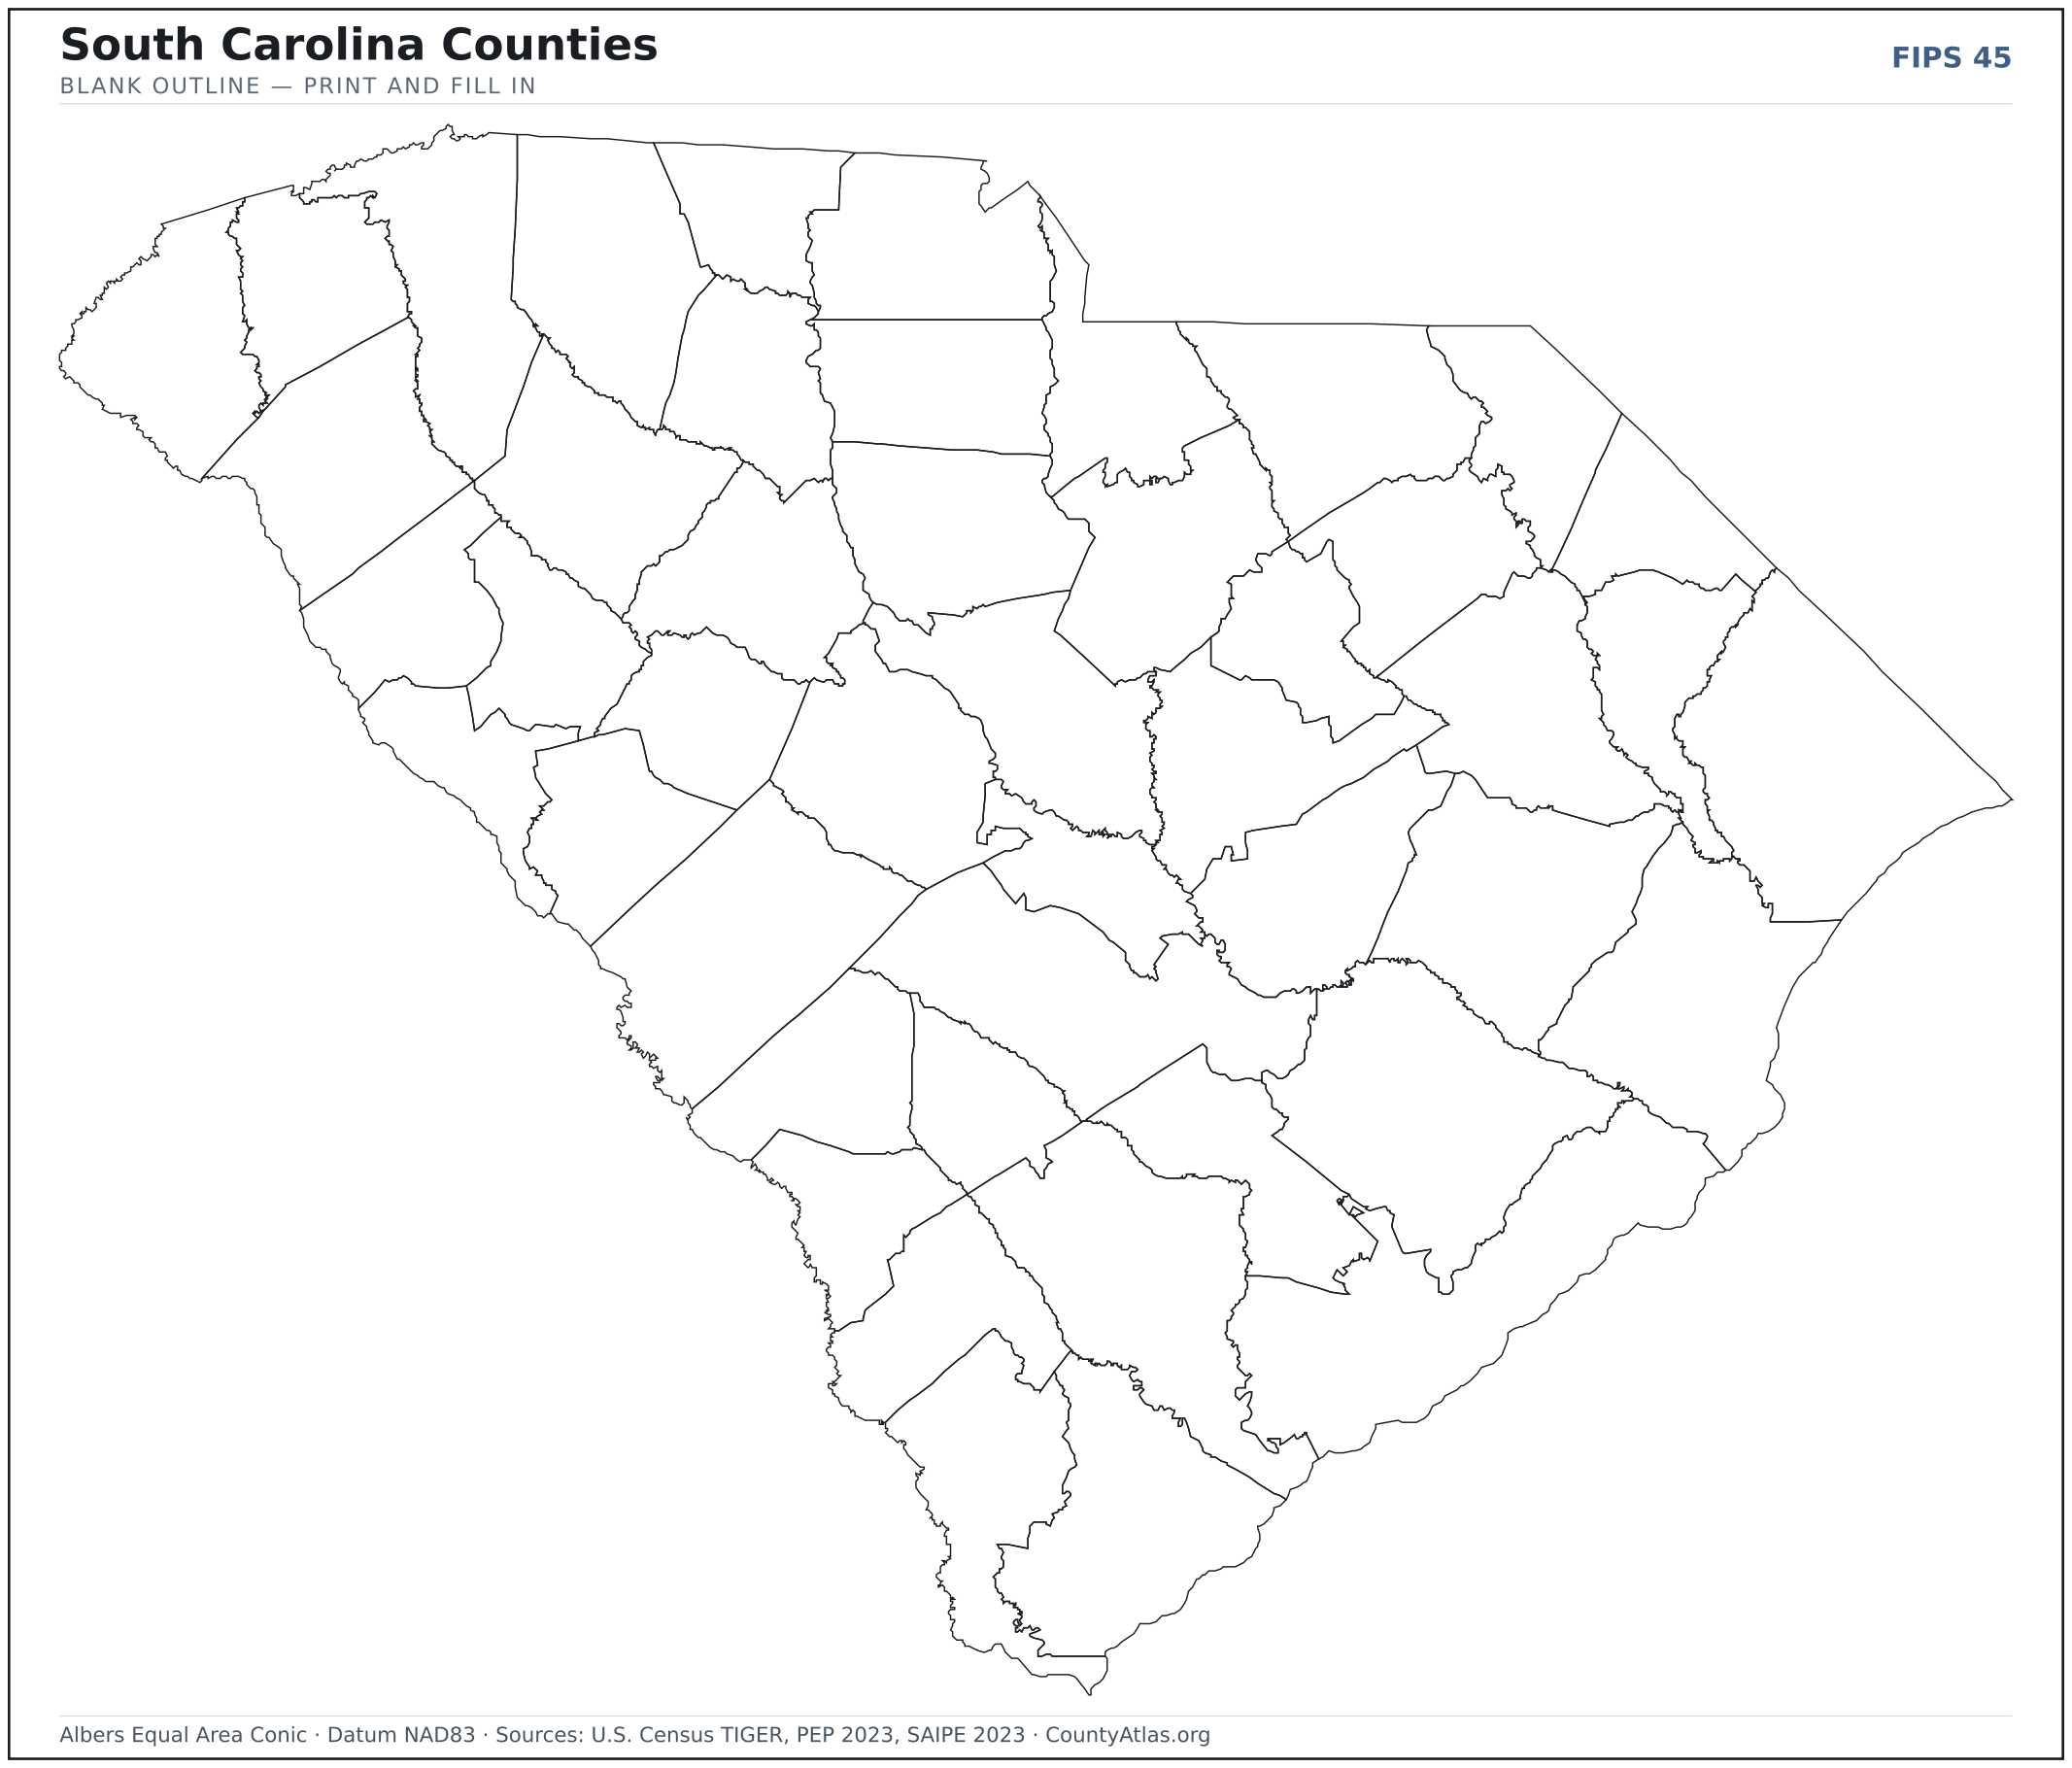
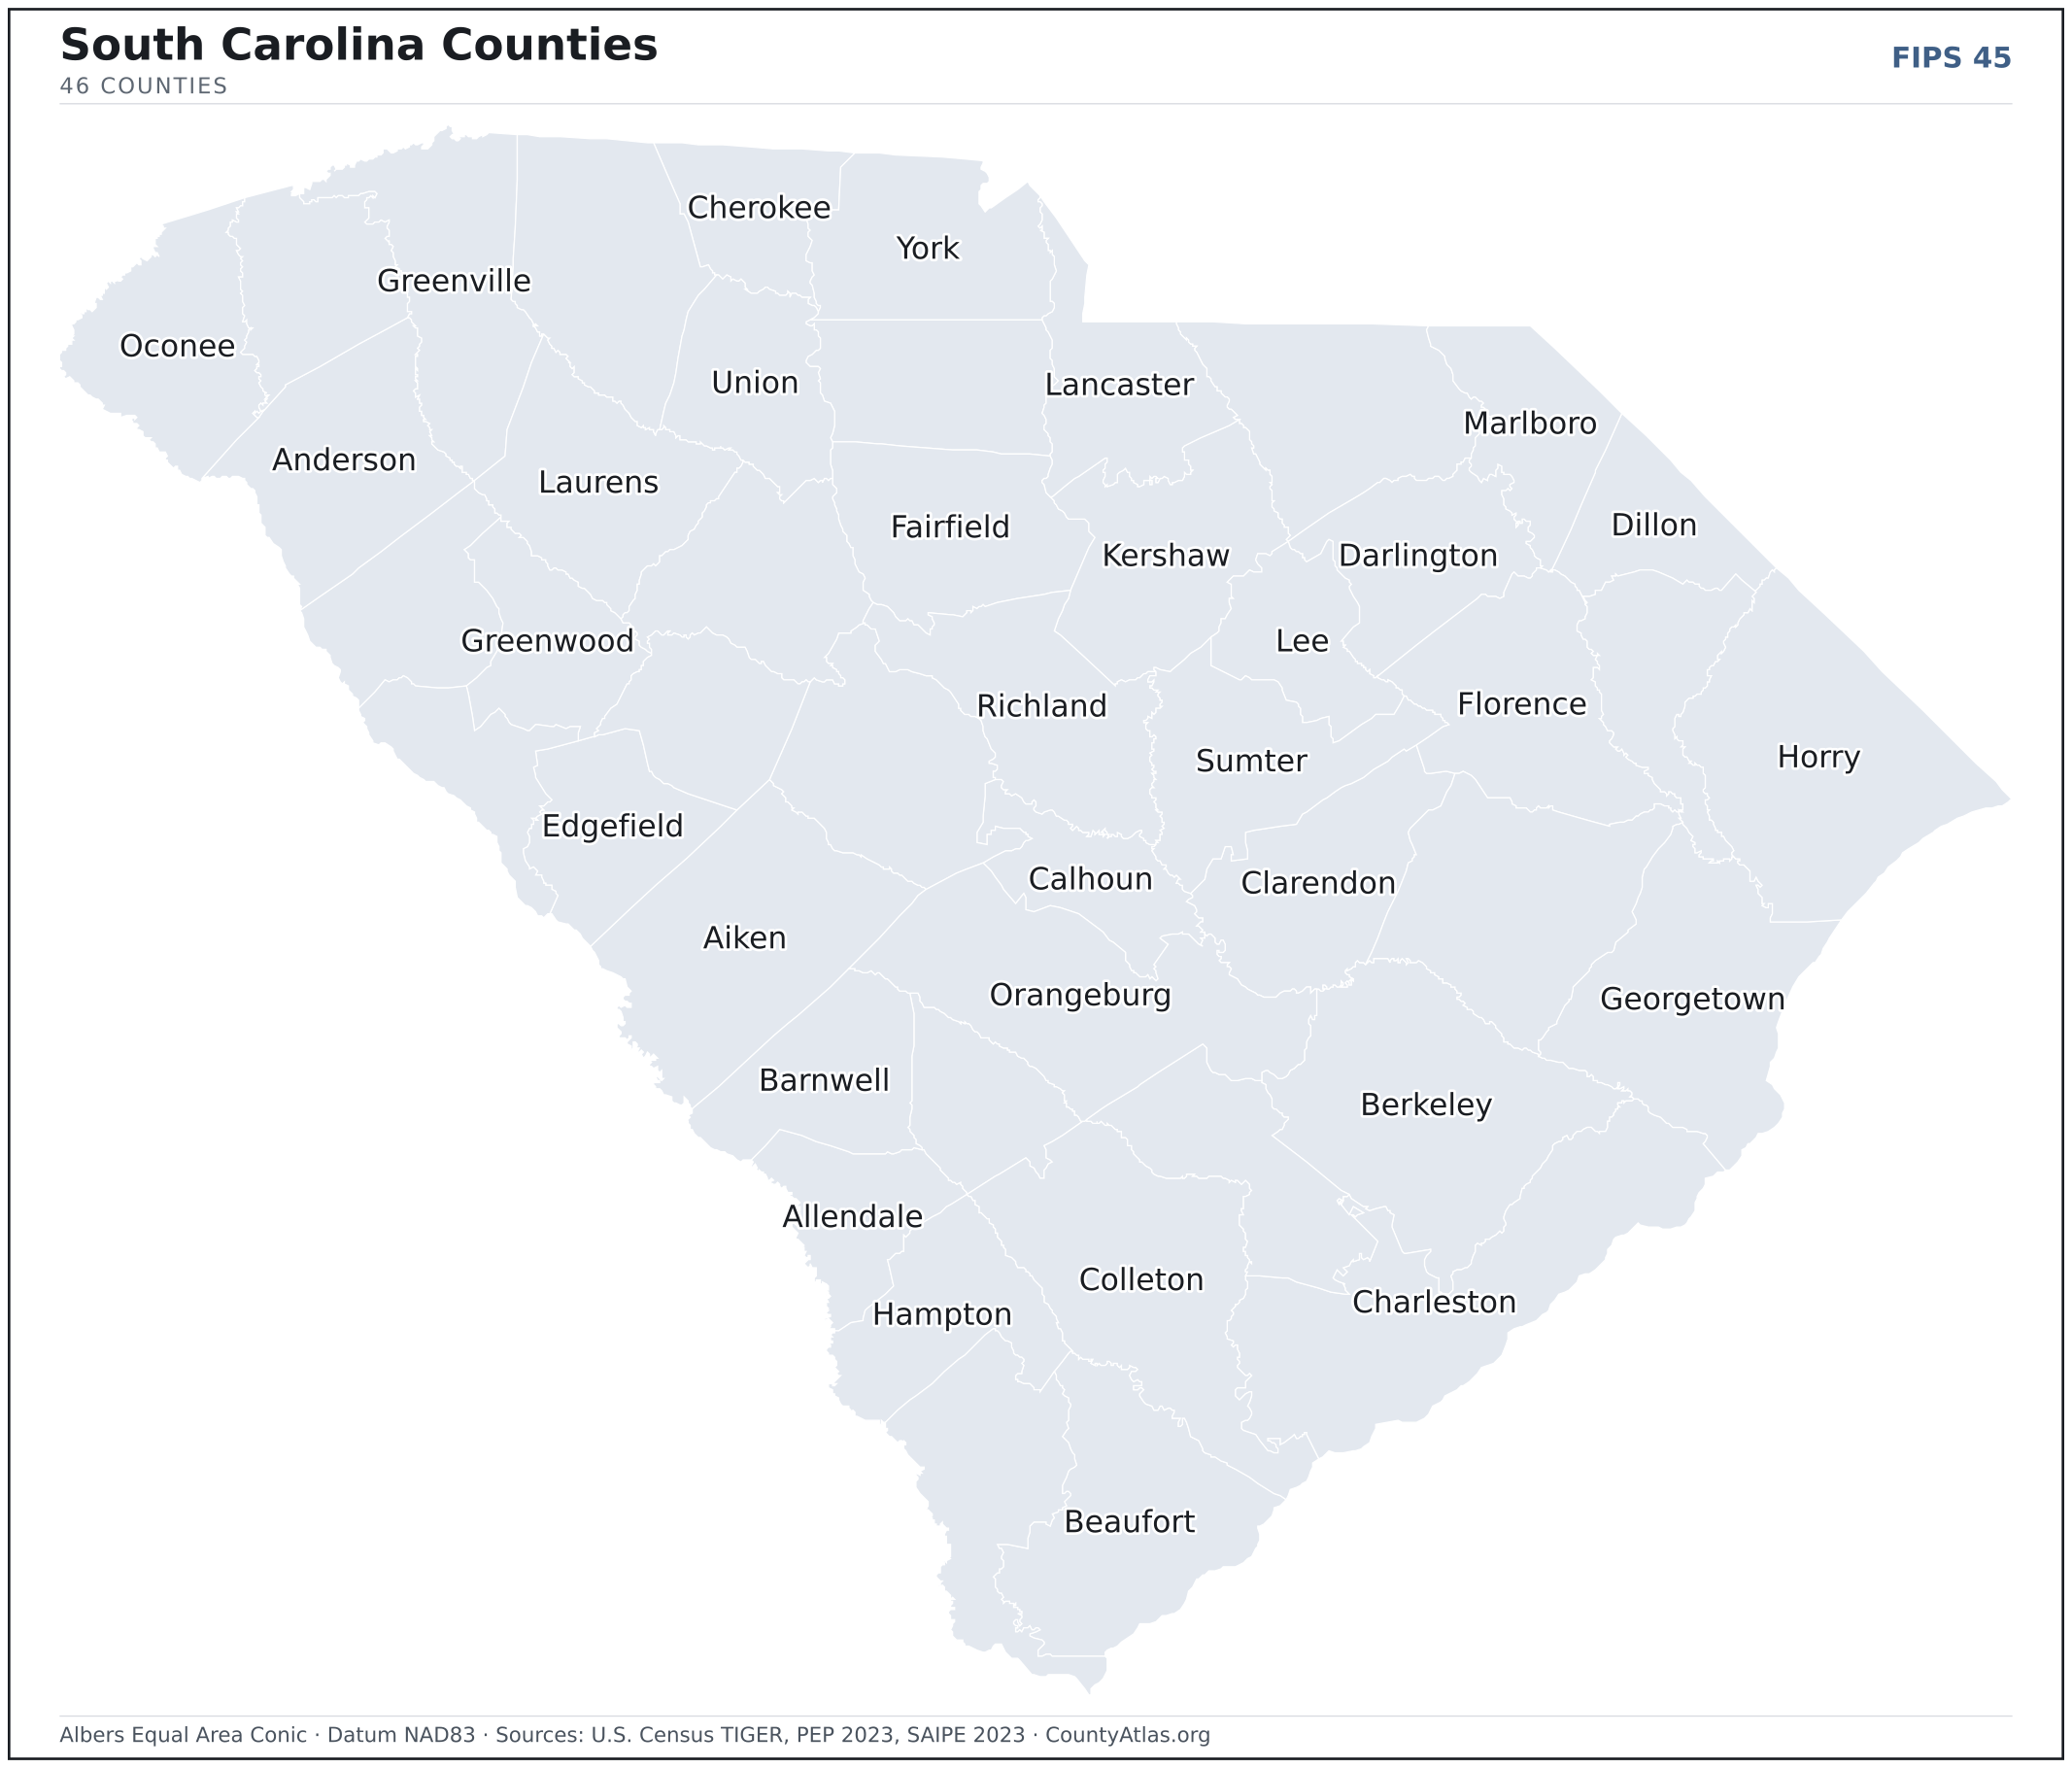
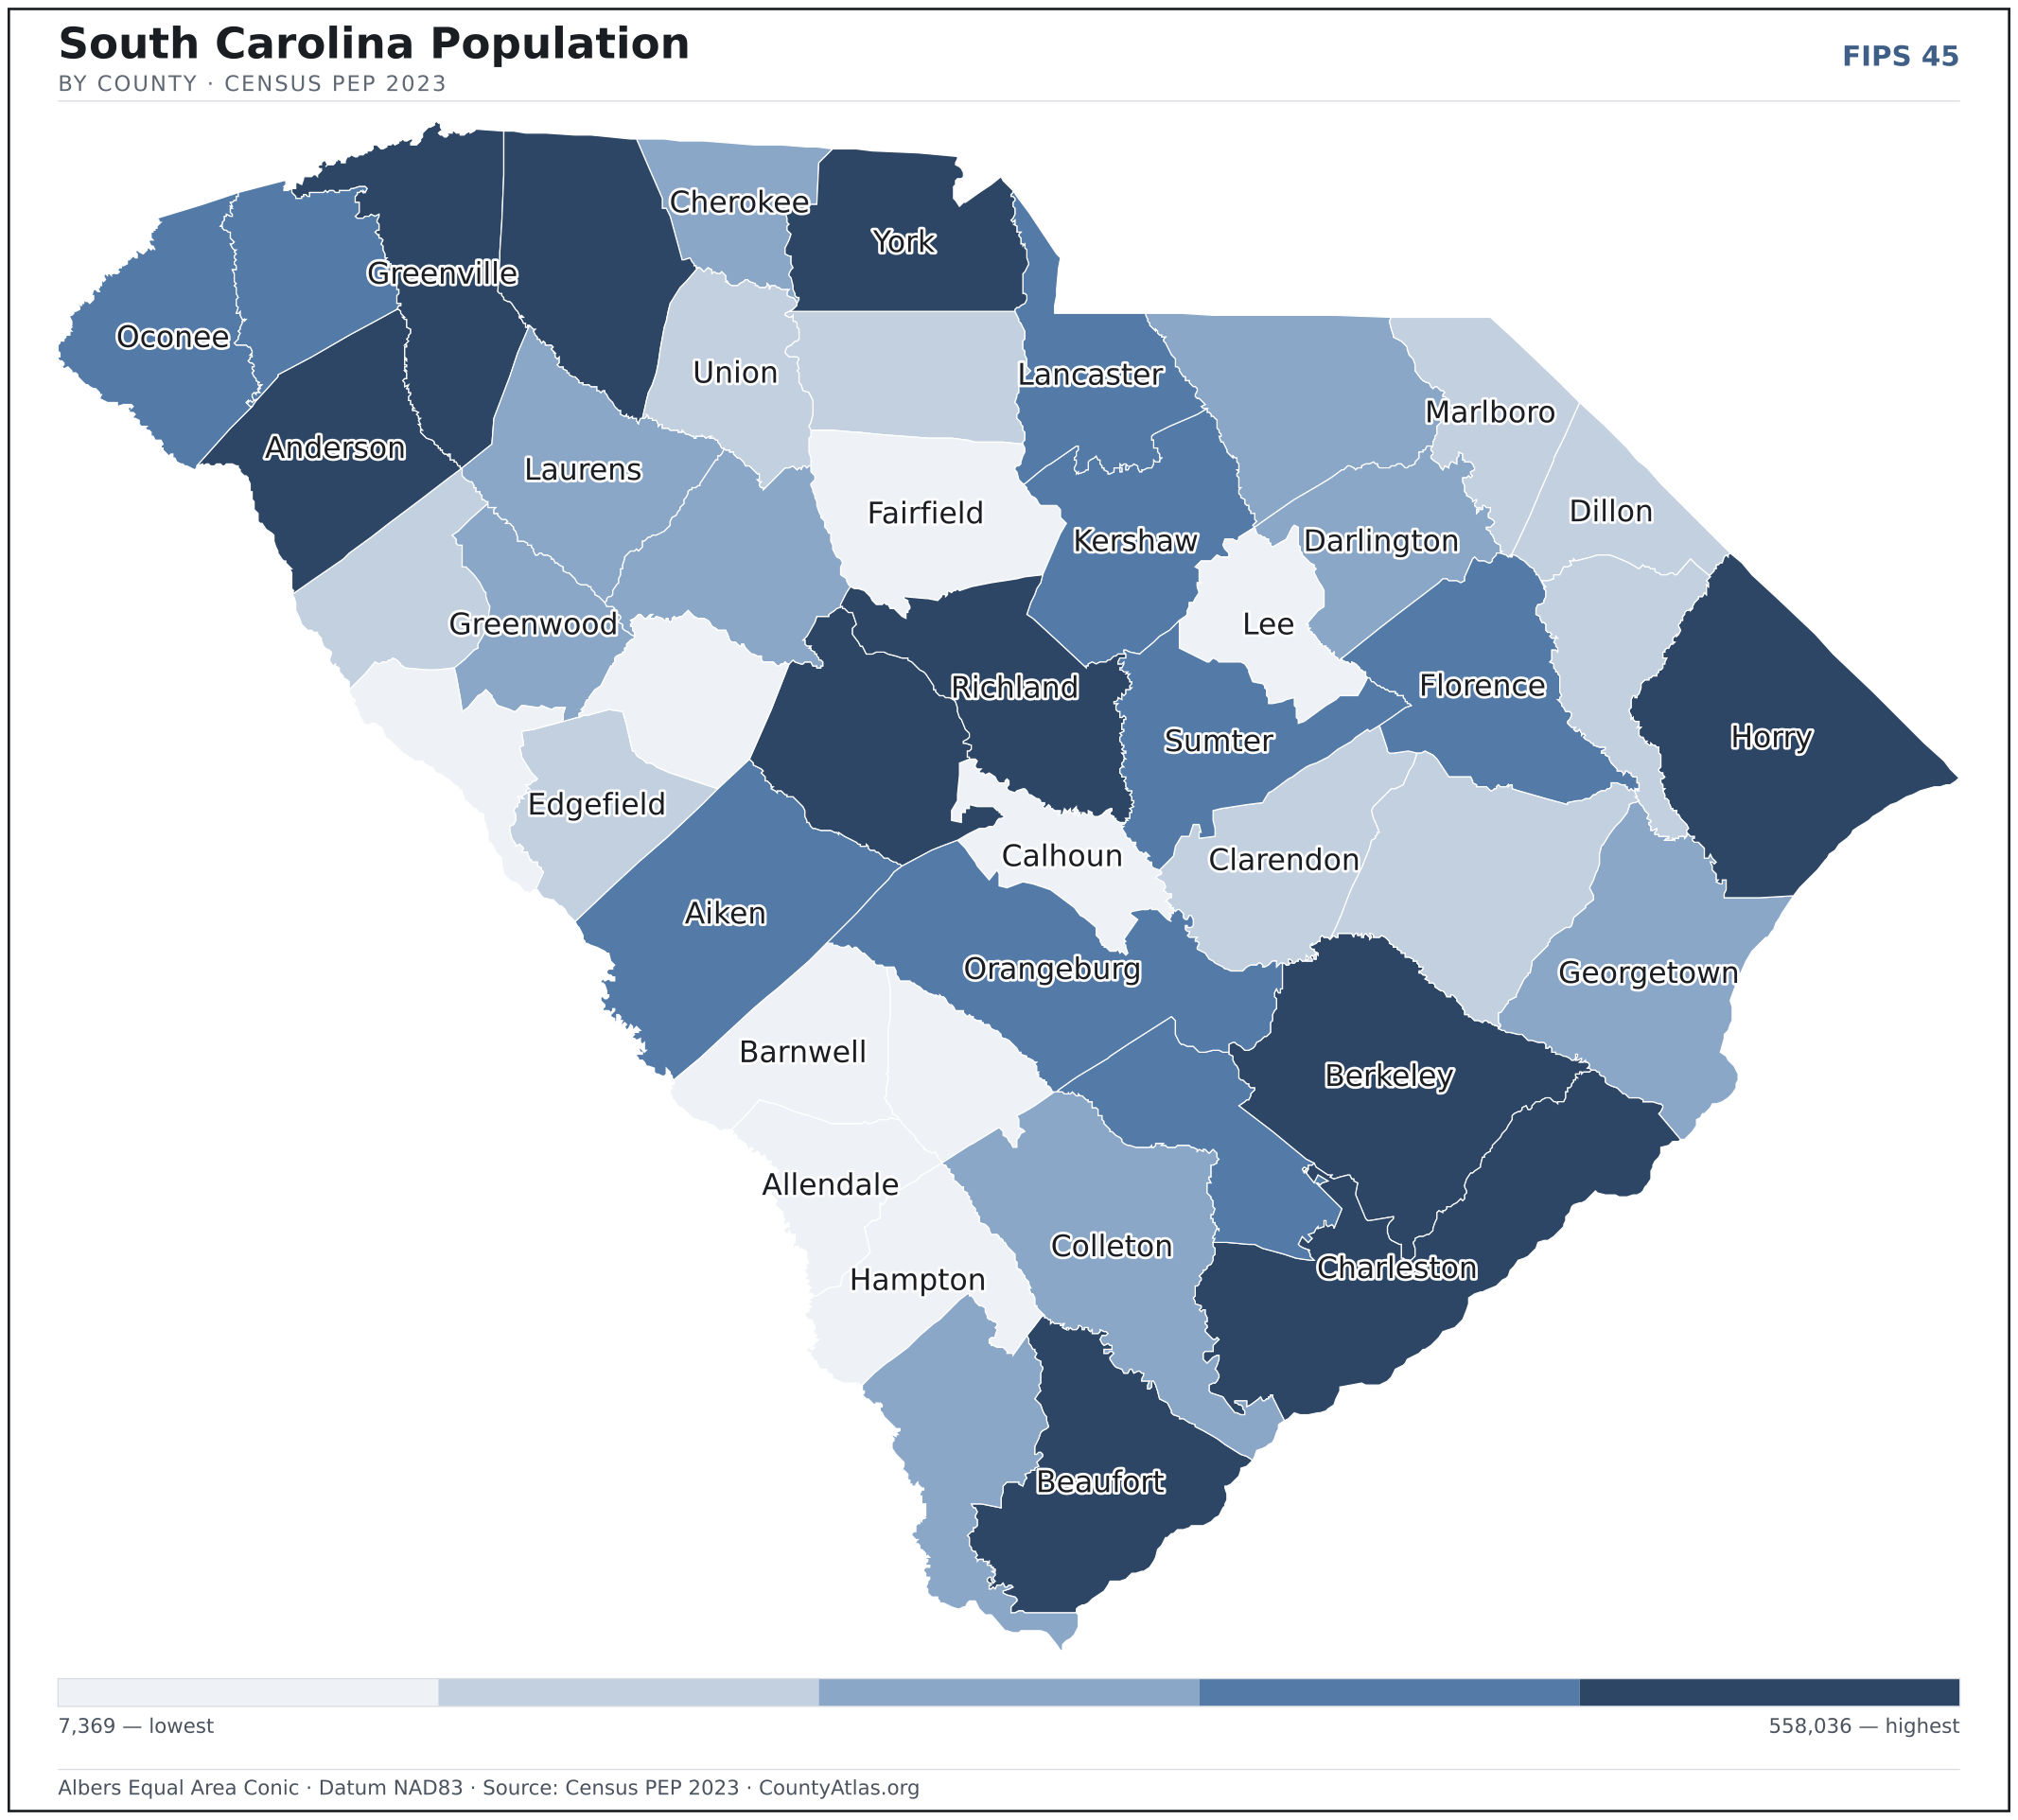
South Carolina maps, coloured by the data
Cities in South Carolina
South Carolina has 271 incorporated cities and towns. The largest is Charleston in Charleston County with 152,014 residents. Use the search on the map above to find any city and highlight the county it sits in.
| Charleston | Charleston County | 152,014 |
| Columbia | Richland County | 138,019 |
| North Charleston | Charleston County | 117,460 |
| Mount Pleasant (town) | Charleston County | 92,662 |
| Rock Hill | York County | 74,769 |
| Greenville | Greenville County | 71,755 |
| Summerville (town) | Dorchester County | 51,262 |
| Goose Creek | Berkeley County | 46,964 |
| Sumter | Sumter County | 43,065 |
| Florence | Florence County | 40,205 |
| Greer | Greenville County | 39,191 |
| Spartanburg | Spartanburg County | 38,578 |
| Hilton Head Island (town) | Beaufort County | 37,805 |
| Myrtle Beach | Horry County | 37,214 |
| Aiken | Aiken County | 32,334 |
| Bluffton (town) | Beaufort County | 31,323 |
| Anderson | Anderson County | 29,563 |
| Fort Mill (town) | York County | 28,281 |
| Conway | Horry County | 26,082 |
| Mauldin | Greenville County | 25,985 |
| Simpsonville | Greenville County | 25,125 |
| North Augusta | Aiken County | 24,928 |
| Lexington (town) | Lexington County | 24,132 |
| Easley | Pickens County | 23,942 |
| Greenwood | Greenwood County | 22,527 |
| Hanahan | Berkeley County | 21,119 |
| North Myrtle Beach | Horry County | 19,343 |
| Clemson | Pickens County | 17,759 |
| West Columbia | Lexington County | 17,723 |
| Port Royal (town) | Beaufort County | 15,047 |
| Moncks Corner (town) | Berkeley County | 14,362 |
| Cayce | Lexington County | 13,718 |
| Beaufort | Beaufort County | 13,660 |
| Tega Cay | York County | 13,267 |
| Orangeburg | Orangeburg County | 13,189 |
| Gaffney | Cherokee County | 12,612 |
| Irmo (town) | Richland County | 11,799 |
| James Island (town) | Charleston County | 11,738 |
| Fountain Inn | Greenville County | 11,307 |
| Newberry | Newberry County | 10,733 |
| Forest Acres | Richland County | 10,491 |
| Laurens | Laurens County | 9,307 |
| Hardeeville | Jasper County | 9,293 |
| Seneca | Oconee County | 8,910 |
| Lancaster | Lancaster County | 8,738 |
| York | York County | 8,697 |
| Georgetown | Georgetown County | 8,511 |
| Travelers Rest | Greenville County | 8,137 |
| Union | Union County | 8,047 |
| Camden | Kershaw County | 8,025 |
Showing the 50 most populous — and 221 more. Search the map above for any South Carolina city or village.
A city can span more than one county; each is listed in its primary county — the one its center falls in.
Which South Carolina county is the richest, largest, most crowded? The answers
- South Carolina’s highest median household income is in Charleston County ($88,111); the lowest is in Allendale County ($35,477). Census SAIPE 2023
- South Carolina’s most populous county is Greenville County (558,036); the least populous is Allendale County (7,369) — a 76× spread. Census PEP 2023
- South Carolina’s largest county by land area is Horry County (1,133 sq mi); the smallest is McCormick County (359 sq mi). Census TIGER
- South Carolina’s highest population density is in Greenville County (710/sq mi); the lowest is in Allendale County (18/sq mi). Census PEP 2023 · TIGER
- South Carolina’s highest poverty rate is in Allendale County (32.6%); the lowest is in Beaufort County (9.5%). Census SAIPE 2023
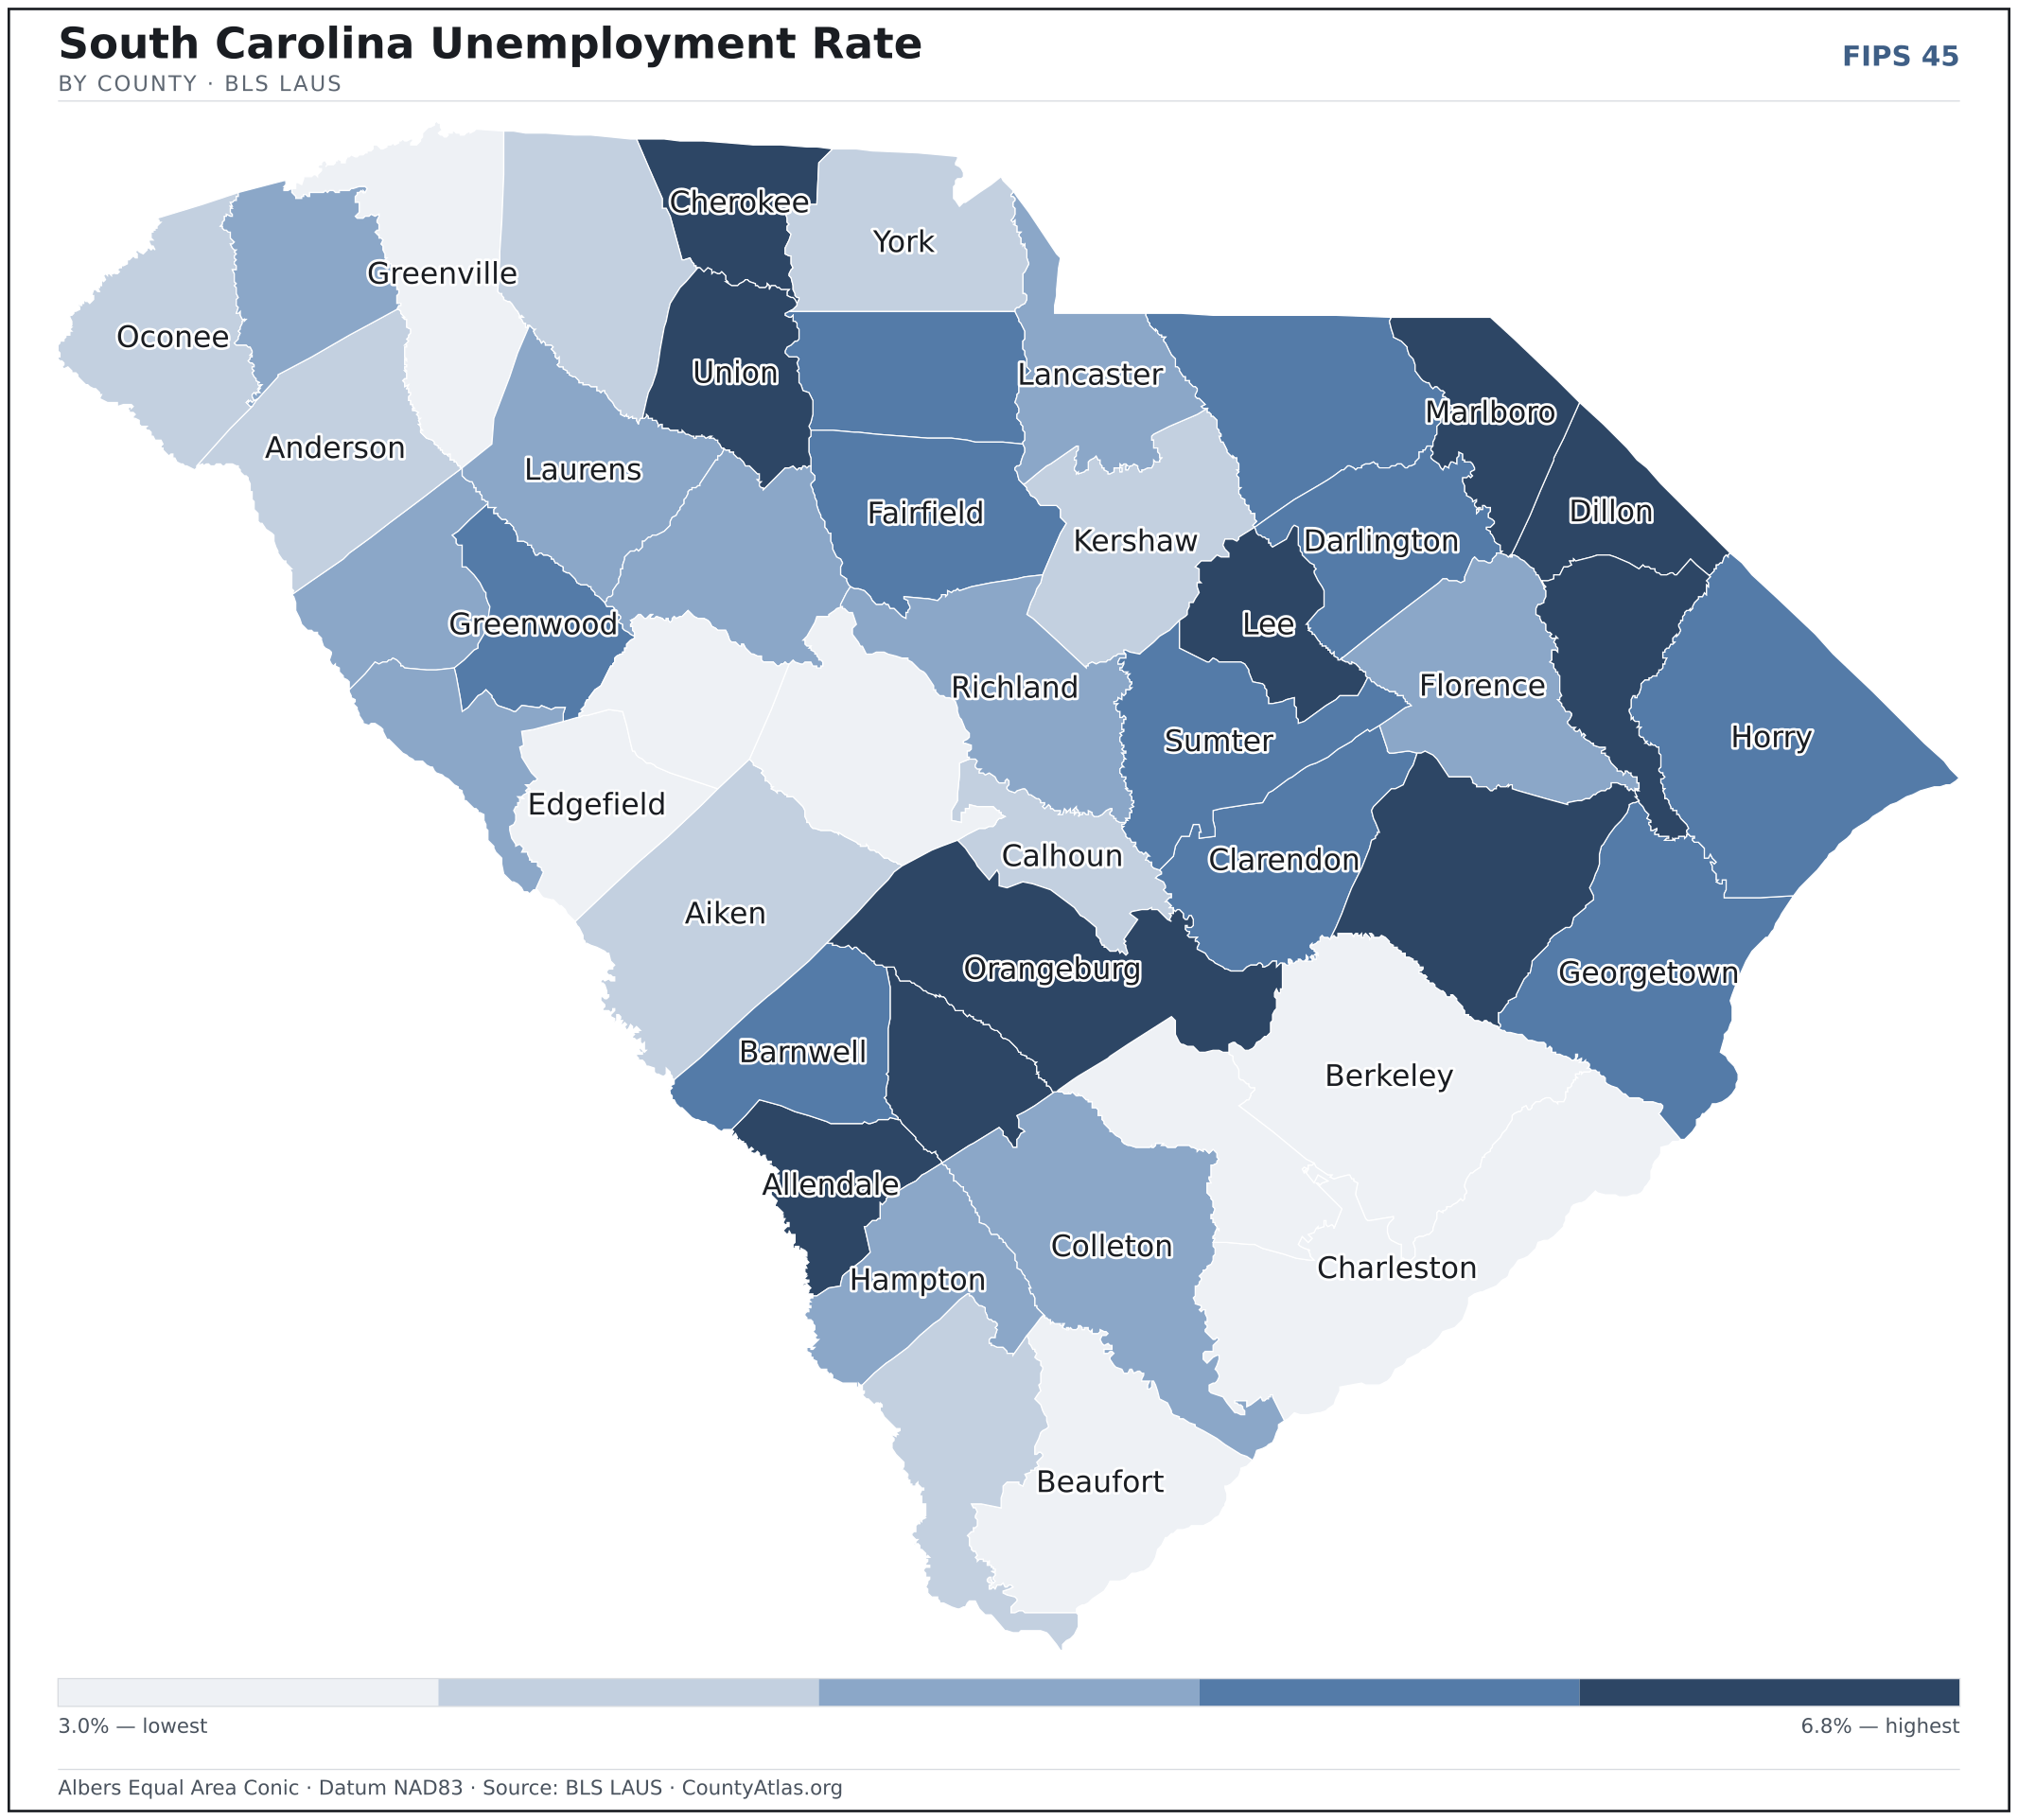
- In South Carolina, unemployment is highest in Marlboro County (6.8%) and lowest in Charleston County (3.0%), for May 2026. BLS LAUS
- South Carolina’s highest median age is in McCormick County (58.7); the lowest is in Richland County (34.2). Census ACS 2019–2023
- South Carolina’s highest share of bachelor’s degrees is in Charleston County (49.0% of adults); the lowest is in Marlboro County (8.7%). Census ACS 2019–2023
Every figure is a current official estimate from the source named — not a crowd-sourced or copied value. Suppressed estimates (coefficient of variation ≥ 0.30) are omitted, never guessed. See the full methodology.
South Carolina counties: common questions
How many counties are in South Carolina?
South Carolina has 46 counties covering 30,064 sq mi and about 5.4M residents. Every one is on the map above and in the table below.
What is the largest county in South Carolina?
It depends on the measure. By land area it’s Horry County (1,133 sq mi); by population it’s Greenville County (558,036 residents).
What county is Charleston in?
Charleston (population 152,014) is in Charleston County. Use the search on the map to find any South Carolina city’s county.
What is the richest county in South Carolina?
By median household income, Charleston County is the richest at $88,111; the poorest is Allendale County at $35,477 (Census SAIPE 2023).
What is the most populous county in South Carolina?
Greenville County, with 558,036 residents — about 10.4% of South Carolina’s people, and 76× the least populous, Allendale County (7,369).
Sources & vintages
- Population — PEP Vintage 2023 (July 1, 2023) — pep/charv
- Median household income & poverty — SAIPE 2023
- Unemployment — BLS LAUS May 2026 (preliminary)
- Geometry & boundaries — Census TIGERweb
- Cities & city population — Census TIGERweb Incorporated Places + ACS 5-year 2019–2023
Data current through .