CountyAtlas South Dakota
South Dakota County Map with Cities — All 66 Counties
All 66 of South Dakota's counties, mapped from official U.S. Census boundaries with population, income, and unemployment for every one. Colour the map by any measure, tap a county for its data, or download a print-ready copy.
Tap any county for its population, income, and more.
South Dakota at a glance
- Scale. South Dakota is divided into 66 counties across 75,809 sq mi of land — an average of 1,149 sq mi each. Census TIGER
- People. Its counties are home to 919,318 residents — an average of 13,929 each, or 12 per square mile statewide. Census PEP 2023
- Water. Another 1,307 sq mi is water — 1.7% of the state’s area, led by Dewey County. Census TIGER
South Dakota’s 66 counties, by the numbers
Every county’s population, median household income, unemployment, density, and land area — sortable by any column, so you can find yours or rank by what matters to you. A few patterns run through the data:
- Concentrated. Half of South Dakota’s 919,318 residents live in just 5 of 66 counties, and the five largest hold 51.1% of the total. Census PEP 2023
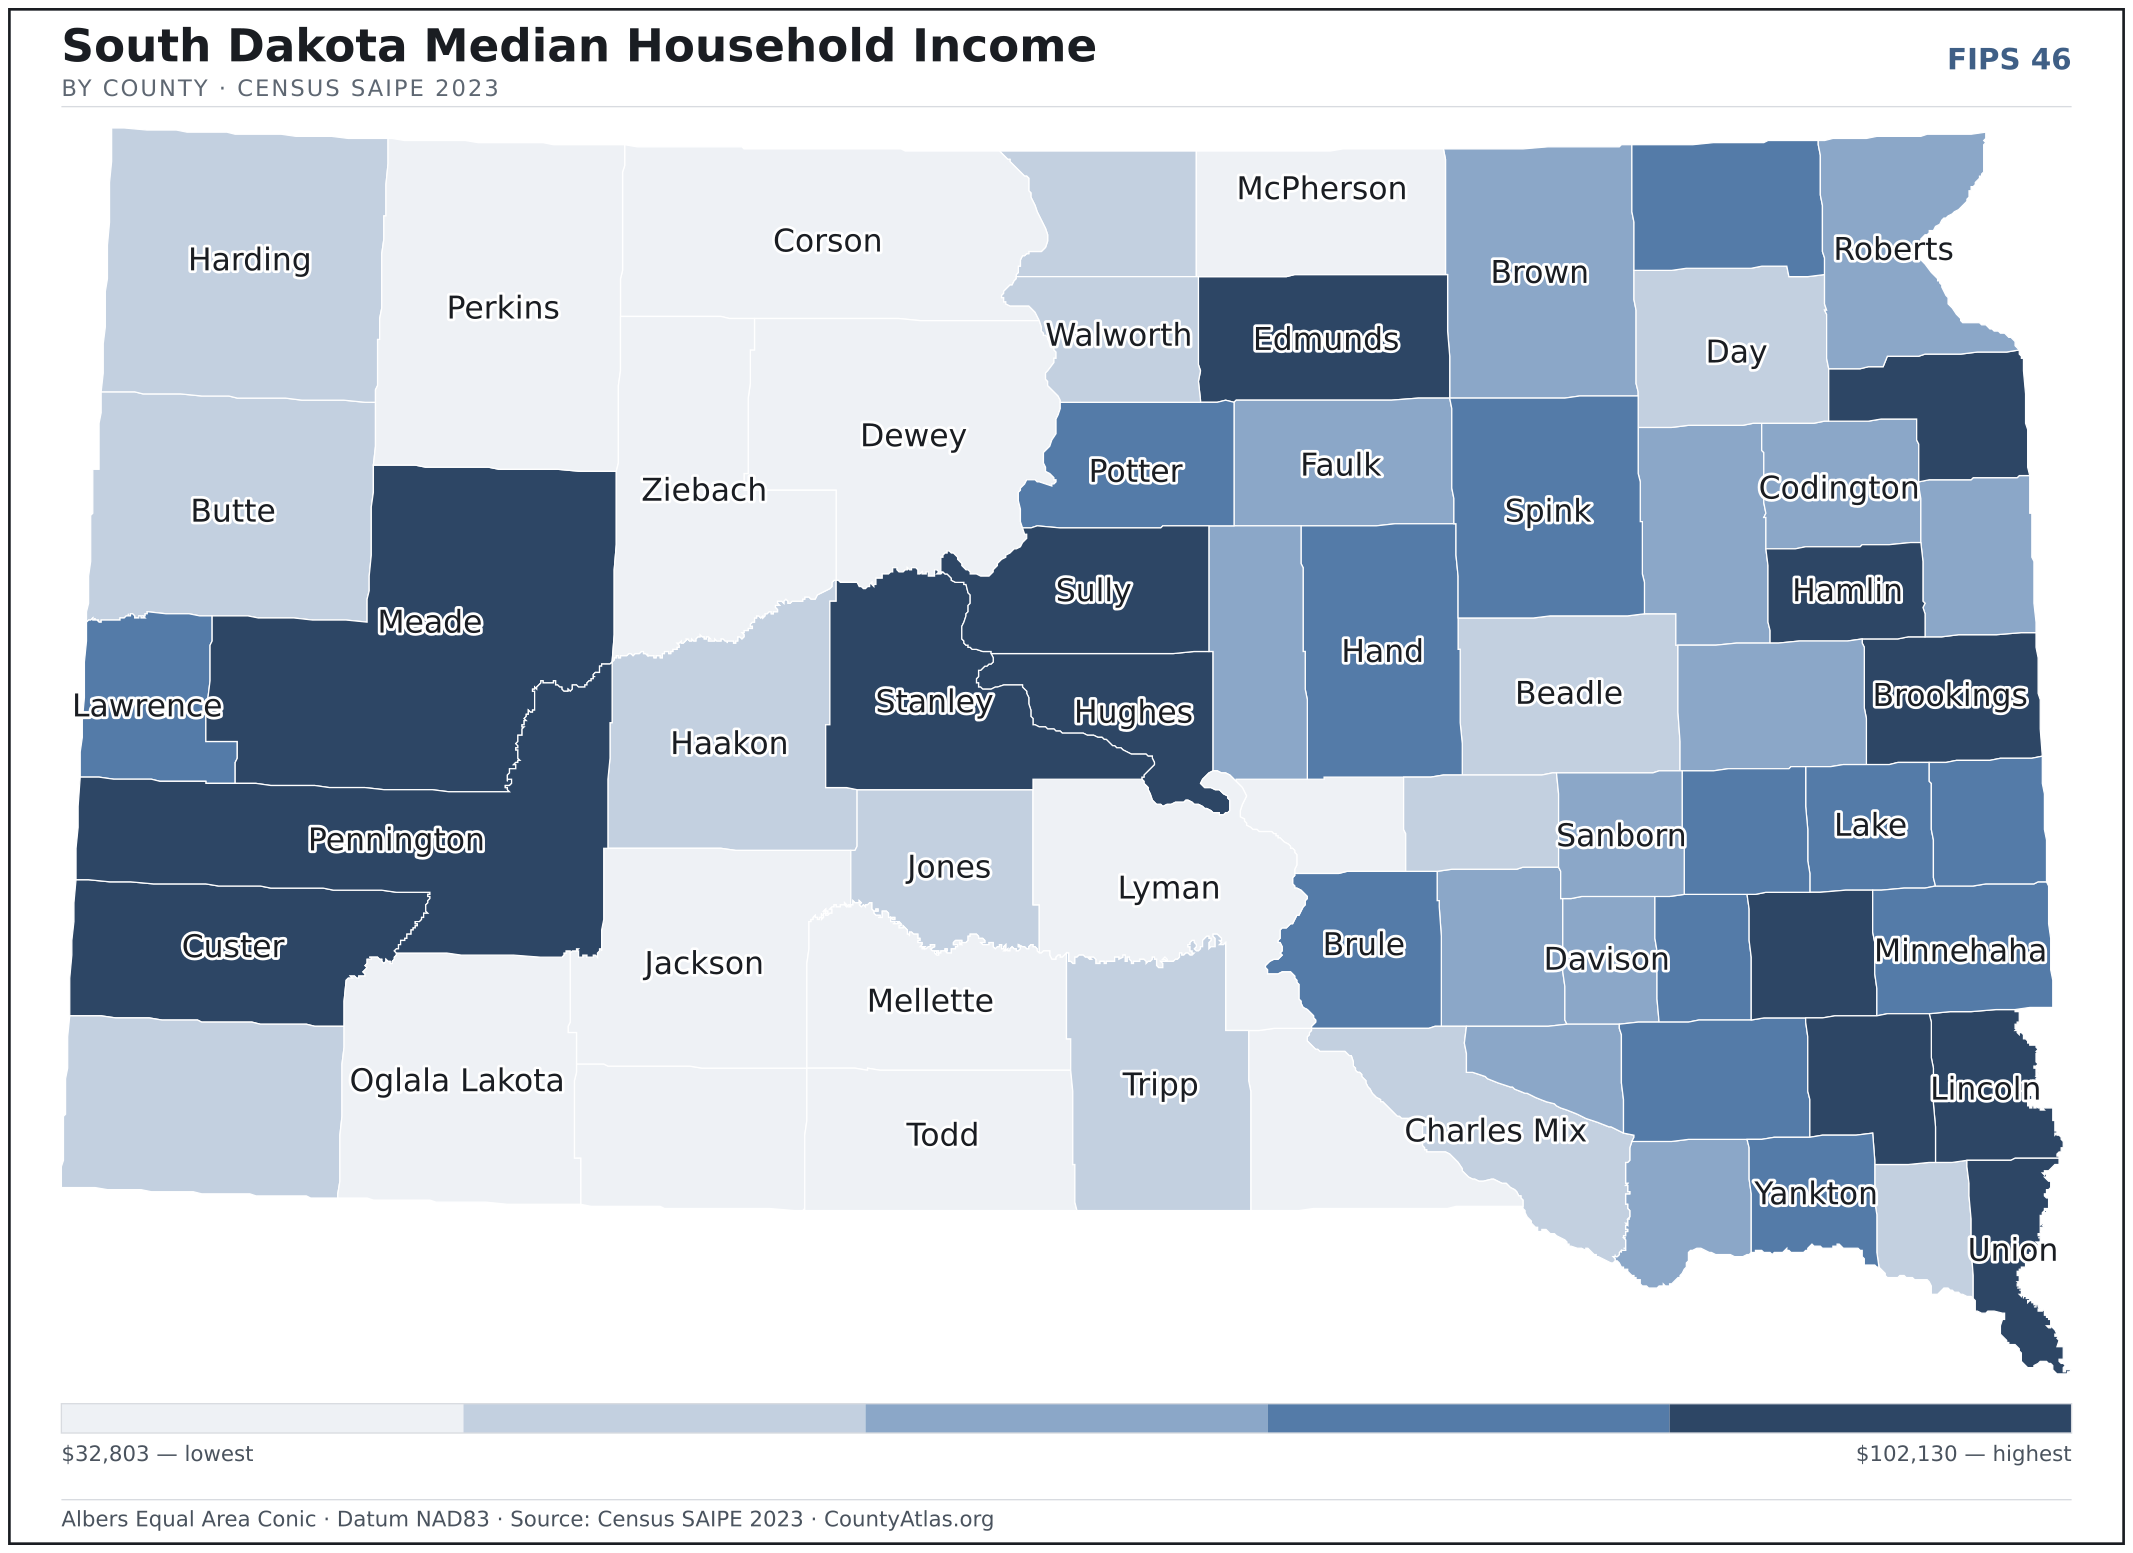
- Income tracks poverty. The gap from richest to poorest runs 3.1×, and the 10 highest-income counties average 7.9% in poverty against 31.0% for the 10 lowest. Census SAIPE 2023
- Mostly small. Half of South Dakota’s counties have fewer than 5,294 residents, and half report a median household income below $67,180 — a few metros lift the statewide totals well above both. Census PEP 2023 · SAIPE 2023
- Lopsided density. Only 18 of 66 counties are denser than South Dakota’s statewide average of 12 people per square mile — the rest are more rural. Census PEP 2023 · TIGER
| Aurora County | 2,782 | $66,789 | 1.6% | 4/sq mi | 708 sq mi | Plankinton |
| Beadle County | 19,591 | $59,721 | 1.8% | 16/sq mi | 1,259 sq mi | Huron |
| Bennett County | 3,305 | $48,547 | 2.6% | 3/sq mi | 1,185 sq mi | Martin |
| Bon Homme County | 7,065 | $67,069 | 1.9% | 13/sq mi | 564 sq mi | Tyndall |
| Brookings County | 35,980 | $75,209 | 1.9% | 45/sq mi | 792 sq mi | Brookings |
| Brown County | 37,733 | $67,491 | 1.7% | 22/sq mi | 1,713 sq mi | Aberdeen |
| Brule County | 5,311 | $69,383 | 1.5% | 6/sq mi | 817 sq mi | Chamberlain |
| Buffalo County | 1,884 | $32,803 | 3.1% | 4/sq mi | 471 sq mi | Gann Valley |
| Butte County | 10,863 | $62,368 | 1.8% | 5/sq mi | 2,250 sq mi | Belle Fourche |
| Campbell County | 1,340 | $64,367 | 2.0% | 2/sq mi | 734 sq mi | Mound City |
| Charles Mix County | 9,240 | $59,721 | 1.9% | 8/sq mi | 1,097 sq mi | Lake Andes |
| Clark County | 3,948 | $65,768 | 1.8% | 4/sq mi | 958 sq mi | Clark |
| Clay County | 15,431 | $63,752 | 2.3% | 37/sq mi | 412 sq mi | Vermillion |
| Codington County | 28,971 | $66,288 | 1.6% | 42/sq mi | 688 sq mi | Watertown |
| Corson County | 3,782 | $42,911 | 2.8% | 2/sq mi | 2,470 sq mi | McIntosh |
| Custer County | 9,117 | $76,579 | 1.9% | 6/sq mi | 1,557 sq mi | Custer |
| Davison County | 19,922 | $67,847 | 1.7% | 46/sq mi | 436 sq mi | Mitchell |
| Day County | 5,451 | $60,503 | 1.9% | 5/sq mi | 1,028 sq mi | Webster |
| Deuel County | 4,354 | $67,290 | 1.8% | 7/sq mi | 623 sq mi | Clear Lake |
| Dewey County | 5,208 | $48,477 | 3.0% | 2/sq mi | 2,302 sq mi | Timber Lake |
| Douglas County | 2,838 | $68,324 | 1.8% | 7/sq mi | 432 sq mi | Armour |
| Edmunds County | 4,057 | $74,870 | 1.8% | 4/sq mi | 1,126 sq mi | Ipswich |
| Fall River County | 7,393 | $58,834 | 2.5% | 4/sq mi | 1,740 sq mi | Hot Springs |
| Faulk County | 2,151 | $66,810 | 1.7% | 2/sq mi | 982 sq mi | Faulkton |
| Grant County | 7,553 | $73,409 | 1.8% | 11/sq mi | 681 sq mi | Milbank |
| Gregory County | 4,018 | $54,134 | 2.0% | 4/sq mi | 1,015 sq mi | Burke |
| Haakon County | 1,851 | $62,682 | 1.7% | 1/sq mi | 1,811 sq mi | Philip |
| Hamlin County | 6,451 | $87,571 | 1.5% | 13/sq mi | 507 sq mi | Hayti |
| Hand County | 3,107 | $69,681 | 1.6% | 2/sq mi | 1,437 sq mi | Miller |
| Hanson County | 3,471 | $72,307 | 2.0% | 8/sq mi | 435 sq mi | Alexandria |
| Harding County | 1,324 | $59,255 | 1.3% | 0/sq mi | 2,672 sq mi | Buffalo |
| Hughes County | 17,624 | $75,885 | 1.6% | 24/sq mi | 742 sq mi | Pierre |
| Hutchinson County | 7,394 | $68,648 | 1.5% | 9/sq mi | 813 sq mi | Olivet |
| Hyde County | 1,186 | $66,253 | 1.5% | 1/sq mi | 861 sq mi | Highmore |
| Jackson County | 2,776 | $47,946 | 2.9% | 1/sq mi | 1,864 sq mi | Kadoka |
| Jerauld County | 1,660 | $57,613 | 1.7% | 3/sq mi | 526 sq mi | Wessington Springs |
| Jones County | 855 | $60,640 | 2.8% | 1/sq mi | 970 sq mi | Murdo |
| Kingsbury County | 5,276 | $67,518 | 1.7% | 6/sq mi | 832 sq mi | De Smet |
| Lake County | 11,031 | $70,136 | 1.8% | 20/sq mi | 563 sq mi | Madison |
| Lawrence County | 28,053 | $69,088 | 1.7% | 35/sq mi | 800 sq mi | Deadwood |
| Lincoln County | 73,238 | $102,130 | 1.7% | 127/sq mi | 577 sq mi | Canton |
| Lyman County | 3,705 | $55,274 | 1.9% | 2/sq mi | 1,642 sq mi | Kennebec |
| Marshall County | 4,390 | $69,480 | 1.5% | 5/sq mi | 838 sq mi | Britton |
| McCook County | 5,809 | $85,702 | 1.6% | 10/sq mi | 574 sq mi | Salem |
| McPherson County | 2,334 | $55,704 | 1.9% | 2/sq mi | 1,137 sq mi | Leola |
| Meade County | 30,954 | $74,577 | 1.9% | 9/sq mi | 3,471 sq mi | Sturgis |
| Mellette County | 1,851 | $48,596 | 2.4% | 1/sq mi | 1,307 sq mi | White River |
| Miner County | 2,280 | $69,943 | 2.0% | 4/sq mi | 570 sq mi | Howard |
| Minnehaha County | 206,930 | $73,277 | 1.8% | 256/sq mi | 807 sq mi | Sioux Falls |
| Moody County | 6,450 | $72,783 | 2.3% | 12/sq mi | 519 sq mi | Flandreau |
| Oglala Lakota County | 13,434 | $42,791 | 3.9% | 6/sq mi | 2,094 sq mi | — |
| Pennington County | 115,903 | $74,641 | 1.9% | 42/sq mi | 2,777 sq mi | Rapid City |
| Perkins County | 2,834 | $56,922 | 1.7% | 1/sq mi | 2,870 sq mi | Bison |
| Potter County | 2,413 | $70,243 | 2.5% | 3/sq mi | 861 sq mi | Gettysburg |
| Roberts County | 10,206 | $65,069 | 2.4% | 9/sq mi | 1,101 sq mi | Sisseton |
| Sanborn County | 2,399 | $67,523 | 1.5% | 4/sq mi | 569 sq mi | Woonsocket |
| Spink County | 6,166 | $69,262 | 1.8% | 4/sq mi | 1,504 sq mi | Redfield |
| Stanley County | 3,043 | $82,778 | 1.5% | 2/sq mi | 1,444 sq mi | Fort Pierre |
| Sully County | 1,494 | $74,496 | 1.5% | 1/sq mi | 1,007 sq mi | Onida |
| Todd County | 9,199 | $50,268 | 4.5% | 7/sq mi | 1,389 sq mi | — |
| Tripp County | 5,621 | $58,195 | 1.6% | 3/sq mi | 1,612 sq mi | Winner |
| Turner County | 9,027 | $75,454 | 1.7% | 15/sq mi | 617 sq mi | Parker |
| Union County | 17,183 | $97,016 | 2.0% | 37/sq mi | 462 sq mi | Elk Point |
| Walworth County | 5,269 | $57,426 | 1.9% | 7/sq mi | 707 sq mi | Selby |
| Yankton County | 23,517 | $73,061 | 1.8% | 45/sq mi | 521 sq mi | Yankton |
| Ziebach County | 2,322 | $42,254 | 2.5% | 1/sq mi | 1,961 sq mi | Dupree |
All 66 counties, sortable by any column — click a heading. A suppressed estimate (coefficient of variation ≥ 0.30) shows a marker, never a guess. County seats are from Wikidata (CC0), each validated to a Census place inside its county; a county with no validated seat is left blank. See the methodology.
Download & print this South Dakota map
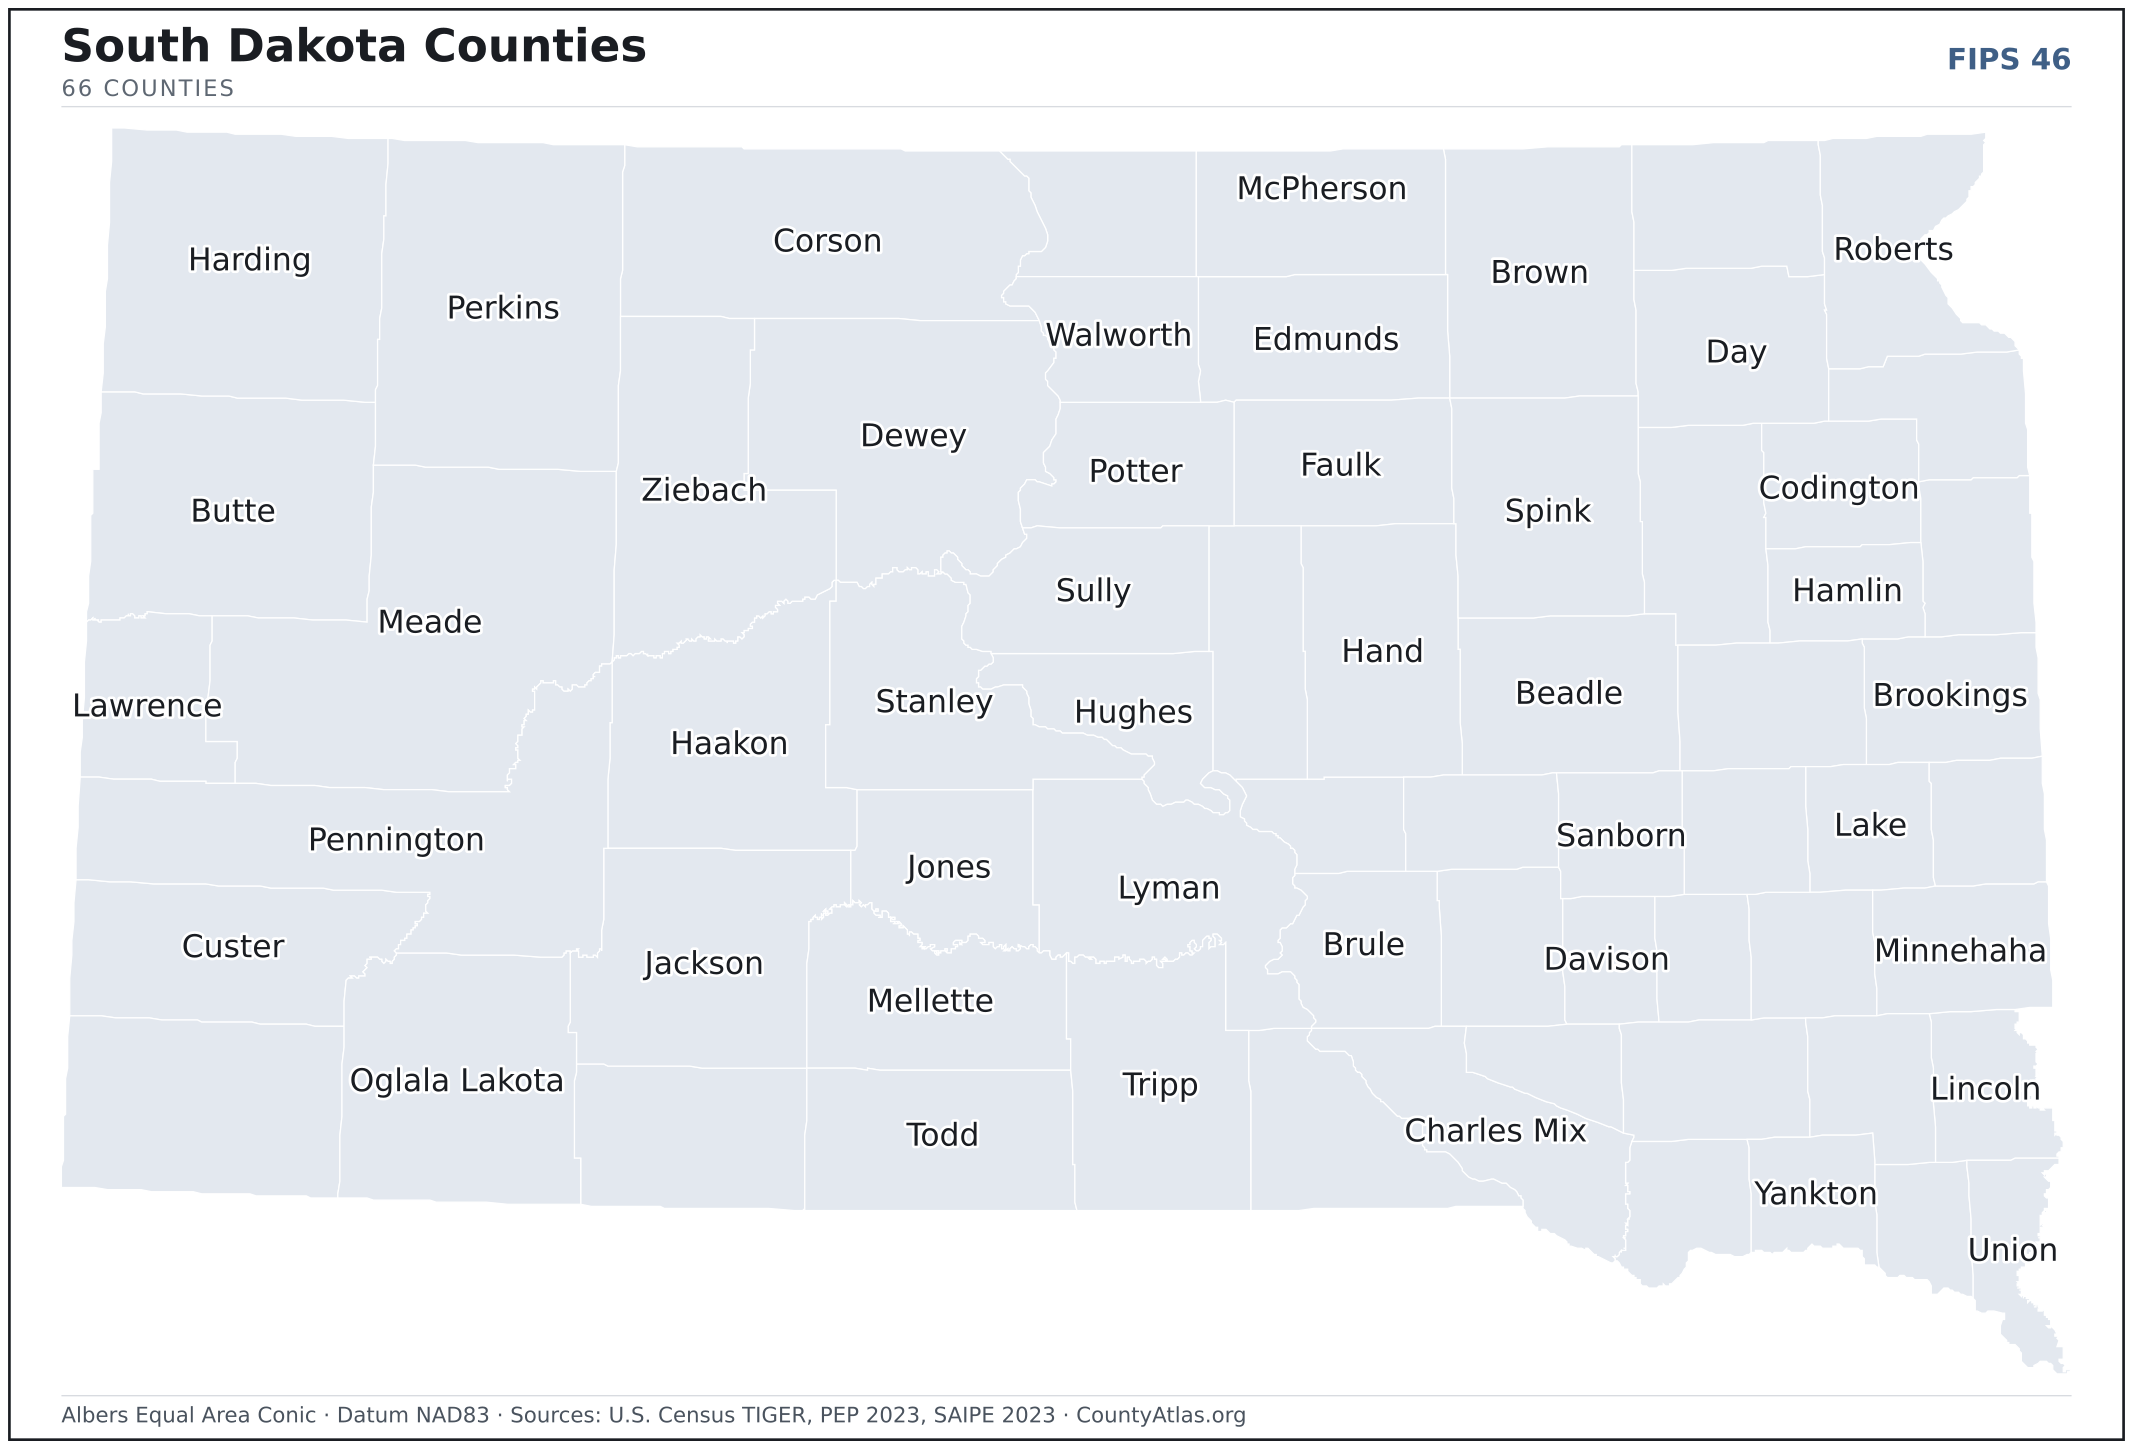
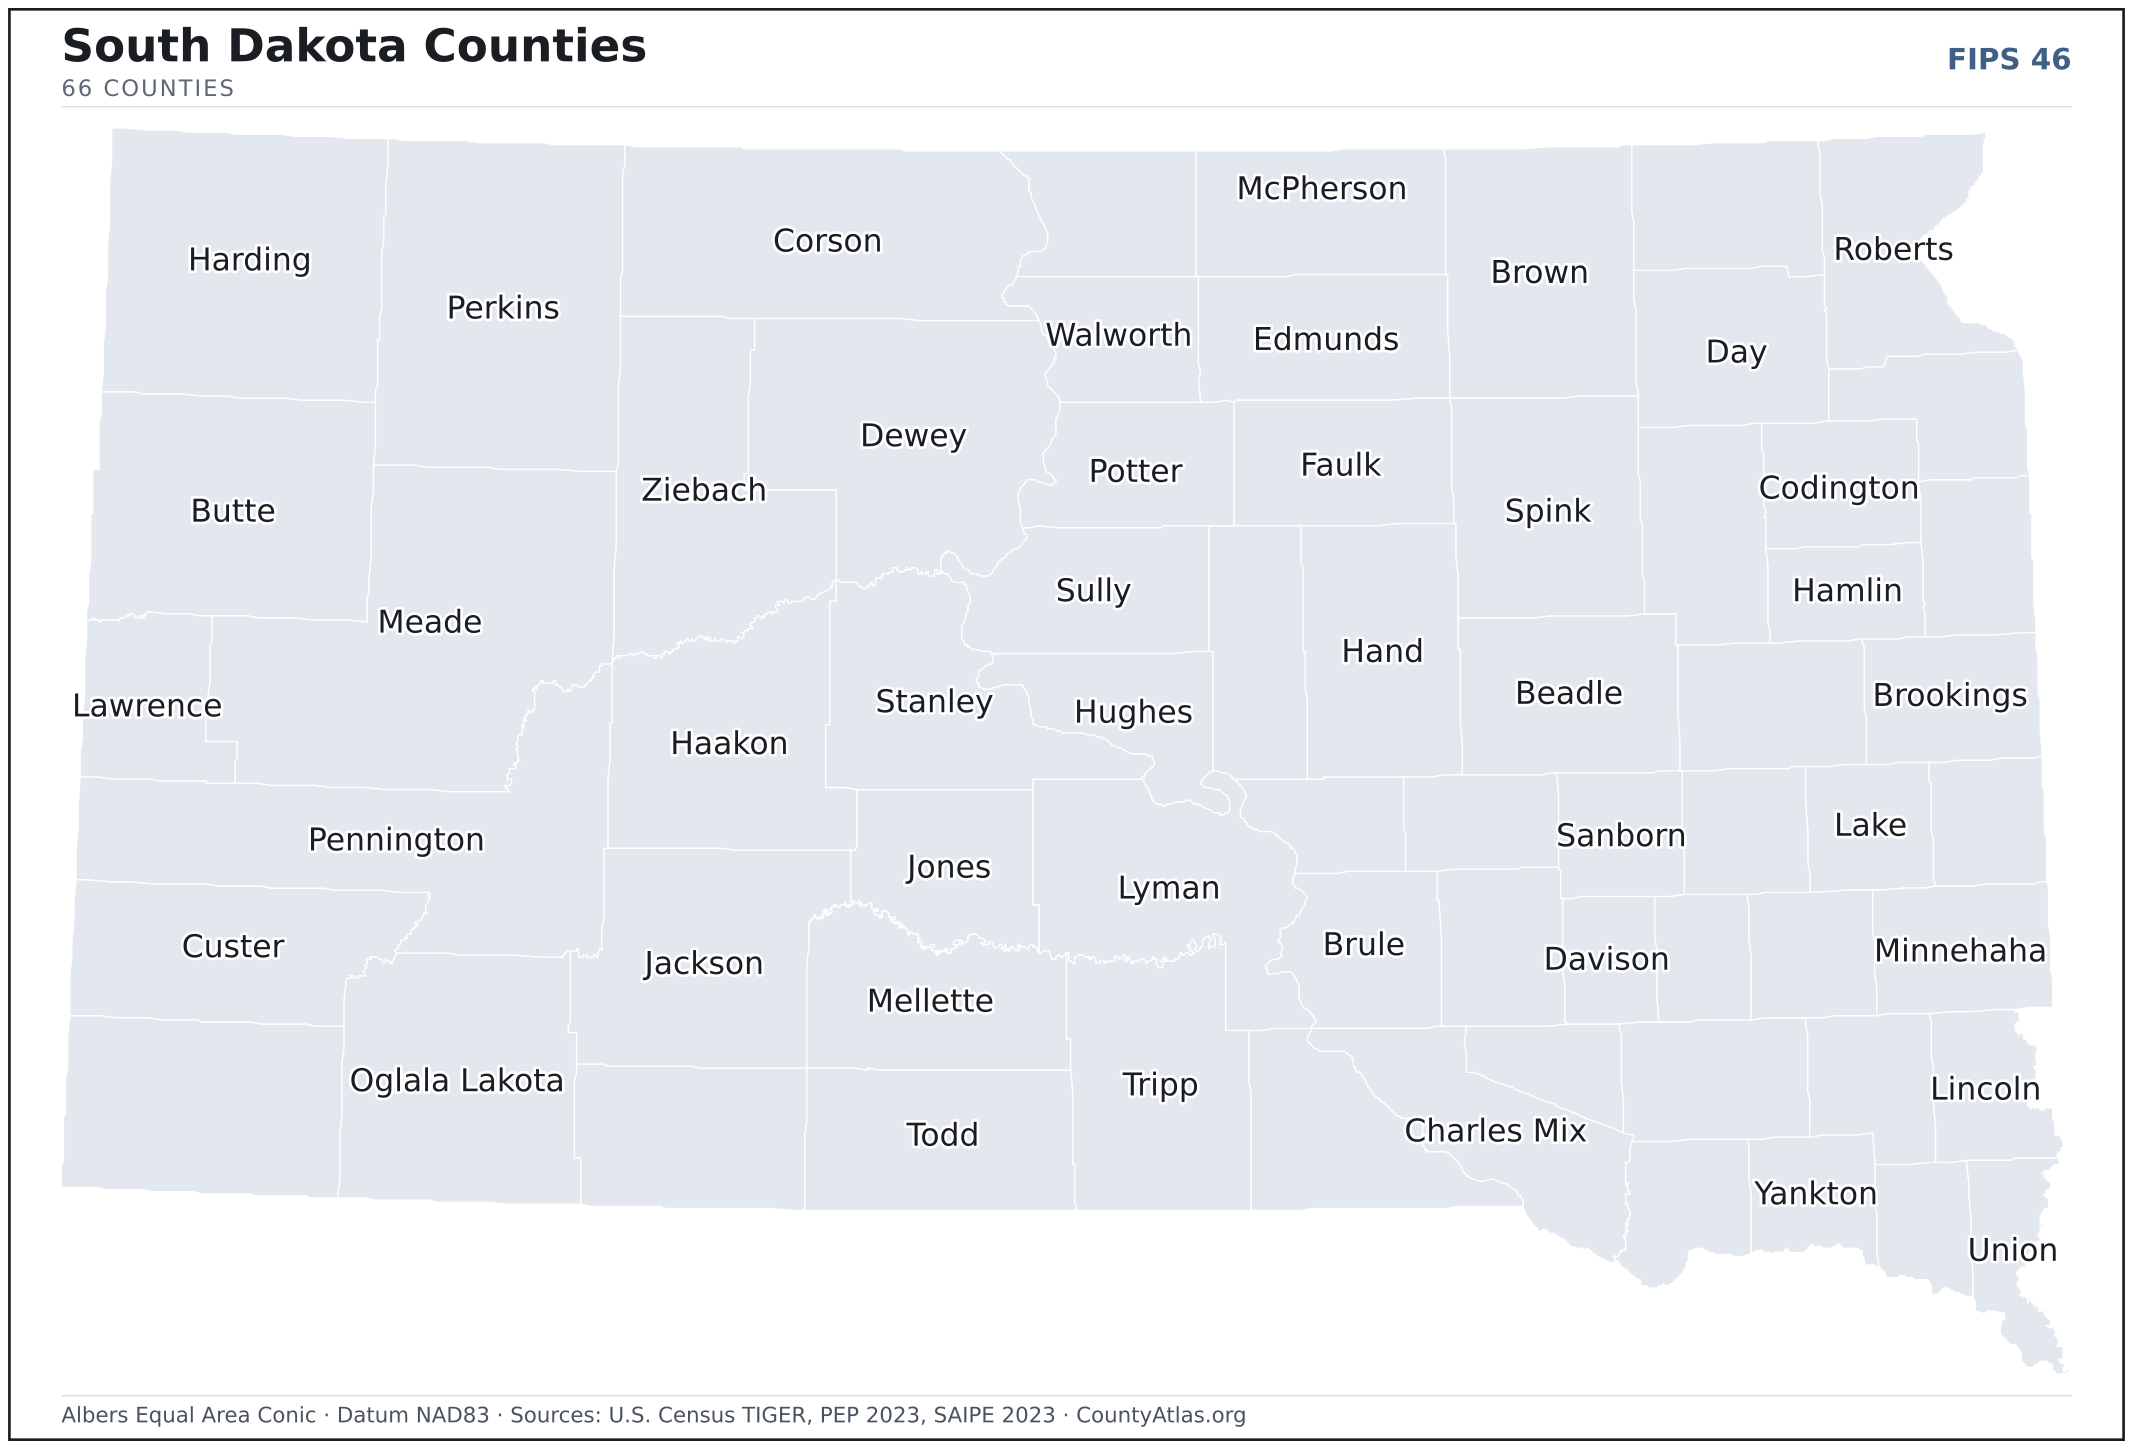
South Dakota maps, coloured by the data
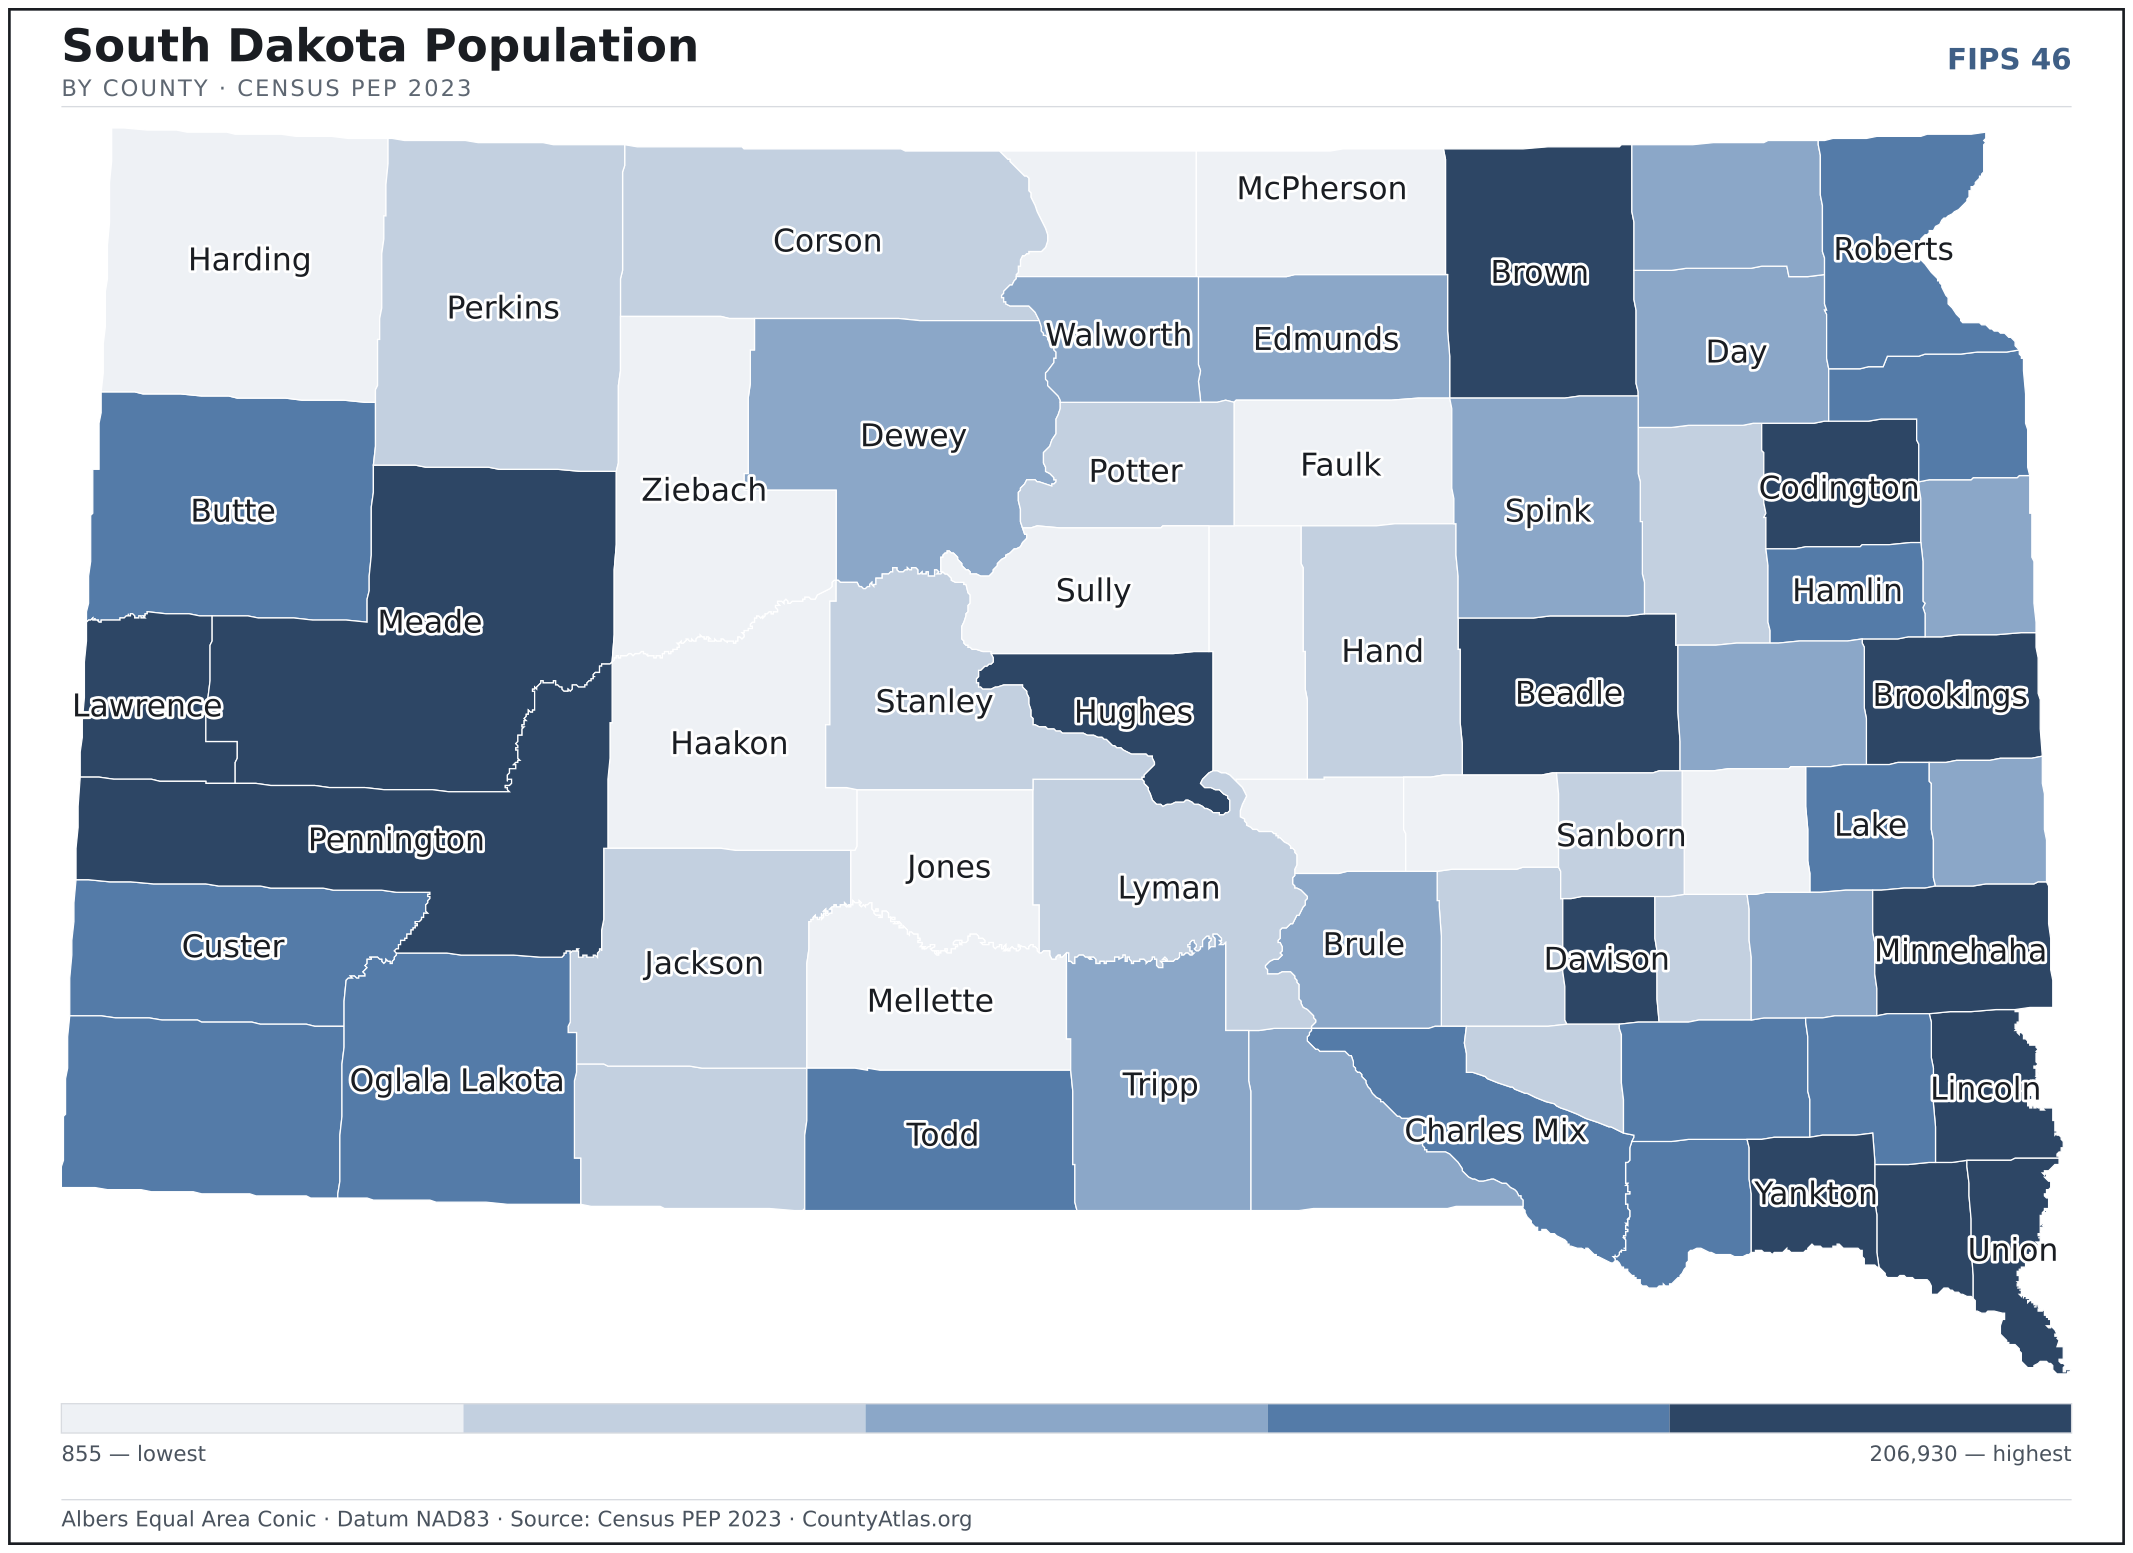
Cities in South Dakota
South Dakota has 310 incorporated cities and towns. The largest is Sioux Falls in Minnehaha County with 197,642 residents. Use the search on the map above to find any city and highlight the county it sits in.
| Sioux Falls | Minnehaha County | 197,642 |
| Rapid City | Pennington County | 76,836 |
| Aberdeen | Brown County | 28,297 |
| Brookings | Brookings County | 23,710 |
| Watertown | Codington County | 22,859 |
| Mitchell | Davison County | 15,637 |
| Yankton | Yankton County | 15,501 |
| Huron | Beadle County | 14,347 |
| Pierre | Hughes County | 14,008 |
| Spearfish | Lawrence County | 12,551 |
| Box Elder | Pennington County | 12,457 |
| Vermillion | Clay County | 11,800 |
| Brandon | Minnehaha County | 10,996 |
| Harrisburg | Lincoln County | 7,790 |
| Sturgis | Meade County | 7,111 |
| Tea | Lincoln County | 6,339 |
| Madison | Lake County | 6,158 |
| Belle Fourche | Butte County | 5,741 |
| Dell Rapids | Minnehaha County | 3,947 |
| Milbank | Grant County | 3,513 |
| Hot Springs | Fall River County | 3,506 |
| Hartford | Minnehaha County | 3,412 |
| Canton | Lincoln County | 3,060 |
| North Sioux City | Union County | 3,018 |
| Lead | Lawrence County | 2,997 |
| Summerset | Meade County | 2,978 |
| Mobridge | Walworth County | 2,928 |
| Winner | Tripp County | 2,900 |
| Chamberlain | Brule County | 2,621 |
| Sisseton | Roberts County | 2,593 |
| Lennox | Lincoln County | 2,587 |
| Fort Pierre | Stanley County | 2,534 |
| Beresford | Union County | 2,437 |
| Elk Point | Union County | 2,391 |
| Flandreau | Moody County | 2,291 |
| Volga | Brookings County | 2,246 |
| Redfield | Spink County | 2,230 |
| Custer | Custer County | 2,148 |
| Springfield | Bon Homme County | 2,073 |
| Parkston | Hutchinson County | 1,981 |
| Webster | Day County | 1,823 |
| Groton | Brown County | 1,794 |
| Freeman | Hutchinson County | 1,558 |
| Wagner | Charles Mix County | 1,555 |
| Baltic | Minnehaha County | 1,512 |
| Eagle Butte | Dewey County | 1,492 |
| Aurora (town) | Brookings County | 1,407 |
| Mission | Todd County | 1,380 |
| Miller | Hand County | 1,346 |
| Gettysburg | Potter County | 1,344 |
Showing the 50 most populous — and 260 more. Search the map above for any South Dakota city or village.
A city can span more than one county; each is listed in its primary county — the one its center falls in.
Which South Dakota county is the richest, largest, most crowded? The answers
- South Dakota’s highest median household income is in Lincoln County ($102,130); the lowest is in Buffalo County ($32,803). Census SAIPE 2023
- South Dakota’s most populous county is Minnehaha County (206,930); the least populous is Jones County (855) — a 242× spread. Census PEP 2023
- South Dakota’s largest county by land area is Meade County (3,471 sq mi); the smallest is Clay County (412 sq mi). Census TIGER
- South Dakota’s highest population density is in Minnehaha County (256/sq mi); the lowest is in Harding County (0/sq mi). Census PEP 2023 · TIGER
- South Dakota’s highest poverty rate is in Ziebach County (46.2%); the lowest is in Lincoln County (3.3%). Census SAIPE 2023
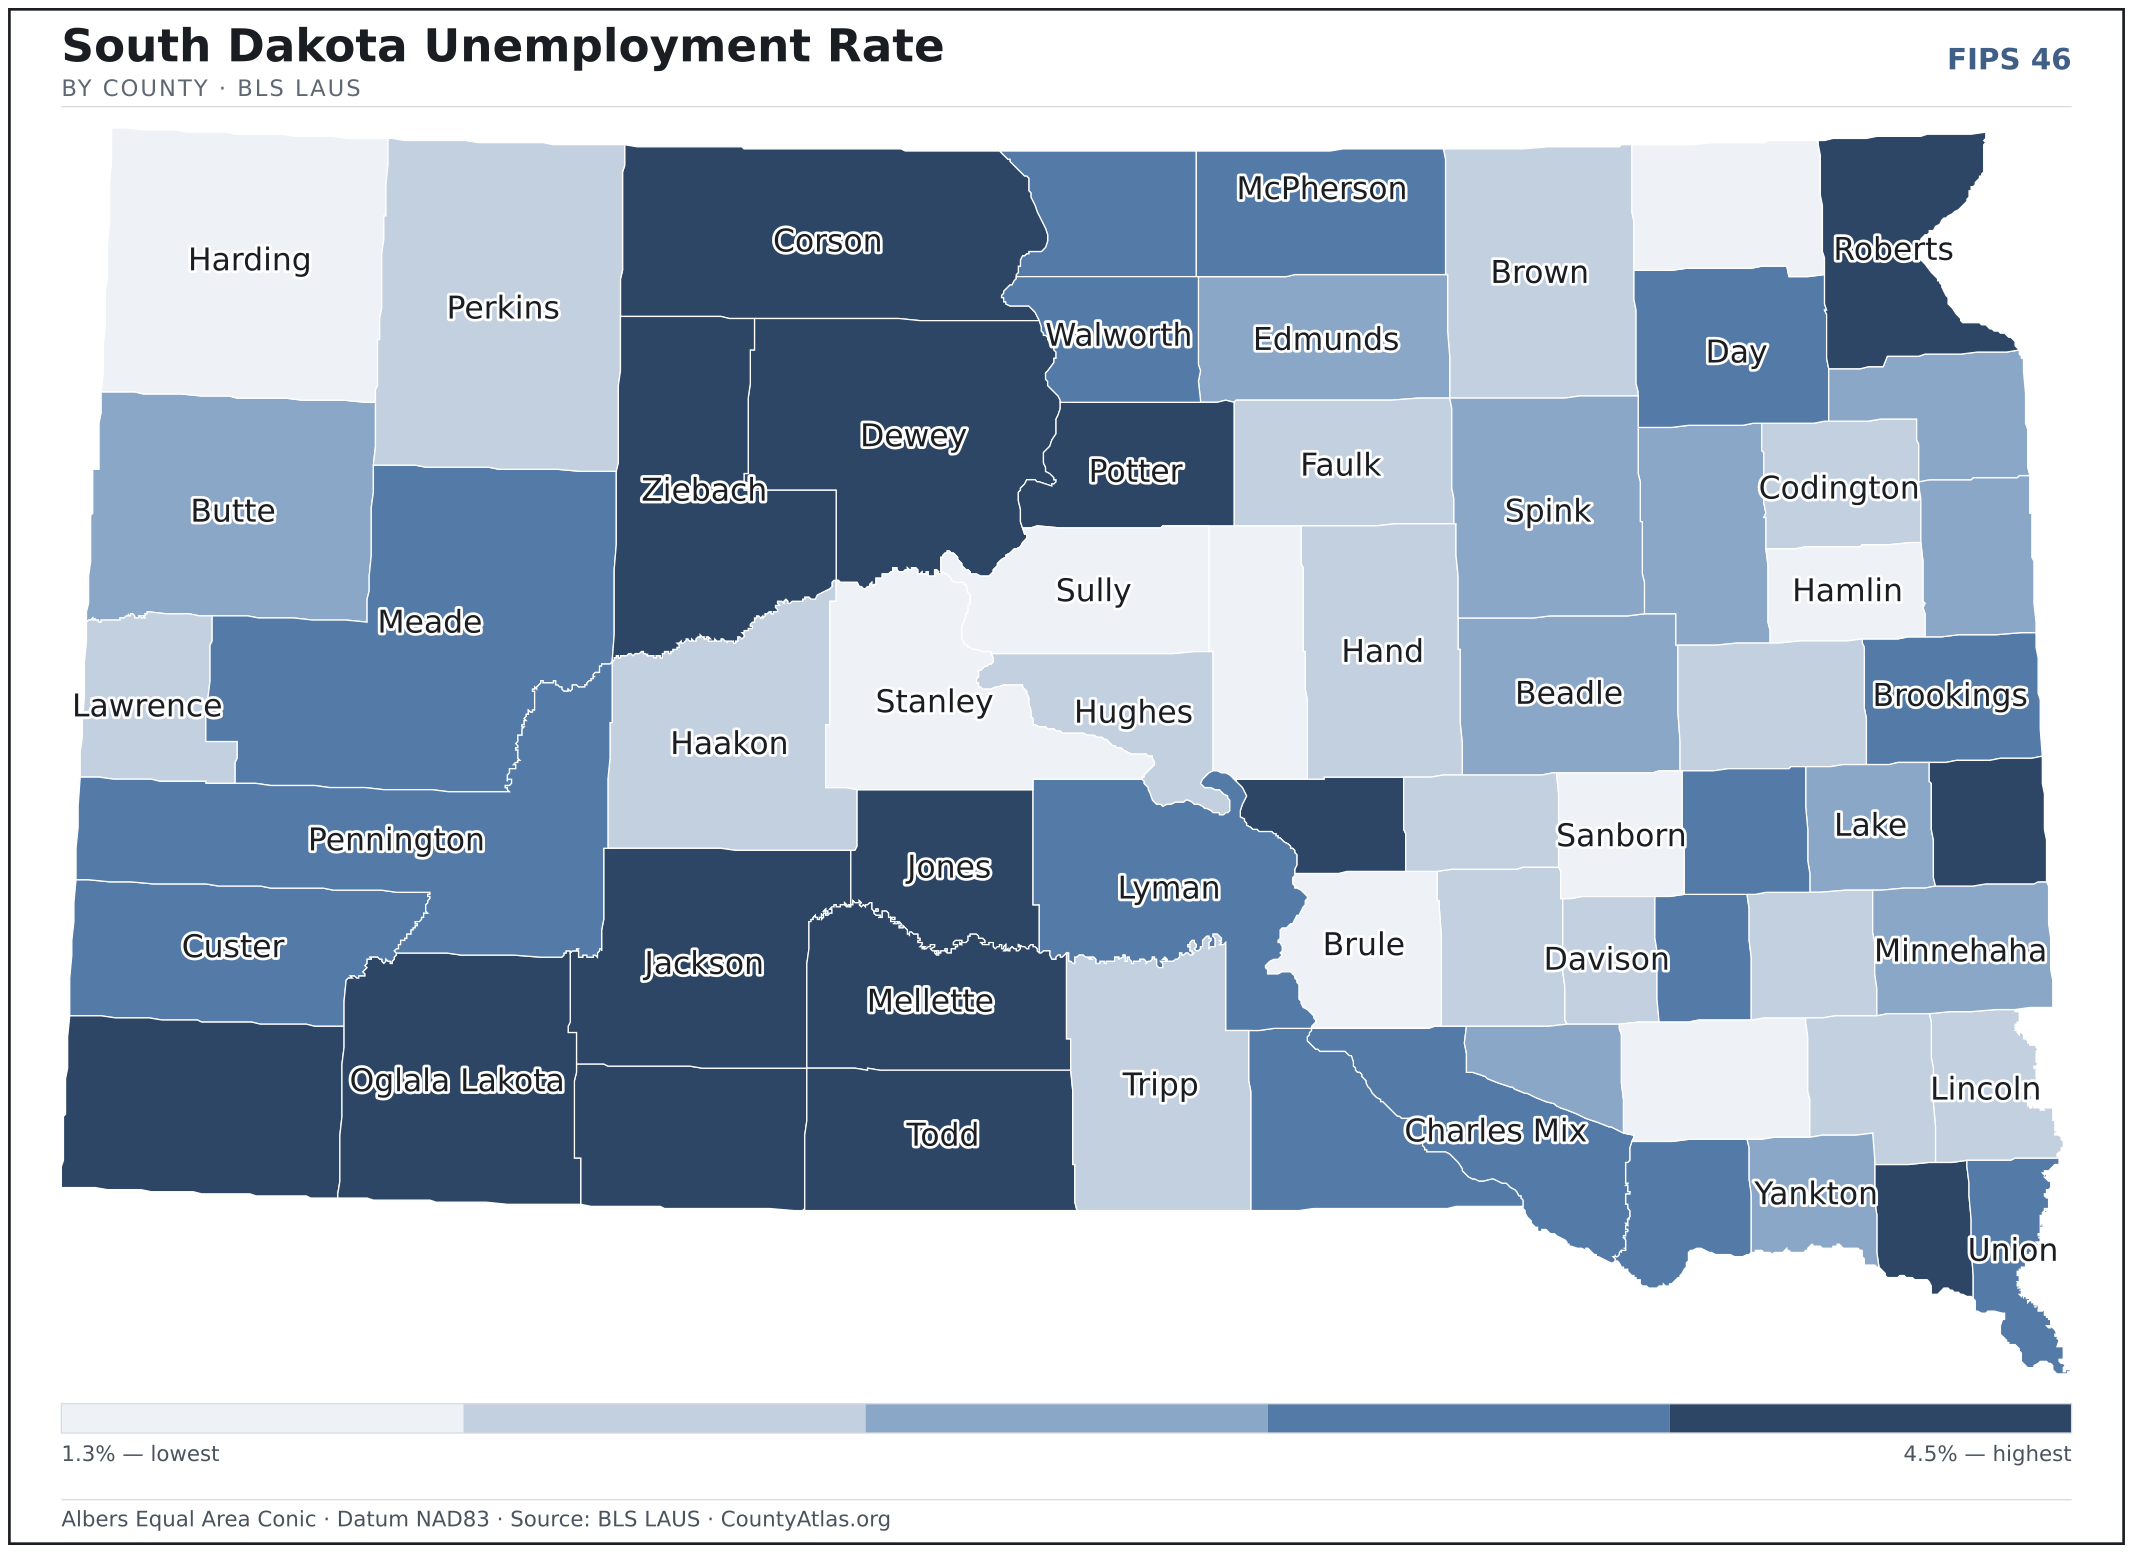
- In South Dakota, unemployment is highest in Todd County (4.5%) and lowest in Harding County (1.3%), for May 2026. BLS LAUS
- South Dakota’s highest median age is in Custer County (57.2); the lowest is in Clay County (24.5). Census ACS 2019–2023
- South Dakota’s highest share of bachelor’s degrees is in Clay County (46.0% of adults); the lowest is in Buffalo County (7.0%). Census ACS 2019–2023
Every figure is a current official estimate from the source named — not a crowd-sourced or copied value. Suppressed estimates (coefficient of variation ≥ 0.30) are omitted, never guessed. See the full methodology.
South Dakota counties: common questions
How many counties are in South Dakota?
South Dakota has 66 counties covering 75,809 sq mi and about 919K residents. Every one is on the map above and in the table below.
What is the largest county in South Dakota?
It depends on the measure. By land area it’s Meade County (3,471 sq mi); by population it’s Minnehaha County (206,930 residents).
What county is Sioux Falls in?
Sioux Falls (population 197,642) is in Minnehaha County. Use the search on the map to find any South Dakota city’s county.
What is the richest county in South Dakota?
By median household income, Lincoln County is the richest at $102,130; the poorest is Buffalo County at $32,803 (Census SAIPE 2023).
What is the most populous county in South Dakota?
Minnehaha County, with 206,930 residents — about 22.5% of South Dakota’s people, and 242× the least populous, Jones County (855).
Sources & vintages
- Population — PEP Vintage 2023 (July 1, 2023) — pep/charv
- Median household income & poverty — SAIPE 2023
- Unemployment — BLS LAUS May 2026 (preliminary)
- Geometry & boundaries — Census TIGERweb
- Cities & city population — Census TIGERweb Incorporated Places + ACS 5-year 2019–2023
Data current through .