CountyAtlas Tennessee
Tennessee County Map with Cities — All 95 Counties
All 95 of Tennessee's counties, mapped from official U.S. Census boundaries with population, income, and unemployment for every one. Colour the map by any measure, tap a county for its data, or download a print-ready copy.
Tap any county for its population, income, and more.
Tennessee at a glance
- Scale. Tennessee is divided into 95 counties across 41,225 sq mi of land — an average of 434 sq mi each. Census TIGER
- People. Its counties are home to 7,126,489 residents — an average of 75,016 each, or 173 per square mile statewide. Census PEP 2023
- Water. Another 905 sq mi is water — 2.1% of the state’s area, led by Benton County. Census TIGER
Tennessee’s 95 counties, by the numbers
Every county’s population, median household income, unemployment, density, and land area — sortable by any column, so you can find yours or rank by what matters to you. A few patterns run through the data:
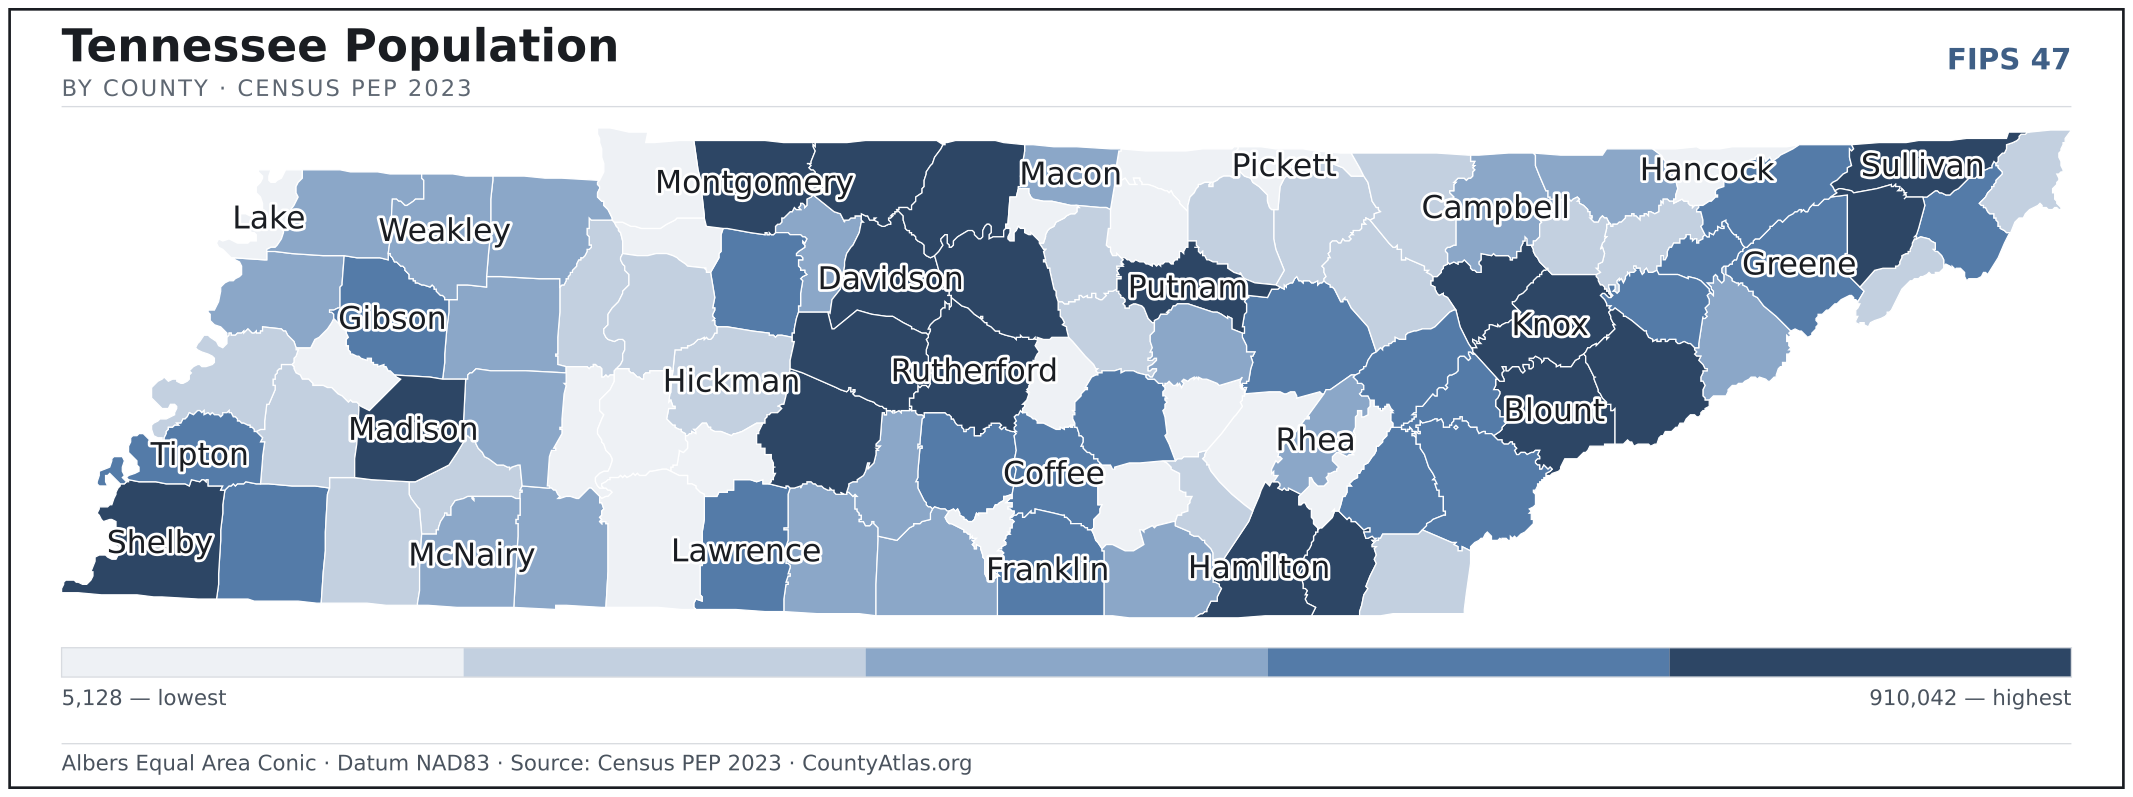
- Concentrated. Half of Tennessee’s 7,126,489 residents live in just 8 of 95 counties, and the five largest hold 40.3% of the total. Census PEP 2023
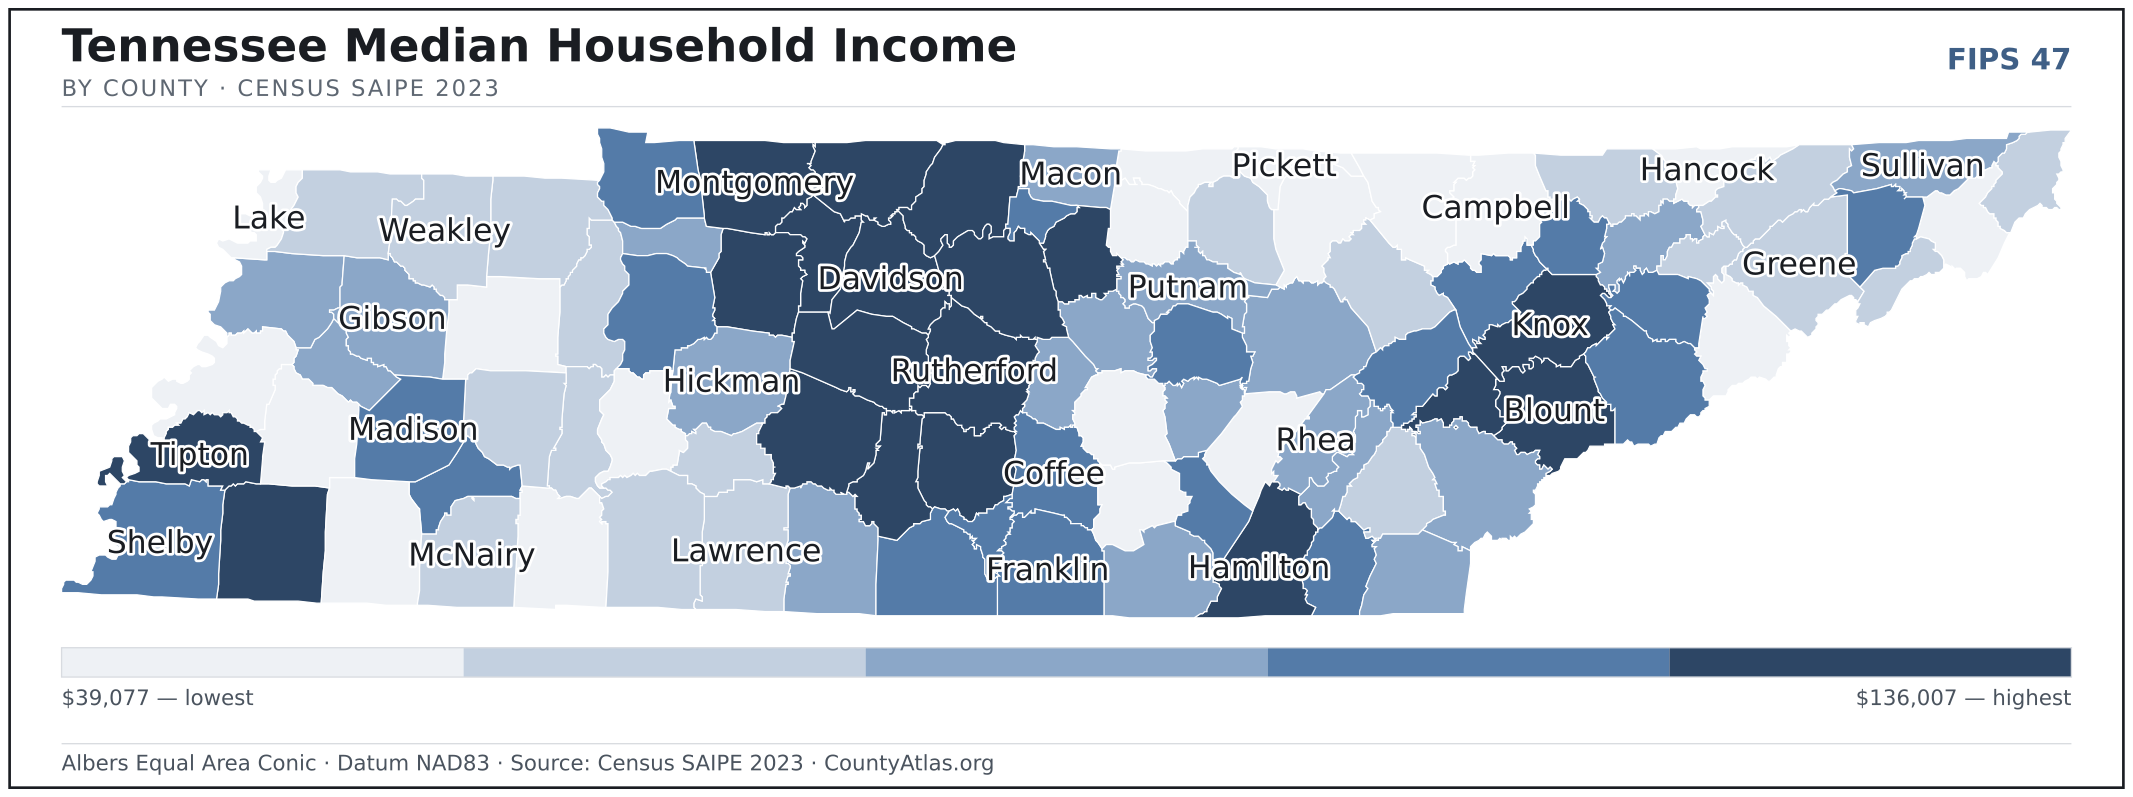
- Income tracks poverty. The gap from richest to poorest runs 3.5×, and the 10 highest-income counties average 9.3% in poverty against 22.4% for the 10 lowest. Census SAIPE 2023
- Mostly small. Half of Tennessee’s counties have fewer than 32,554 residents, and half report a median household income below $57,630 — a few metros lift the statewide totals well above both. Census PEP 2023 · SAIPE 2023
- Lopsided density. Only 20 of 95 counties are denser than Tennessee’s statewide average of 173 people per square mile — the rest are more rural. Census PEP 2023 · TIGER
| Anderson County | 80,234 | $61,009 | 2.9% | 238/sq mi | 337 sq mi | Clinton |
| Bedford County | 53,055 | $69,272 | 3.0% | 112/sq mi | 474 sq mi | Shelbyville |
| Benton County | 16,103 | $52,795 | 4.1% | 41/sq mi | 394 sq mi | Camden |
| Bledsoe County | 15,060 | $50,731 | 2.7% | 37/sq mi | 407 sq mi | Pikeville |
| Blount County | 141,456 | $77,206 | 2.6% | 253/sq mi | 559 sq mi | Maryville |
| Bradley County | 111,579 | $61,440 | 3.3% | 339/sq mi | 329 sq mi | Cleveland |
| Campbell County | 40,223 | $50,443 | 3.4% | 84/sq mi | 480 sq mi | Jacksboro |
| Cannon County | 15,063 | $60,098 | 2.6% | 57/sq mi | 266 sq mi | Woodbury |
| Carroll County | 28,860 | $51,159 | 3.8% | 48/sq mi | 598 sq mi | Huntingdon |
| Carter County | 57,022 | $48,885 | 3.4% | 167/sq mi | 341 sq mi | Elizabethton |
| Cheatham County | 42,254 | $82,030 | 2.5% | 140/sq mi | 303 sq mi | Ashland City |
| Chester County | 17,606 | $65,714 | 3.6% | 62/sq mi | 286 sq mi | Henderson |
| Claiborne County | 32,654 | $53,195 | 3.4% | 75/sq mi | 435 sq mi | Tazewell |
| Clay County | 7,714 | $46,575 | 3.7% | 33/sq mi | 237 sq mi | Celina |
| Cocke County | 37,404 | $47,491 | 3.9% | 86/sq mi | 436 sq mi | Newport |
| Coffee County | 60,633 | $65,038 | 3.0% | 141/sq mi | 429 sq mi | Manchester |
| Crockett County | 13,982 | $56,083 | 2.8% | 53/sq mi | 266 sq mi | Alamo |
| Cumberland County | 64,760 | $60,632 | 3.8% | 95/sq mi | 681 sq mi | Crossville |
| Davidson County | 712,334 | $80,216 | 2.7% | 1,415/sq mi | 504 sq mi | Nashville |
| Decatur County | 11,656 | $52,000 | 4.0% | 35/sq mi | 334 sq mi | Decaturville |
| DeKalb County | 21,225 | $57,936 | 3.7% | 70/sq mi | 304 sq mi | Smithville |
| Dickson County | 56,729 | $74,028 | 2.5% | 116/sq mi | 490 sq mi | Charlotte |
| Dyer County | 36,498 | $57,548 | 3.2% | 71/sq mi | 512 sq mi | Dyersburg |
| Fayette County | 44,175 | $76,680 | 3.3% | 63/sq mi | 704 sq mi | Somerville |
| Fentress County | 19,696 | $47,860 | 3.3% | 40/sq mi | 499 sq mi | Jamestown |
| Franklin County | 44,654 | $64,243 | 3.2% | 81/sq mi | 555 sq mi | Winchester |
| Gibson County | 51,045 | $57,630 | 3.3% | 85/sq mi | 603 sq mi | Trenton |
| Giles County | 30,721 | $60,422 | 4.1% | 50/sq mi | 611 sq mi | Pulaski |
| Grainger County | 24,681 | $57,132 | 3.1% | 88/sq mi | 281 sq mi | Rutledge |
| Greene County | 72,577 | $54,188 | 3.9% | 117/sq mi | 622 sq mi | Greeneville |
| Grundy County | 13,955 | $41,370 | 3.5% | 39/sq mi | 360 sq mi | Altamont |
| Hamblen County | 66,216 | $55,904 | 3.1% | 411/sq mi | 161 sq mi | Morristown |
| Hamilton County | 379,864 | $73,319 | 2.9% | 701/sq mi | 542 sq mi | Chattanooga |
| Hancock County | 6,956 | $39,077 | 4.7% | 31/sq mi | 222 sq mi | Sneedville |
| Hardeman County | 25,567 | $47,551 | 4.6% | 38/sq mi | 668 sq mi | Bolivar |
| Hardin County | 27,229 | $49,126 | 3.4% | 47/sq mi | 577 sq mi | Savannah |
| Hawkins County | 58,600 | $54,454 | 3.4% | 120/sq mi | 487 sq mi | Rogersville |
| Haywood County | 17,328 | $42,579 | 3.1% | 33/sq mi | 533 sq mi | Brownsville |
| Henderson County | 28,070 | $55,656 | 3.7% | 54/sq mi | 520 sq mi | Lexington |
| Henry County | 32,554 | $52,064 | 3.8% | 58/sq mi | 562 sq mi | Paris |
| Hickman County | 25,826 | $59,650 | 3.2% | 42/sq mi | 612 sq mi | Centerville |
| Houston County | 8,393 | $56,951 | 3.5% | 42/sq mi | 200 sq mi | Erin |
| Humphreys County | 19,209 | $63,017 | 3.3% | 36/sq mi | 531 sq mi | Waverly |
| Jackson County | 12,363 | $48,285 | 3.6% | 40/sq mi | 309 sq mi | Gainesboro |
| Jefferson County | 57,838 | $62,730 | 3.1% | 210/sq mi | 275 sq mi | Dandridge |
| Johnson County | 18,375 | $51,597 | 3.9% | 62/sq mi | 298 sq mi | Mountain City |
| Knox County | 500,669 | $70,457 | 2.5% | 985/sq mi | 508 sq mi | Knoxville |
| Lake County | 6,347 | $40,778 | 4.2% | 38/sq mi | 166 sq mi | Tiptonville |
| Lauderdale County | 24,610 | $51,486 | 4.2% | 52/sq mi | 472 sq mi | Ripley |
| Lawrence County | 46,114 | $55,845 | 3.9% | 75/sq mi | 617 sq mi | Lawrenceburg |
| Lewis County | 13,066 | $55,231 | 4.5% | 46/sq mi | 282 sq mi | Hohenwald |
| Lincoln County | 36,169 | $60,974 | 3.6% | 63/sq mi | 570 sq mi | Fayetteville |
| Loudon County | 60,591 | $81,605 | 2.7% | 264/sq mi | 229 sq mi | Loudon |
| Macon County | 26,793 | $57,496 | 2.6% | 87/sq mi | 307 sq mi | Lafayette |
| Madison County | 99,193 | $60,663 | 3.5% | 178/sq mi | 557 sq mi | Jackson |
| Marion County | 29,382 | $57,109 | 3.4% | 59/sq mi | 498 sq mi | Jasper |
| Marshall County | 36,961 | $73,770 | 4.0% | 98/sq mi | 375 sq mi | Lewisburg |
| Maury County | 110,760 | $74,164 | 4.5% | 181/sq mi | 613 sq mi | Columbia |
| McMinn County | 55,678 | $55,852 | 3.9% | 129/sq mi | 430 sq mi | Athens |
| McNairy County | 26,163 | $54,516 | 3.5% | 46/sq mi | 563 sq mi | Selmer |
| Meigs County | 13,691 | $56,161 | 4.3% | 70/sq mi | 195 sq mi | Decatur |
| Monroe County | 48,594 | $58,980 | 3.4% | 76/sq mi | 636 sq mi | Madisonville |
| Montgomery County | 239,872 | $74,701 | 3.4% | 445/sq mi | 539 sq mi | Clarksville |
| Moore County | 6,748 | $66,435 | 3.0% | 52/sq mi | 129 sq mi | Lynchburg, Moore County |
| Morgan County | 21,573 | $55,668 | 3.6% | 41/sq mi | 522 sq mi | Wartburg |
| Obion County | 30,411 | $54,428 | 3.0% | 56/sq mi | 545 sq mi | Union City |
| Overton County | 23,327 | $52,236 | 3.2% | 54/sq mi | 433 sq mi | Livingston |
| Perry County | 8,891 | $50,014 | 5.3% | 21/sq mi | 415 sq mi | Linden |
| Pickett County | 5,128 | $46,177 | 4.7% | 31/sq mi | 163 sq mi | Byrdstown |
| Polk County | 18,033 | $57,045 | 3.4% | 41/sq mi | 435 sq mi | Benton |
| Putnam County | 83,844 | $57,896 | 3.1% | 209/sq mi | 401 sq mi | Cookeville |
| Rhea County | 33,924 | $57,682 | 3.8% | 108/sq mi | 315 sq mi | Dayton |
| Roane County | 56,096 | $65,970 | 3.1% | 155/sq mi | 361 sq mi | Kingston |
| Robertson County | 76,776 | $81,529 | 2.7% | 161/sq mi | 476 sq mi | Springfield |
| Rutherford County | 367,101 | $81,987 | 2.6% | 593/sq mi | 620 sq mi | Murfreesboro |
| Scott County | 22,171 | $46,923 | 3.8% | 42/sq mi | 532 sq mi | Huntsville |
| Sequatchie County | 17,161 | $62,157 | 3.3% | 65/sq mi | 266 sq mi | Dunlap |
| Sevier County | 99,415 | $60,704 | 2.6% | 168/sq mi | 593 sq mi | Sevierville |
| Shelby County | 910,042 | $62,402 | 4.3% | 1,209/sq mi | 753 sq mi | Memphis |
| Smith County | 20,538 | $72,153 | 2.9% | 65/sq mi | 314 sq mi | Carthage |
| Stewart County | 14,222 | $60,634 | 3.6% | 31/sq mi | 460 sq mi | Dover |
| Sullivan County | 162,135 | $57,016 | 3.0% | 392/sq mi | 414 sq mi | Blountville |
| Sumner County | 207,994 | $86,376 | 2.6% | 393/sq mi | 529 sq mi | Gallatin |
| Tipton County | 62,015 | $70,886 | 3.4% | 136/sq mi | 456 sq mi | Covington |
| Trousdale County | 12,271 | $62,658 | 2.8% | 107/sq mi | 114 sq mi | Hartsville |
| Unicoi County | 17,756 | $54,955 | 3.3% | 95/sq mi | 186 sq mi | Erwin |
| Union County | 20,741 | $64,244 | 3.1% | 93/sq mi | 224 sq mi | Maynardville |
| Van Buren County | 6,493 | $58,584 | 3.1% | 24/sq mi | 273 sq mi | Spencer |
| Warren County | 42,638 | $49,436 | 3.4% | 99/sq mi | 433 sq mi | McMinnville |
| Washington County | 138,420 | $62,028 | 2.8% | 424/sq mi | 327 sq mi | Jonesborough |
| Wayne County | 16,066 | $51,817 | 3.5% | 22/sq mi | 734 sq mi | Waynesboro |
| Weakley County | 33,084 | $55,285 | 3.8% | 57/sq mi | 580 sq mi | Dresden |
| White County | 28,692 | $63,690 | 3.9% | 76/sq mi | 377 sq mi | Sparta |
| Williamson County | 264,460 | $136,007 | 2.4% | 454/sq mi | 583 sq mi | Franklin |
| Wilson County | 163,674 | $96,466 | 2.6% | 287/sq mi | 571 sq mi | Lebanon |
All 95 counties, sortable by any column — click a heading. A suppressed estimate (coefficient of variation ≥ 0.30) shows a marker, never a guess. County seats are from Wikidata (CC0), each validated to a Census place inside its county; a county with no validated seat is left blank. See the methodology.
Download & print this Tennessee map
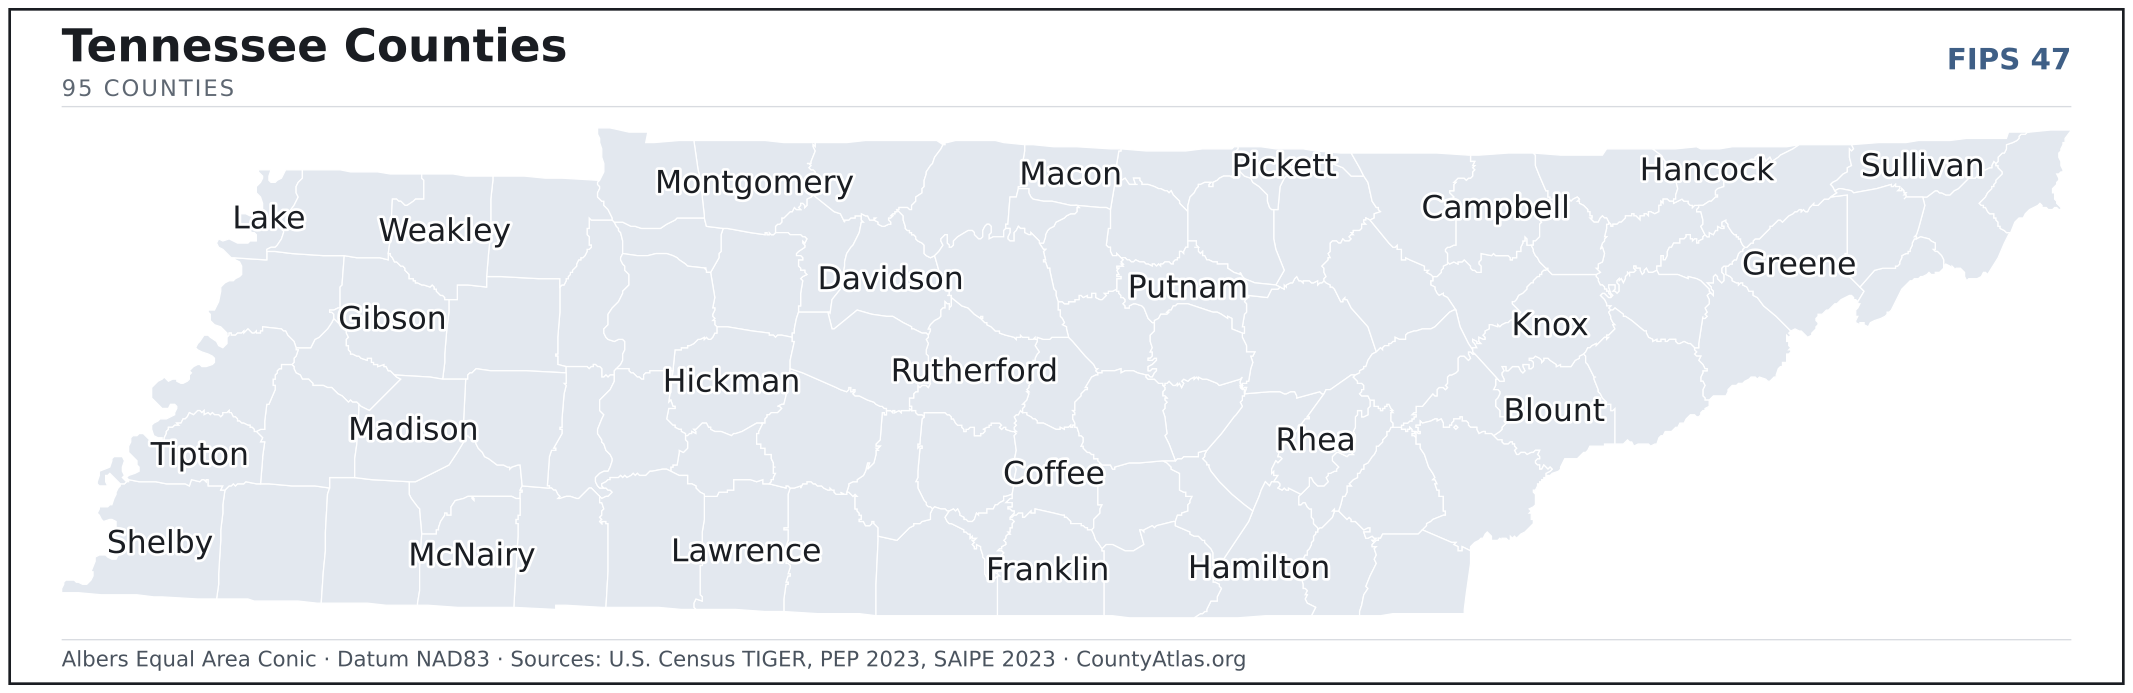
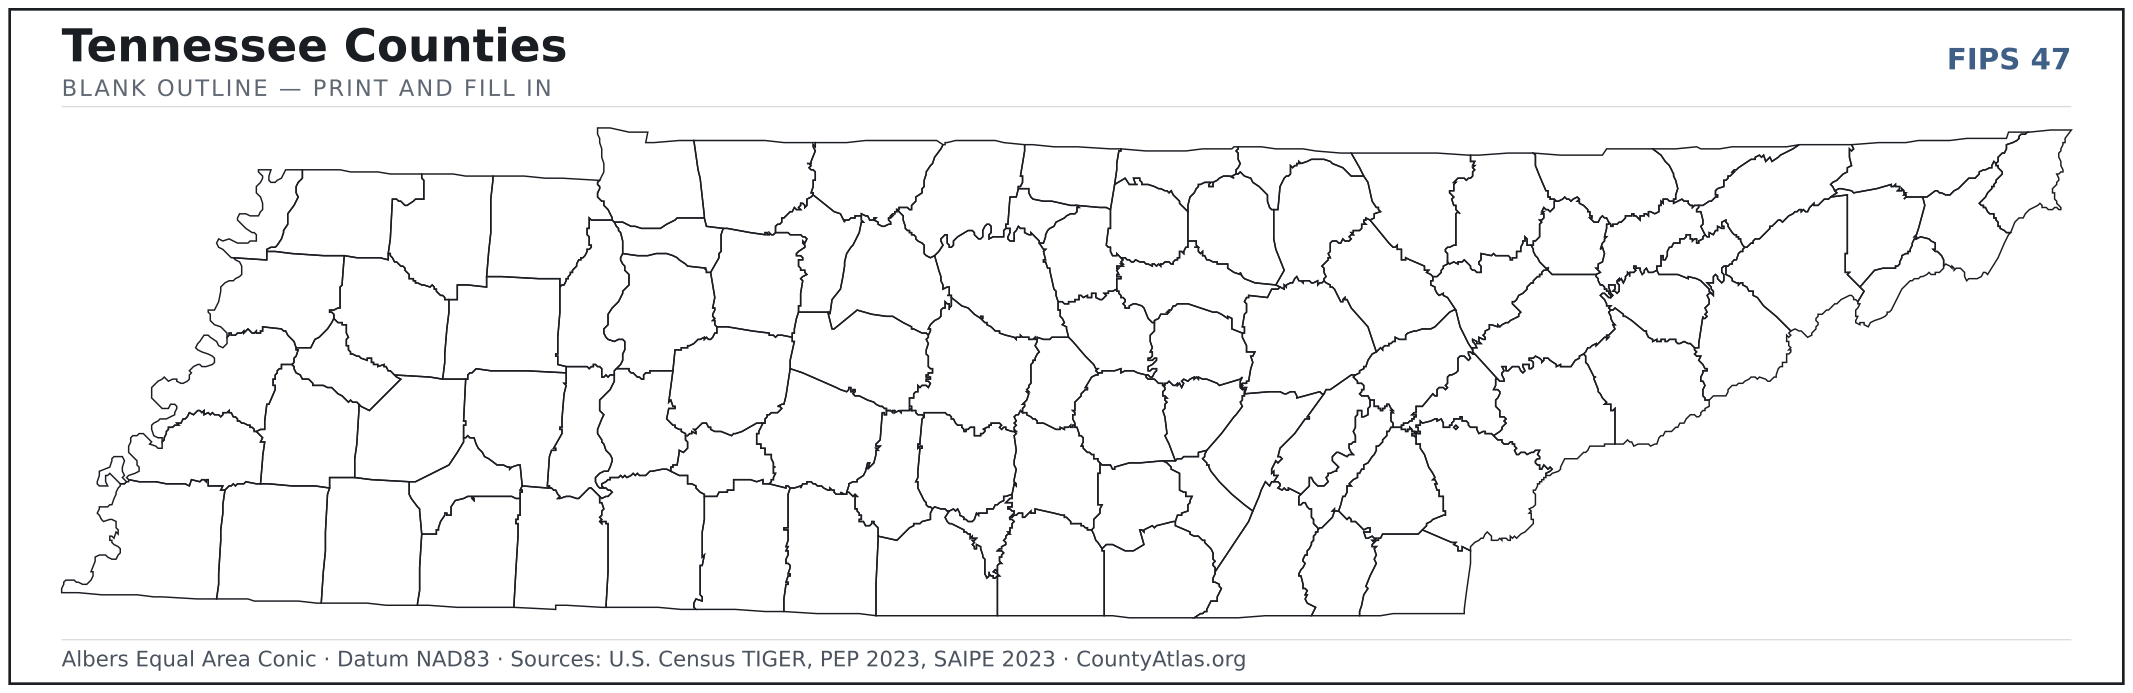
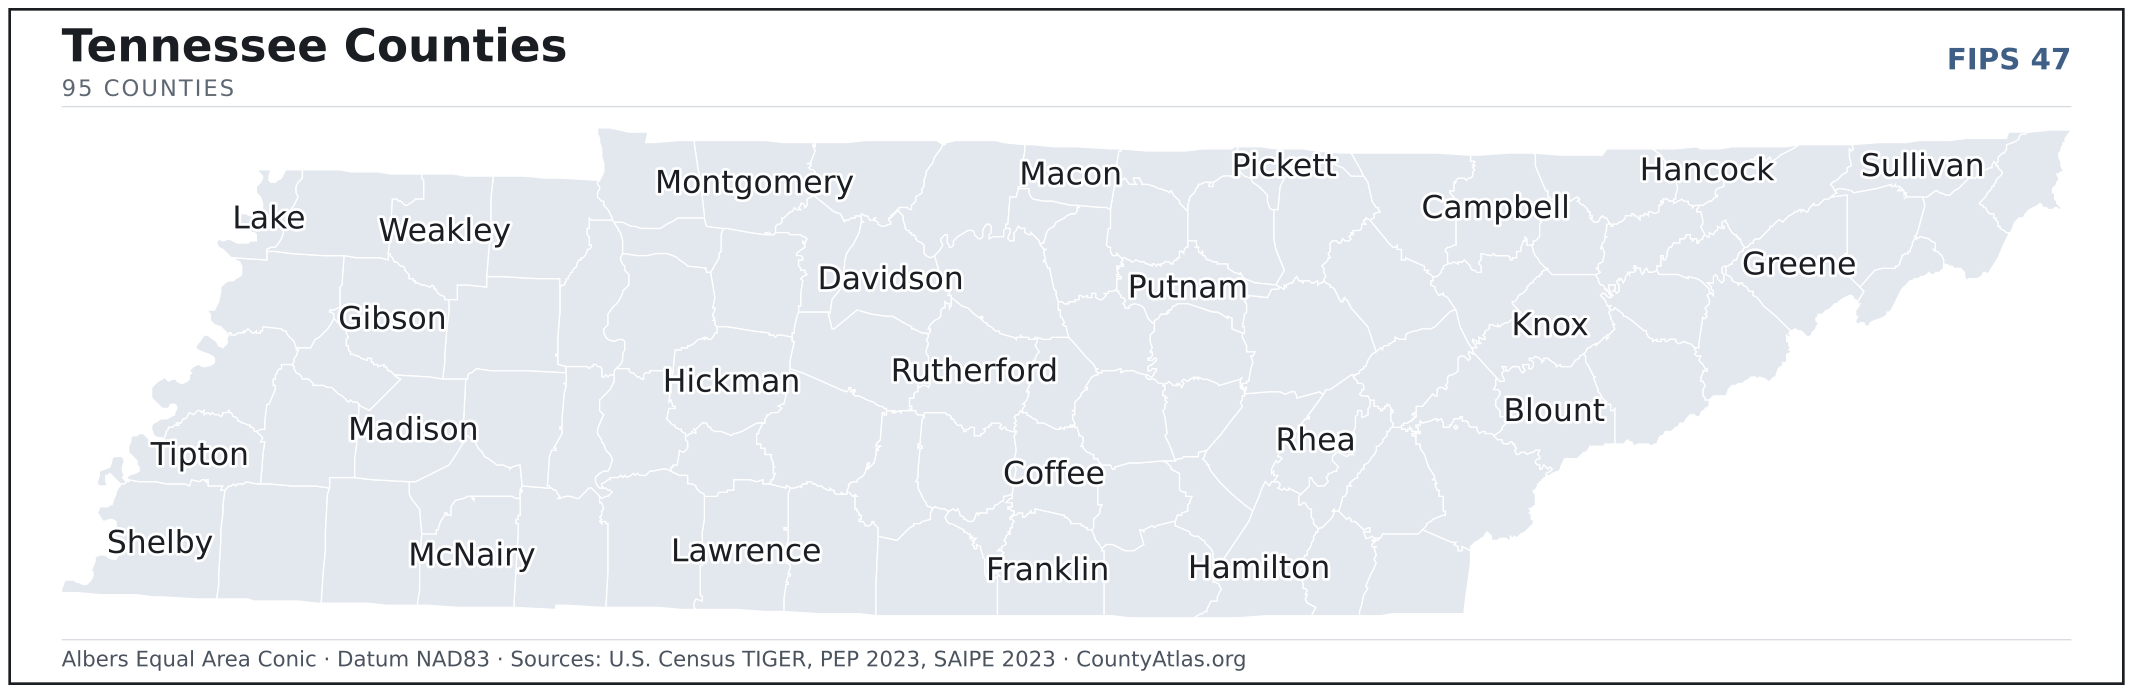
Tennessee maps, coloured by the data
Cities in Tennessee
Tennessee has 345 incorporated cities, towns, and metropolitan governments. The largest is Nashville-Davidson metropolitan government (balance) in Davidson County with 684,298 residents. Use the search on the map above to find any city and highlight the county it sits in.
| Nashville-Davidson metropolitan government (balance) | Davidson County | 684,298 |
| Memphis | Shelby County | 629,063 |
| Knoxville | Knox County | 193,721 |
| Chattanooga | Hamilton County | 182,832 |
| Clarksville | Montgomery County | 171,897 |
| Murfreesboro | Rutherford County | 157,547 |
| Franklin | Williamson County | 85,575 |
| Johnson City | Washington County | 71,455 |
| Jackson | Madison County | 68,098 |
| Hendersonville | Sumner County | 62,390 |
| Bartlett | Shelby County | 56,998 |
| Kingsport | Sullivan County | 55,807 |
| Smyrna (town) | Rutherford County | 55,066 |
| Spring Hill | Maury County | 53,585 |
| Collierville (town) | Shelby County | 51,212 |
| Cleveland | Bradley County | 48,185 |
| Gallatin | Sumner County | 46,667 |
| Brentwood | Williamson County | 45,272 |
| Columbia | Maury County | 43,971 |
| Lebanon | Wilson County | 41,951 |
| Mount Juliet | Wilson County | 40,828 |
| Germantown | Shelby County | 40,812 |
| La Vergne | Rutherford County | 38,944 |
| Cookeville | Putnam County | 35,544 |
| Maryville | Blount County | 32,196 |
| Oak Ridge | Anderson County | 32,088 |
| Morristown | Hamblen County | 30,983 |
| Bristol | Sullivan County | 27,490 |
| Farragut (town) | Knox County | 24,309 |
| Shelbyville | Bedford County | 24,125 |
| East Ridge | Hamilton County | 22,034 |
| Tullahoma | Coffee County | 20,672 |
| Springfield | Robertson County | 18,985 |
| Sevierville | Sevier County | 18,105 |
| Goodlettsville | Sumner County | 17,598 |
| Dickson | Dickson County | 16,246 |
| Dyersburg | Dyer County | 16,075 |
| Greeneville (town) | Greene County | 15,531 |
| Arlington (town) | Shelby County | 14,989 |
| Nolensville (town) | Williamson County | 14,545 |
| Elizabethton | Carter County | 14,364 |
| Athens | McMinn County | 14,250 |
| Lakeland | Shelby County | 14,068 |
| White House | Robertson County | 13,875 |
| McMinnville | Warren County | 13,765 |
| Portland | Sumner County | 13,325 |
| Soddy-Daisy | Hamilton County | 13,117 |
| Manchester | Coffee County | 12,651 |
| Lewisburg | Marshall County | 12,607 |
| Crossville | Cumberland County | 12,265 |
Showing the 50 most populous — and 295 more. Search the map above for any Tennessee city or village.
A city can span more than one county; each is listed in its primary county — the one its center falls in.
Which Tennessee county is the richest, largest, most crowded? The answers
- Tennessee’s highest median household income is in Williamson County ($136,007); the lowest is in Hancock County ($39,077). Census SAIPE 2023
- Tennessee’s most populous county is Shelby County (910,042); the least populous is Pickett County (5,128) — a 177× spread. Census PEP 2023
- Tennessee’s largest county by land area is Shelby County (753 sq mi); the smallest is Trousdale County (114 sq mi). Census TIGER
- Tennessee’s highest population density is in Davidson County (1,415/sq mi); the lowest is in Perry County (21/sq mi). Census PEP 2023 · TIGER
- Tennessee’s highest poverty rate is in Lake County (34.0%); the lowest is in Williamson County (4.9%). Census SAIPE 2023
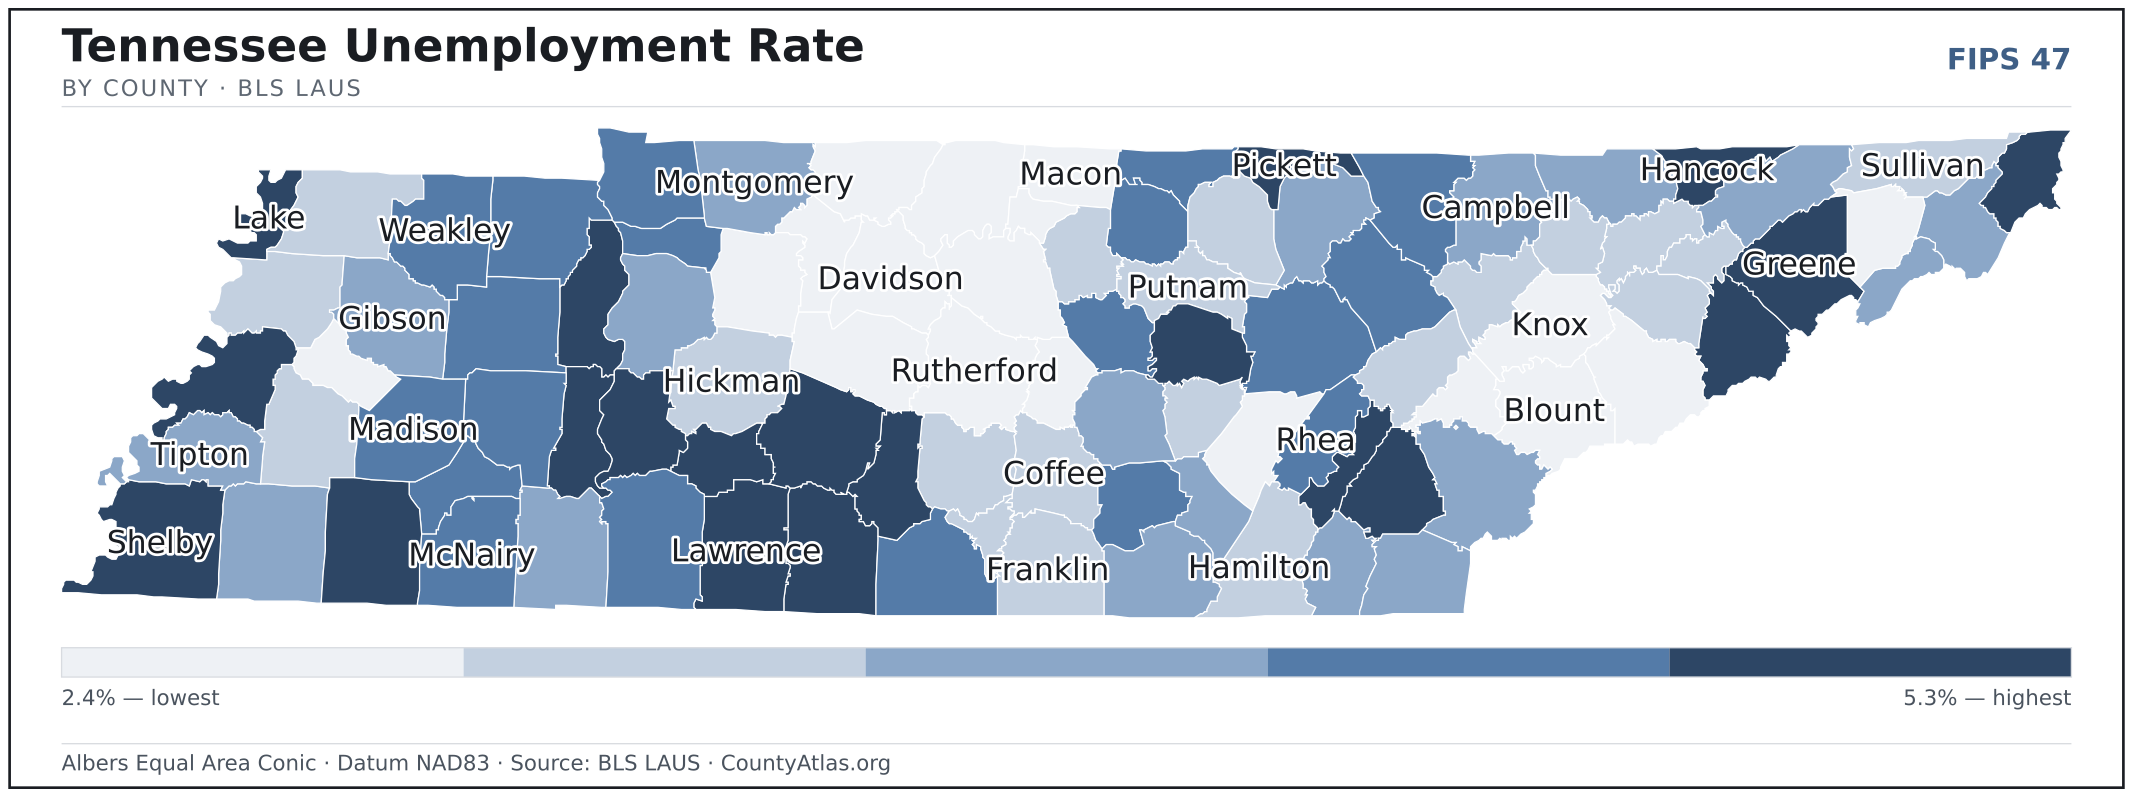
- In Tennessee, unemployment is highest in Perry County (5.3%) and lowest in Williamson County (2.4%), for May 2026. BLS LAUS
- Tennessee’s highest median age is in Cumberland County (53.0); the lowest is in Montgomery County (31.7). Census ACS 2019–2023
- Tennessee’s highest share of bachelor’s degrees is in Williamson County (61.8% of adults); the lowest is in Hancock County (8.6%). Census ACS 2019–2023
Every figure is a current official estimate from the source named — not a crowd-sourced or copied value. Suppressed estimates (coefficient of variation ≥ 0.30) are omitted, never guessed. See the full methodology.
Tennessee counties: common questions
How many counties are in Tennessee?
Tennessee has 95 counties covering 41,225 sq mi and about 7.1M residents. Every one is on the map above and in the table below.
What is the largest county in Tennessee?
It depends on the measure. By land area it’s Shelby County (753 sq mi); by population it’s Shelby County (910,042 residents).
What county is Nashville-Davidson metropolitan government (balance) in?
Nashville-Davidson metropolitan government (balance) (population 684,298) is in Davidson County. Use the search on the map to find any Tennessee city’s county.
What is the richest county in Tennessee?
By median household income, Williamson County is the richest at $136,007; the poorest is Hancock County at $39,077 (Census SAIPE 2023).
What is the most populous county in Tennessee?
Shelby County, with 910,042 residents — about 12.8% of Tennessee’s people, and 177× the least populous, Pickett County (5,128).
Sources & vintages
- Population — PEP Vintage 2023 (July 1, 2023) — pep/charv
- Median household income & poverty — SAIPE 2023
- Unemployment — BLS LAUS May 2026 (preliminary)
- Geometry & boundaries — Census TIGERweb
- Cities & city population — Census TIGERweb Incorporated Places + ACS 5-year 2019–2023
Data current through .