CountyAtlas Washington
Washington County Map with Cities — All 39 Counties
All 39 of Washington's counties, mapped from official U.S. Census boundaries with population, income, and unemployment for every one. Colour the map by any measure, tap a county for its data, or download a print-ready copy.
Tap any county for its population, income, and more.
Washington at a glance
- Scale. Washington is divided into 39 counties across 66,457 sq mi of land — an average of 1,704 sq mi each. Census TIGER
- People. Its counties are home to 7,812,880 residents — an average of 200,330 each, or 118 per square mile statewide. Census PEP 2023
- Water. Another 4,844 sq mi is water — 6.8% of the state’s area, led by Clallam County. Census TIGER
Washington’s 39 counties, by the numbers
Every county’s population, median household income, unemployment, density, and land area — sortable by any column, so you can find yours or rank by what matters to you. A few patterns run through the data:
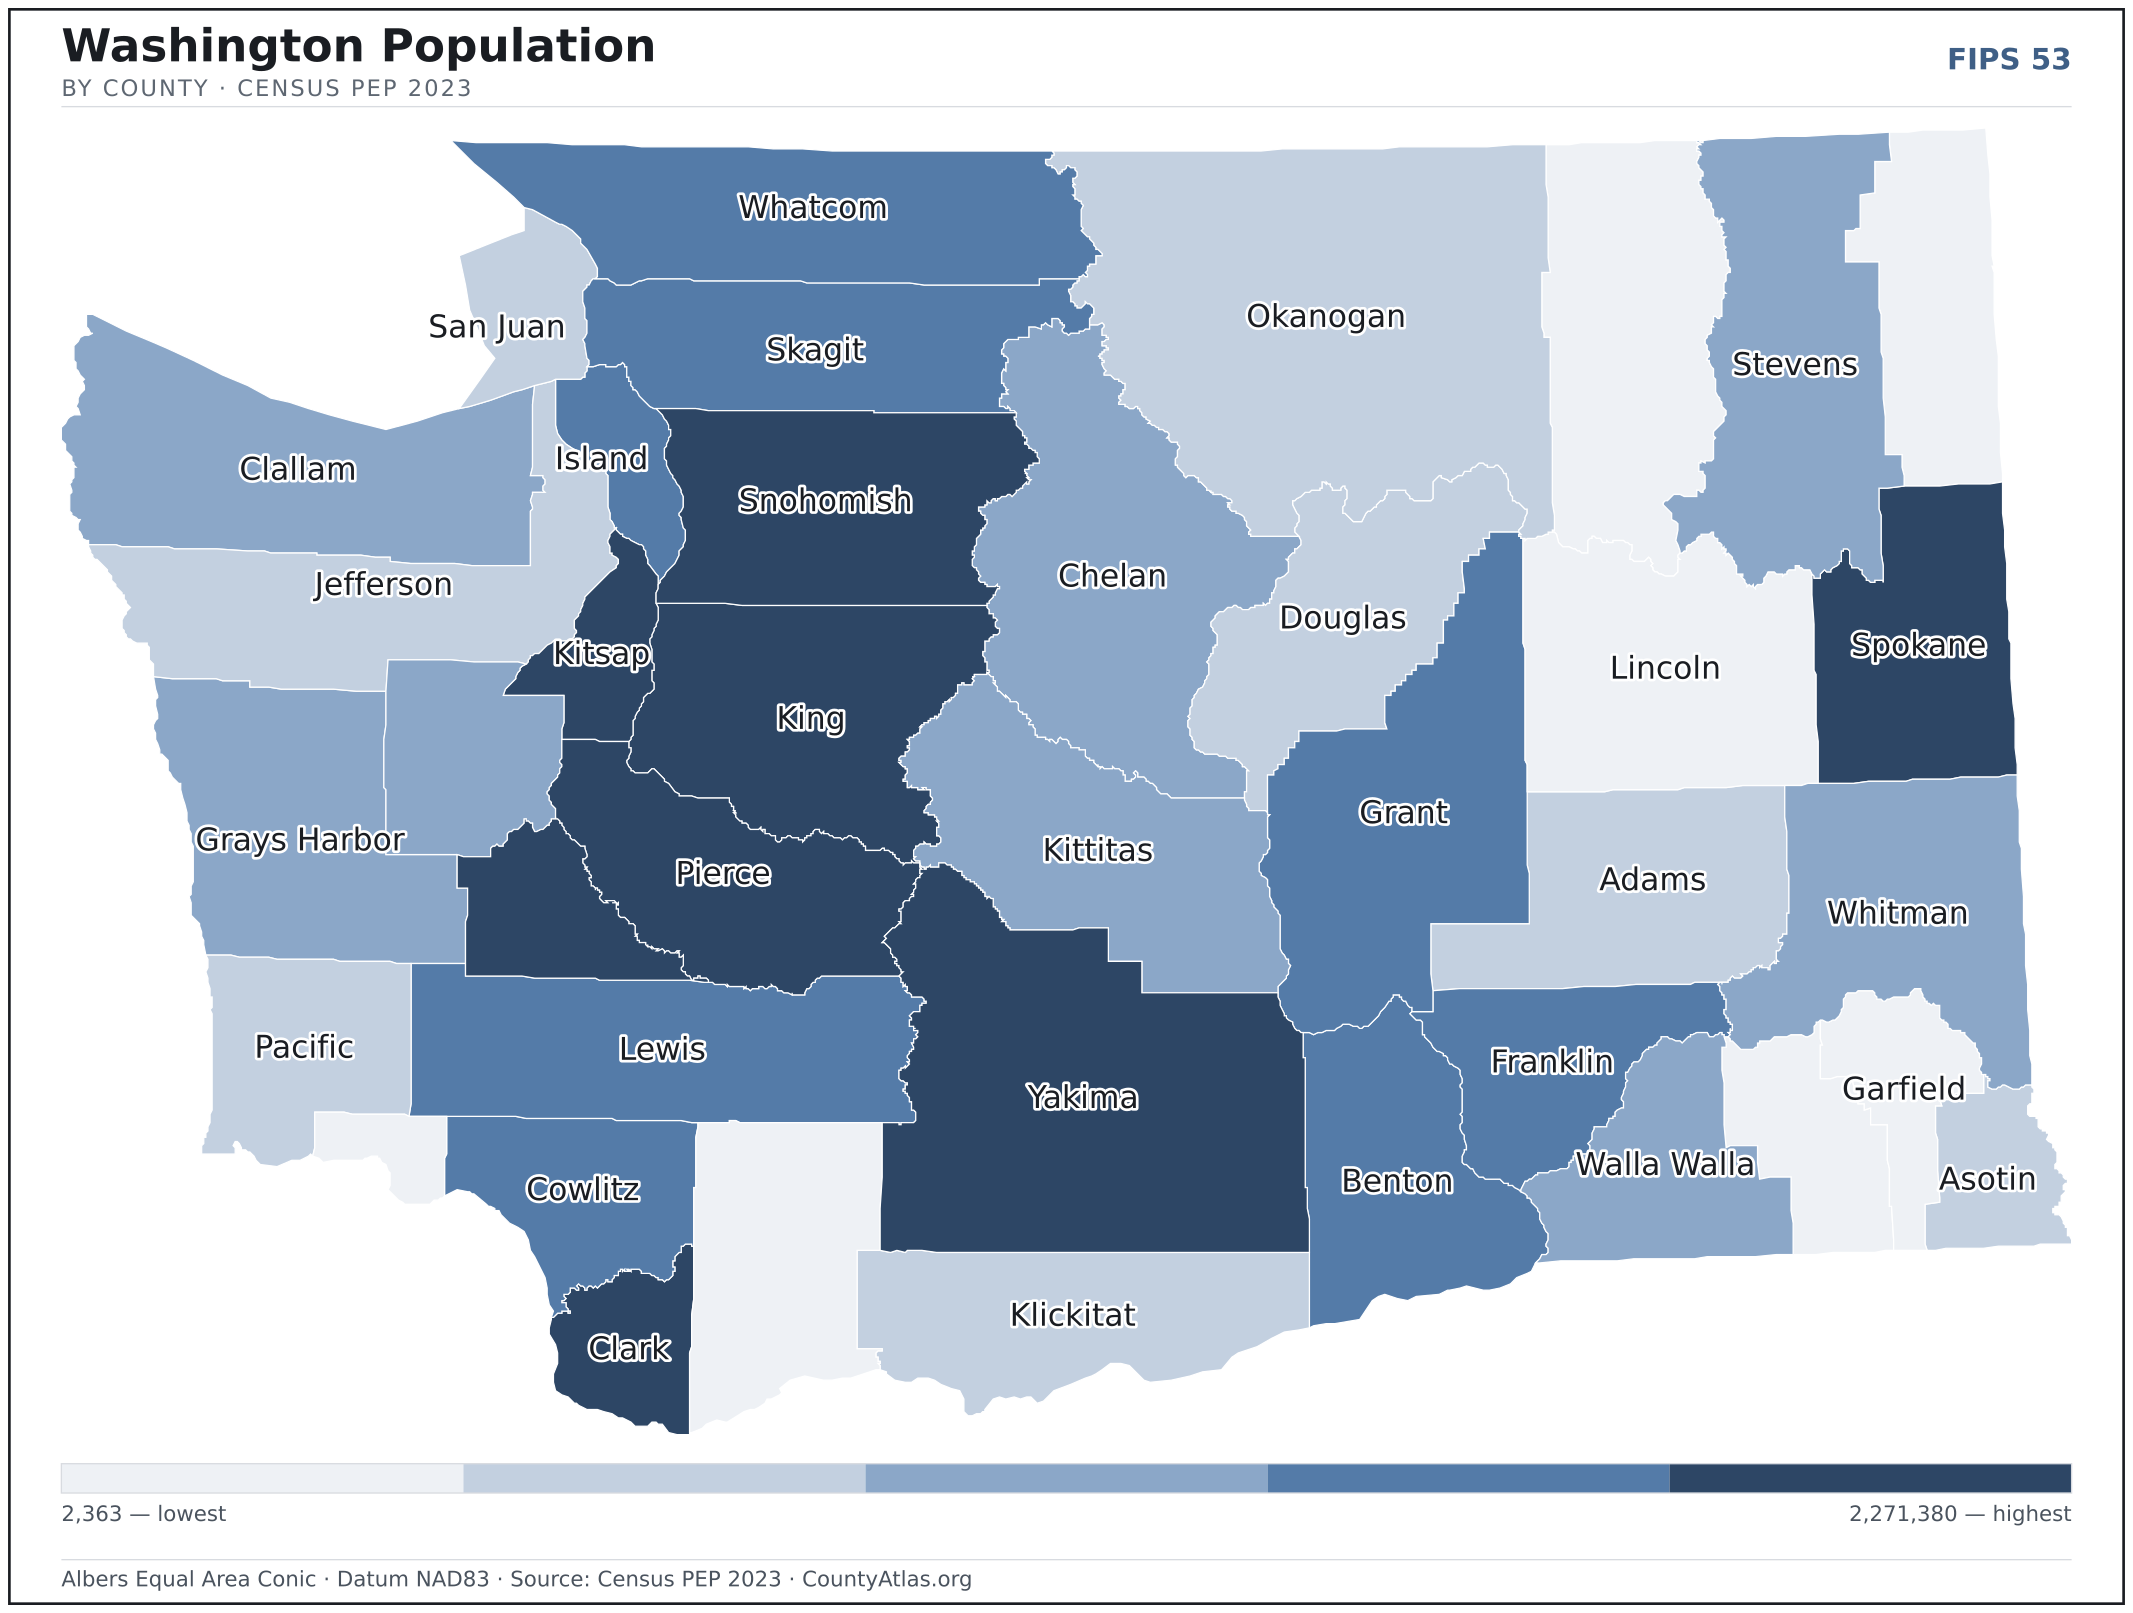
- Concentrated. Half of Washington’s 7,812,880 residents live in just 3 of 39 counties, and the five largest hold 65.5% of the total. Census PEP 2023
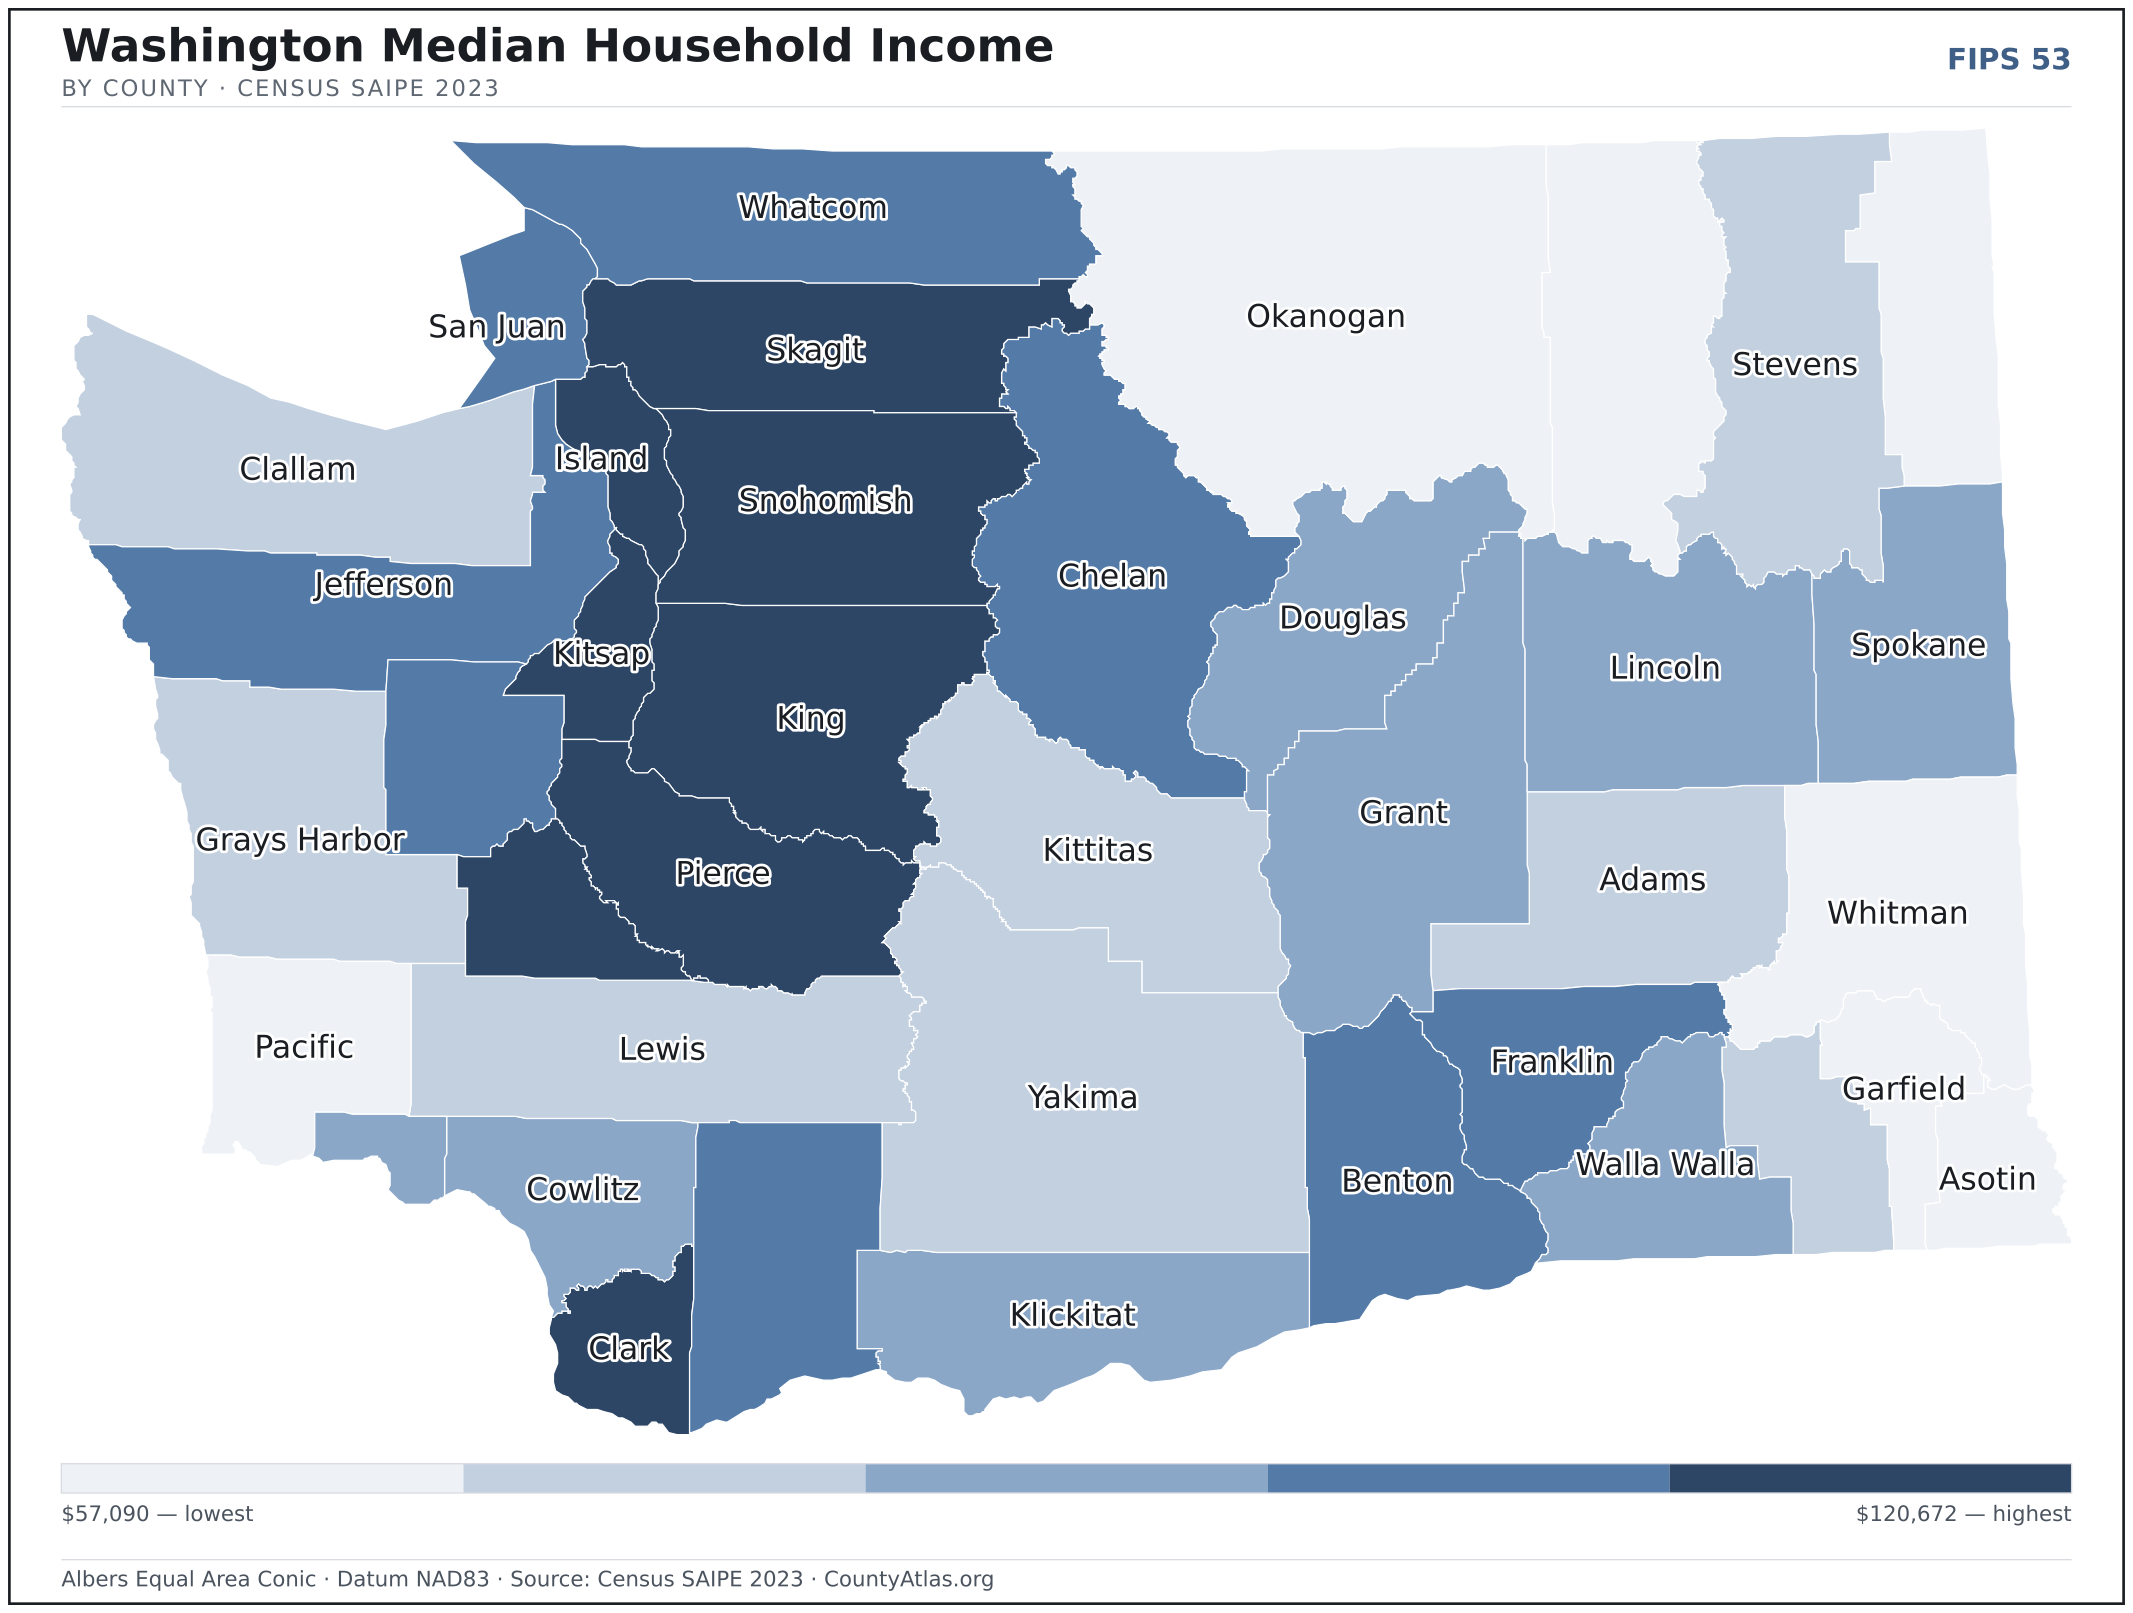
- Income tracks poverty. The gap from richest to poorest runs 2.1×, and the 10 highest-income counties average 9.2% in poverty against 15.9% for the 10 lowest. Census SAIPE 2023
- Mostly small. Half of Washington’s counties have fewer than 68,389 residents, and half report a median household income below $71,374 — a few metros lift the statewide totals well above both. Census PEP 2023 · SAIPE 2023
- Lopsided density. Only 9 of 39 counties are denser than Washington’s statewide average of 118 people per square mile — the rest are more rural. Census PEP 2023 · TIGER
| Adams County | 20,820 | $67,056 | 4.4% | 11/sq mi | 1,925 sq mi | Ritzville |
| Asotin County | 22,549 | $64,789 | 3.1% | 35/sq mi | 636 sq mi | Asotin |
| Benton County | 215,219 | $83,040 | 4.8% | 127/sq mi | 1,700 sq mi | Prosser |
| Chelan County | 79,997 | $74,848 | 4.6% | 27/sq mi | 2,921 sq mi | Wenatchee |
| Clallam County | 77,616 | $67,071 | 4.9% | 45/sq mi | 1,739 sq mi | Port Angeles |
| Clark County | 521,150 | $97,240 | 4.8% | 829/sq mi | 629 sq mi | Vancouver |
| Columbia County | 4,053 | $66,267 | 5.2% | 5/sq mi | 869 sq mi | Dayton |
| Cowlitz County | 112,864 | $71,996 | 5.5% | 99/sq mi | 1,141 sq mi | Kelso |
| Douglas County | 44,798 | $69,808 | 5.4% | 25/sq mi | 1,819 sq mi | Waterville |
| Ferry County | 7,497 | $57,090 | 6.7% | 3/sq mi | 2,203 sq mi | Republic |
| Franklin County | 99,034 | $82,542 | 5.1% | 80/sq mi | 1,242 sq mi | Pasco |
| Garfield County | 2,363 | $63,313 | 4.1% | 3/sq mi | 711 sq mi | Pomeroy |
| Grant County | 102,678 | $71,374 | 6.1% | 38/sq mi | 2,680 sq mi | Ephrata |
| Grays Harbor County | 77,290 | $65,758 | 5.8% | 41/sq mi | 1,902 sq mi | Montesano |
| Island County | 86,267 | $88,451 | 4.7% | 413/sq mi | 209 sq mi | Coupeville |
| Jefferson County | 33,714 | $77,856 | 5.0% | 19/sq mi | 1,804 sq mi | Port Townsend |
| King County | 2,271,380 | $120,672 | 4.7% | 1,074/sq mi | 2,116 sq mi | Seattle |
| Kitsap County | 277,658 | $98,894 | 4.5% | 703/sq mi | 395 sq mi | Port Orchard |
| Kittitas County | 45,508 | $66,374 | 4.9% | 20/sq mi | 2,297 sq mi | Ellensburg |
| Klickitat County | 23,589 | $69,596 | 4.7% | 13/sq mi | 1,872 sq mi | Goldendale |
| Lewis County | 86,154 | $67,877 | 6.0% | 36/sq mi | 2,403 sq mi | Chehalis |
| Lincoln County | 11,738 | $71,908 | 5.4% | 5/sq mi | 2,311 sq mi | Davenport |
| Mason County | 68,389 | $75,138 | 5.6% | 71/sq mi | 960 sq mi | Shelton |
| Okanogan County | 43,712 | $58,085 | 4.9% | 8/sq mi | 5,266 sq mi | Okanogan |
| Pacific County | 24,200 | $61,773 | 6.7% | 26/sq mi | 933 sq mi | South Bend |
| Pend Oreille County | 14,361 | $63,611 | 5.7% | 10/sq mi | 1,400 sq mi | Newport |
| Pierce County | 928,696 | $97,493 | 5.2% | 557/sq mi | 1,668 sq mi | Tacoma |
| San Juan County | 18,566 | $86,442 | 3.8% | 107/sq mi | 174 sq mi | Friday Harbor |
| Skagit County | 131,417 | $90,432 | 5.0% | 76/sq mi | 1,730 sq mi | Mount Vernon |
| Skamania County | 12,640 | $85,131 | 4.5% | 8/sq mi | 1,658 sq mi | Stevenson |
| Snohomish County | 844,761 | $106,067 | 4.9% | 405/sq mi | 2,087 sq mi | Everett |
| Spokane County | 551,455 | $73,380 | 4.2% | 313/sq mi | 1,764 sq mi | Spokane |
| Stevens County | 48,837 | $67,525 | 5.2% | 20/sq mi | 2,477 sq mi | Colville |
| Thurston County | 299,003 | $92,357 | 4.5% | 414/sq mi | 723 sq mi | Olympia |
| Wahkiakum County | 4,765 | $69,726 | 7.8% | 18/sq mi | 263 sq mi | Cathlamet |
| Walla Walla County | 61,568 | $71,348 | 4.1% | 48/sq mi | 1,270 sq mi | Walla Walla |
| Whatcom County | 231,919 | $75,920 | 4.5% | 110/sq mi | 2,108 sq mi | Bellingham |
| Whitman County | 48,012 | $59,044 | 3.7% | 22/sq mi | 2,159 sq mi | Colfax |
| Yakima County | 256,643 | $67,112 | 5.9% | 60/sq mi | 4,295 sq mi | Yakima |
All 39 counties, sortable by any column — click a heading. A suppressed estimate (coefficient of variation ≥ 0.30) shows a marker, never a guess. County seats are from Wikidata (CC0), each validated to a Census place inside its county; a county with no validated seat is left blank. See the methodology.
Download & print this Washington map
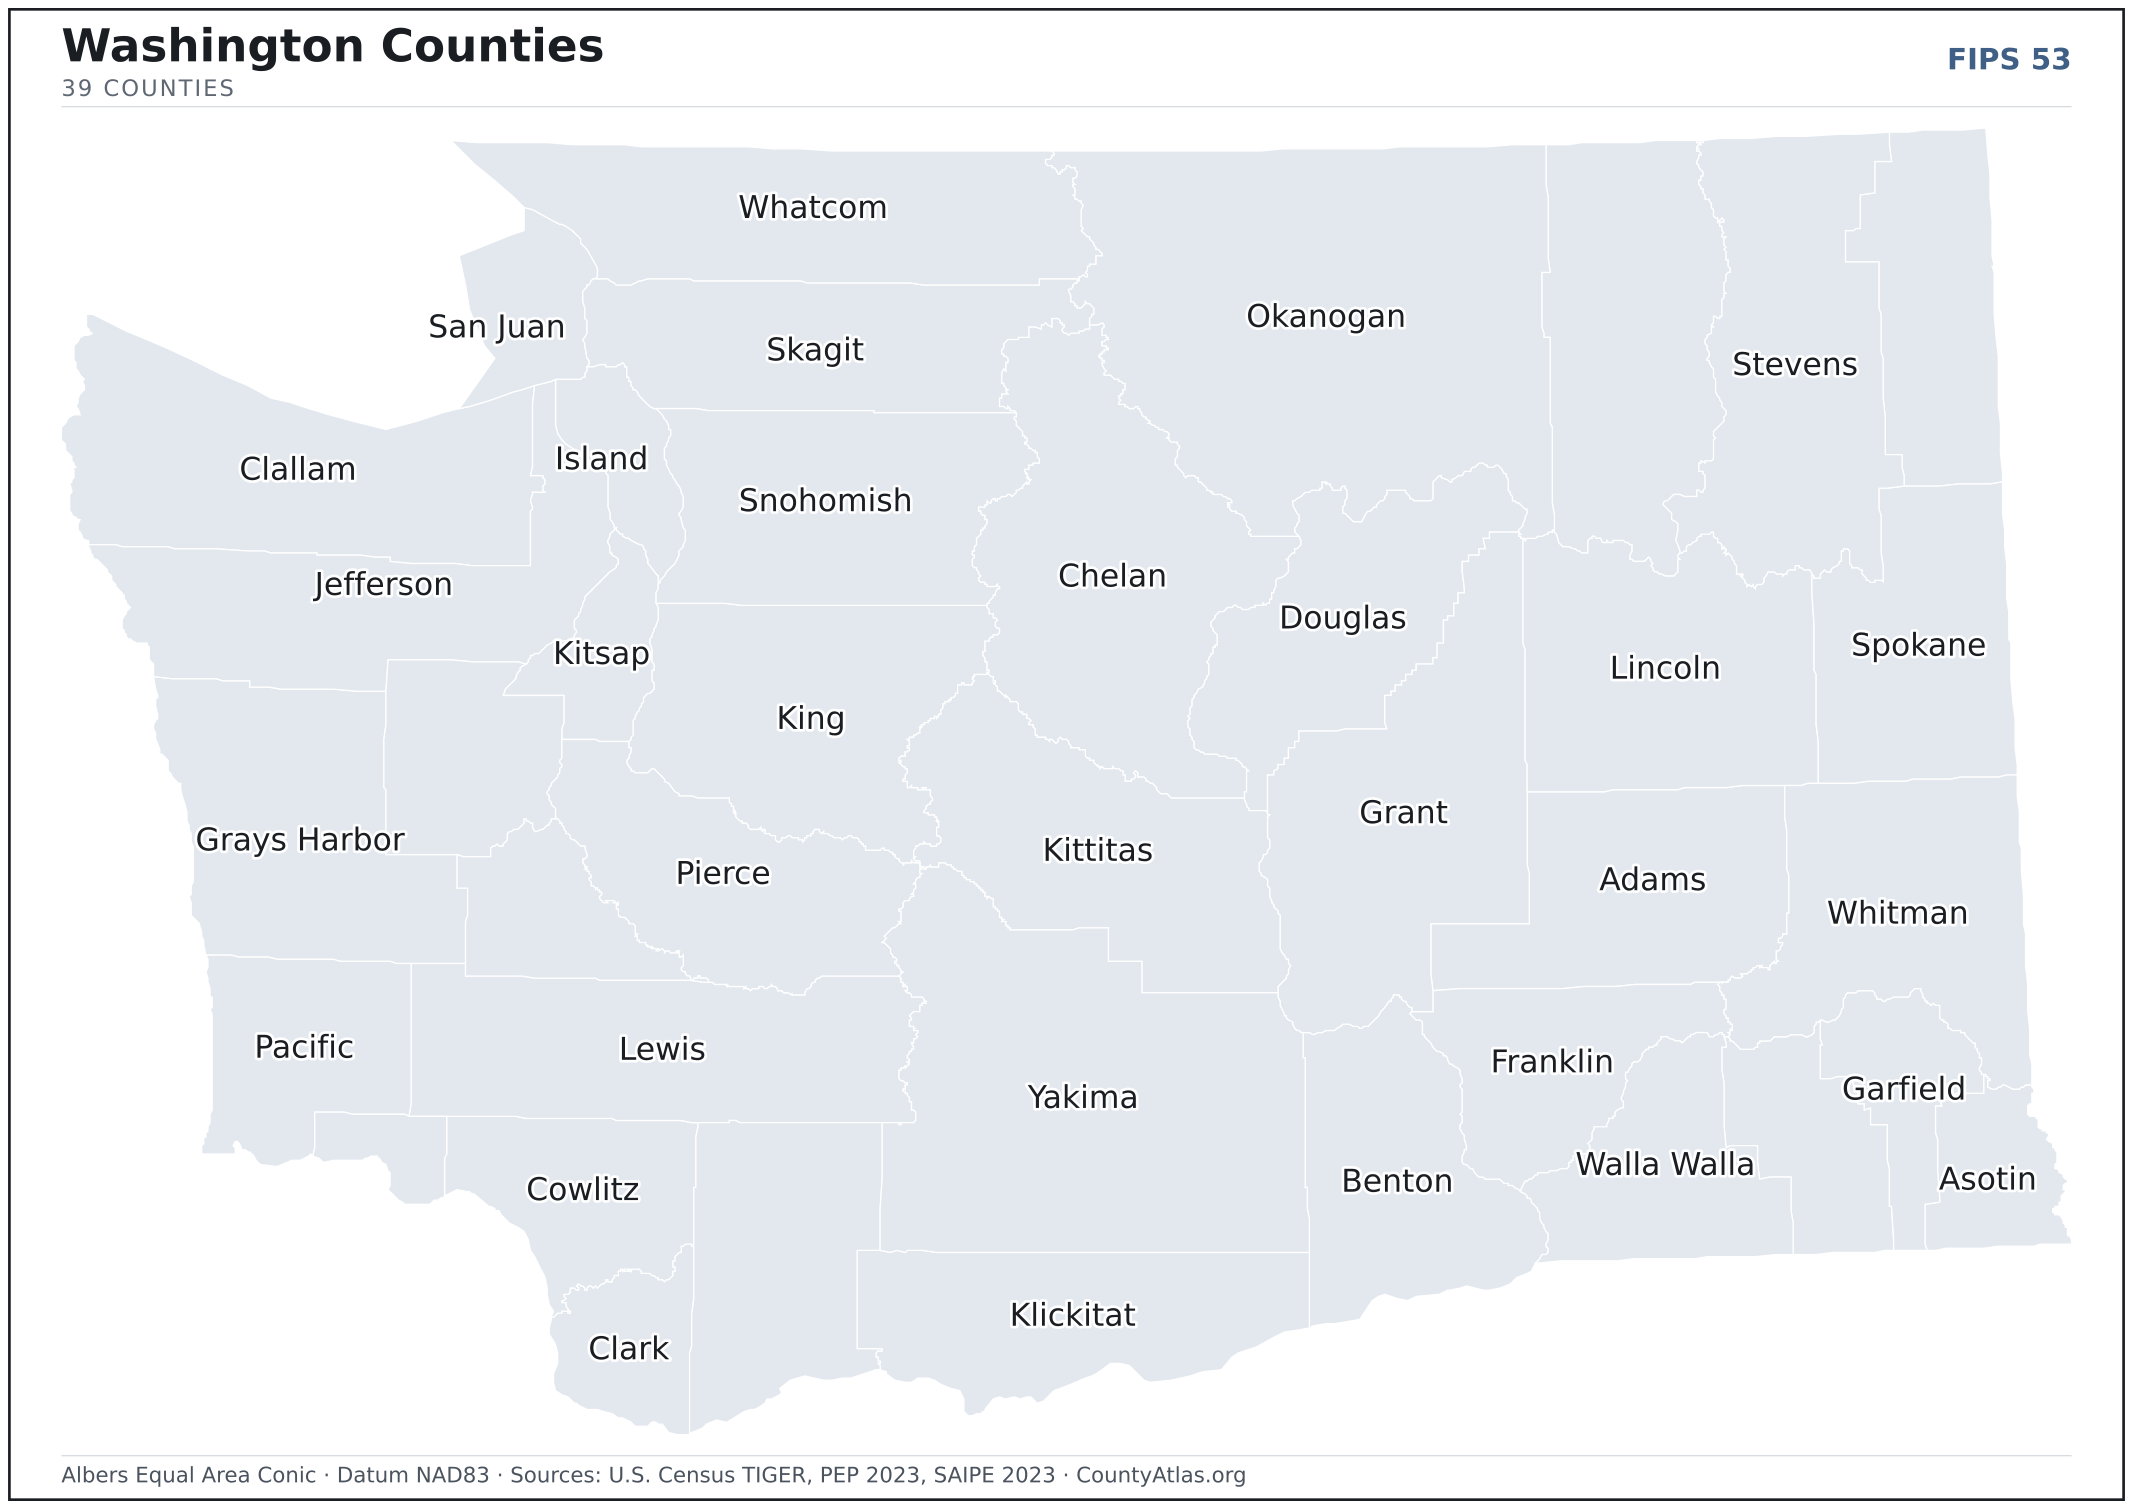
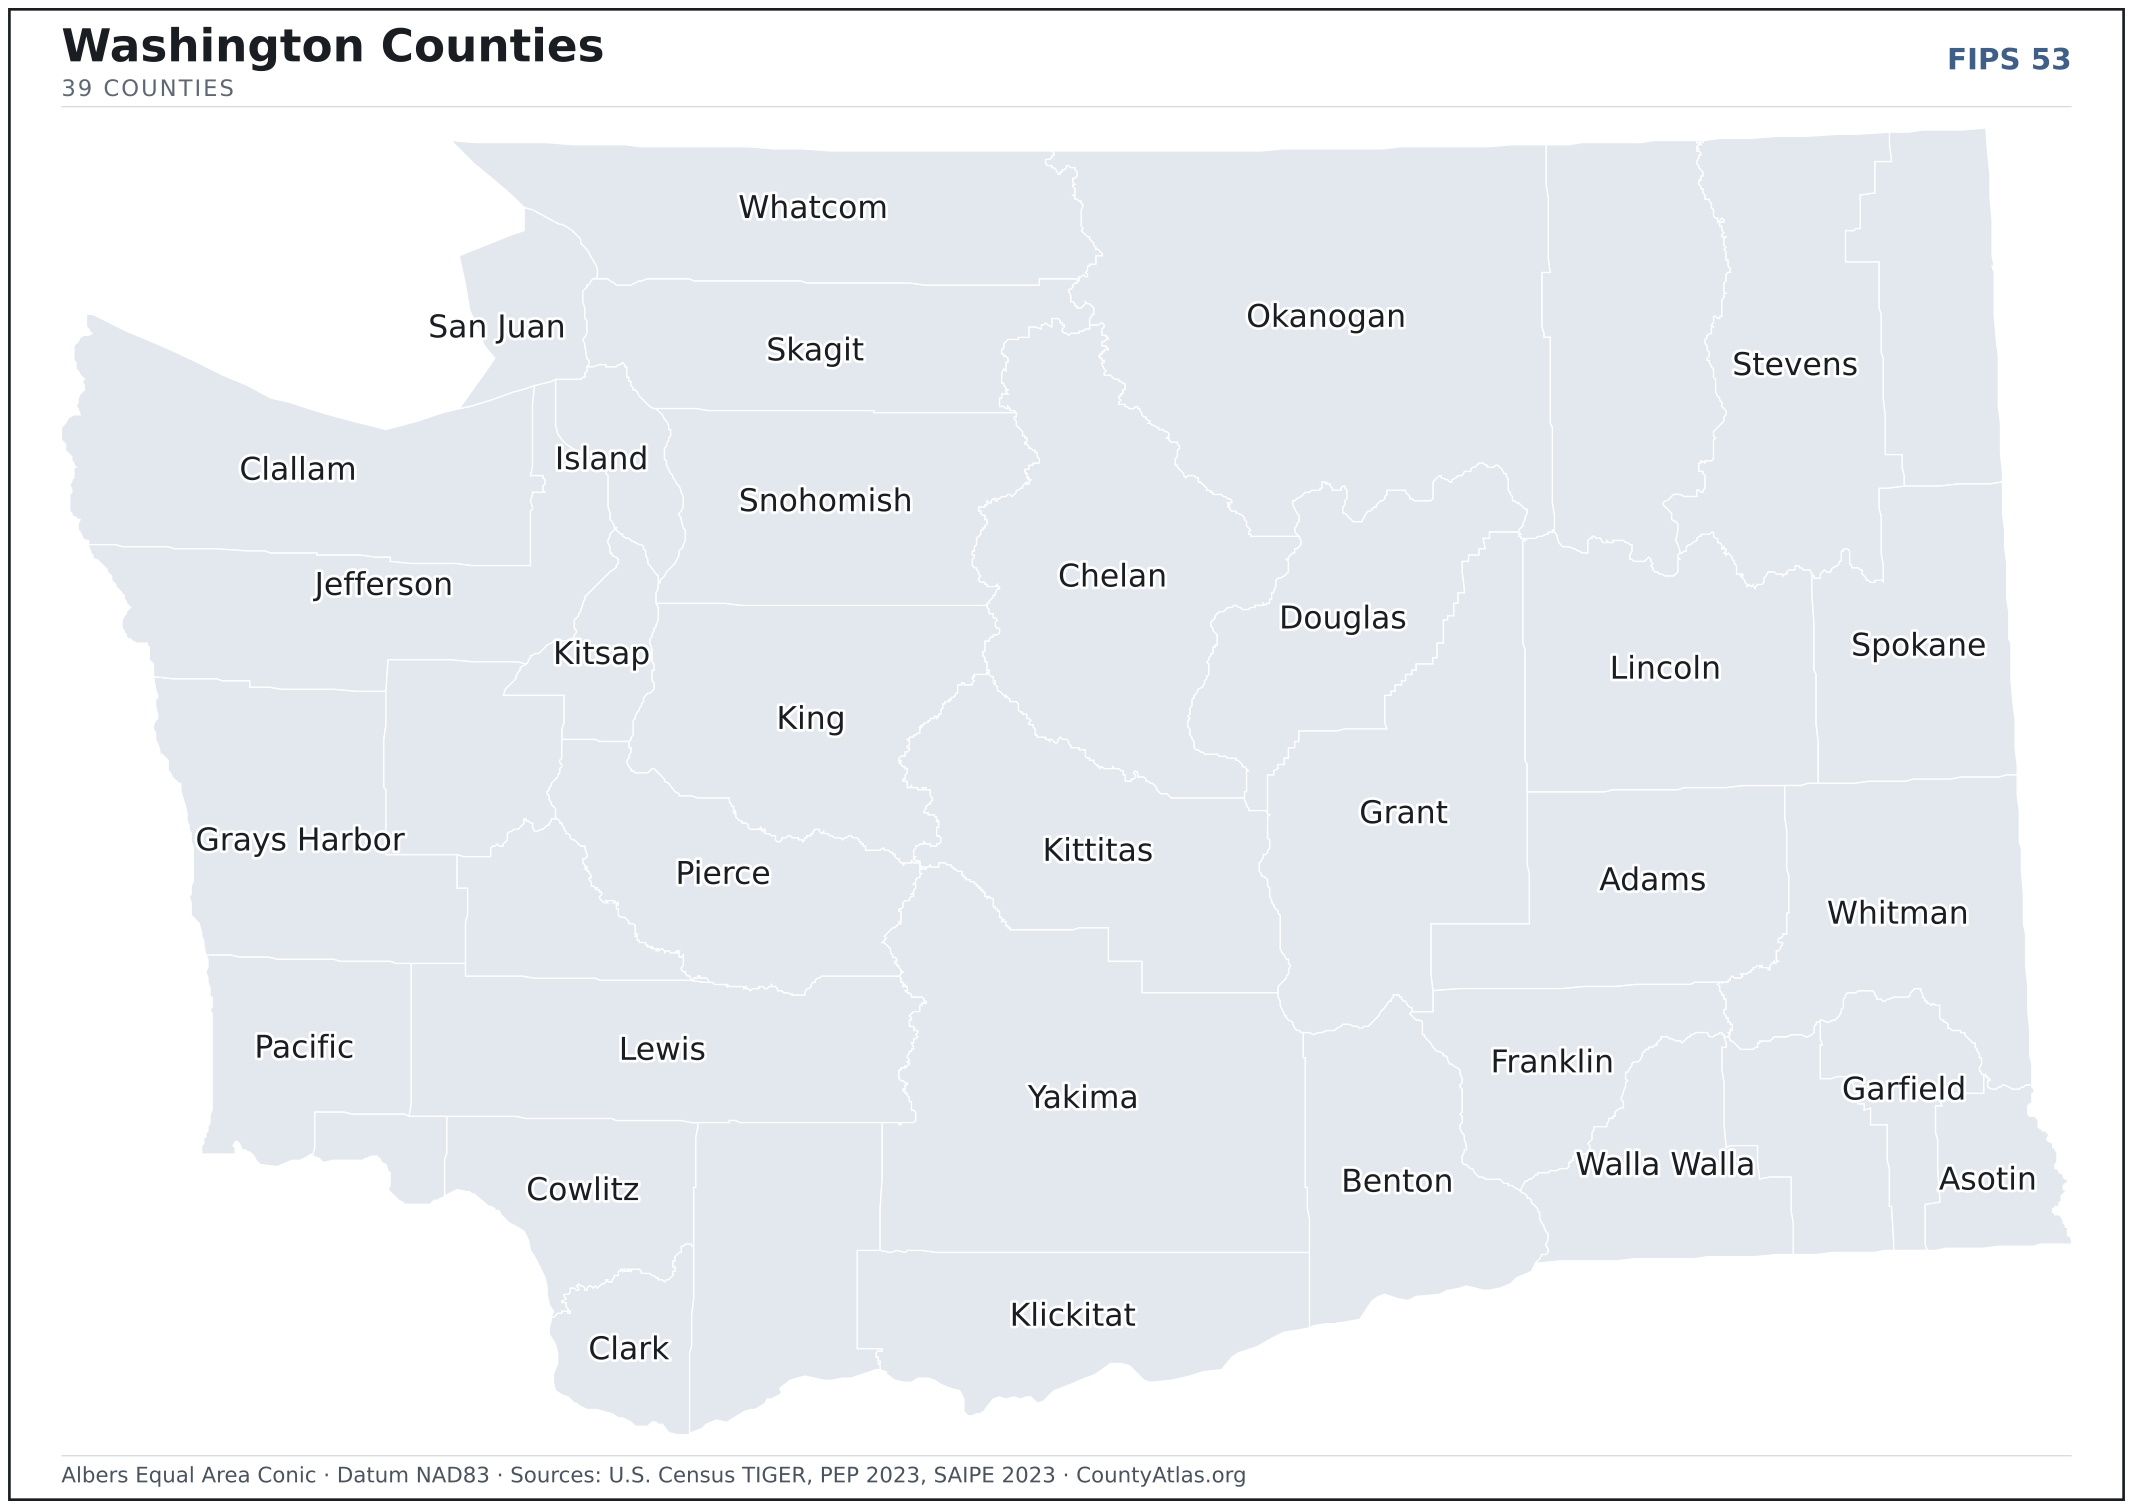
Washington maps, coloured by the data
Cities in Washington
Washington has 281 incorporated cities and towns. The largest is Seattle in King County with 741,440 residents. Use the search on the map above to find any city and highlight the county it sits in.
| Seattle | King County | 741,440 |
| Spokane | Spokane County | 229,228 |
| Tacoma | Pierce County | 220,482 |
| Vancouver | Clark County | 192,696 |
| Bellevue | King County | 151,199 |
| Kent | King County | 135,015 |
| Everett | Snohomish County | 111,083 |
| Spokane Valley | Spokane County | 105,460 |
| Renton | King County | 105,279 |
| Federal Way | King County | 99,232 |
| Yakima | Yakima County | 96,810 |
| Bellingham | Whatcom County | 92,367 |
| Kirkland | King County | 91,614 |
| Auburn | King County | 85,455 |
| Kennewick | Benton County | 84,389 |
| Pasco | Franklin County | 78,446 |
| Redmond | King County | 75,721 |
| Marysville | Snohomish County | 71,570 |
| Sammamish | King County | 66,375 |
| Lakewood | Pierce County | 63,034 |
| Richland | Benton County | 61,912 |
| Shoreline | King County | 59,280 |
| Lacey | Thurston County | 57,088 |
| Olympia | Thurston County | 55,583 |
| Burien | King County | 51,331 |
| Bothell | King County | 48,610 |
| Bremerton | Kitsap County | 44,531 |
| Edmonds | Snohomish County | 42,783 |
| Puyallup | Pierce County | 42,642 |
| Lynnwood | Snohomish County | 40,953 |
| Lake Stevens | Snohomish County | 39,500 |
| Issaquah | King County | 39,472 |
| Longview | Cowlitz County | 37,836 |
| Wenatchee | Chelan County | 35,502 |
| Mount Vernon | Skagit County | 35,312 |
| University Place | Pierce County | 34,850 |
| Walla Walla | Walla Walla County | 33,766 |
| Des Moines | King County | 32,545 |
| Pullman | Whitman County | 31,939 |
| SeaTac | King County | 31,143 |
| Maple Valley | King County | 28,121 |
| Camas | Clark County | 26,779 |
| Tumwater | Thurston County | 26,519 |
| Moses Lake | Grant County | 25,594 |
| Mercer Island | King County | 25,282 |
| Bainbridge Island | Kitsap County | 24,607 |
| Oak Harbor | Island County | 24,396 |
| Kenmore | King County | 23,594 |
| Bonney Lake | Pierce County | 22,776 |
| Tukwila | King County | 21,479 |
Showing the 50 most populous — and 231 more. Search the map above for any Washington city or village.
A city can span more than one county; each is listed in its primary county — the one its center falls in.
Which Washington county is the richest, largest, most crowded? The answers
- Washington’s highest median household income is in King County ($120,672); the lowest is in Ferry County ($57,090). Census SAIPE 2023
- Washington’s most populous county is King County (2,271,380); the least populous is Garfield County (2,363) — a 961× spread. Census PEP 2023
- Washington’s largest county by land area is Okanogan County (5,266 sq mi); the smallest is San Juan County (174 sq mi). Census TIGER
- Washington’s highest population density is in King County (1,074/sq mi); the lowest is in Garfield County (3/sq mi). Census PEP 2023 · TIGER
- Washington’s highest poverty rate is in Whitman County (24.8%); the lowest is in Clark County (7.5%). Census SAIPE 2023
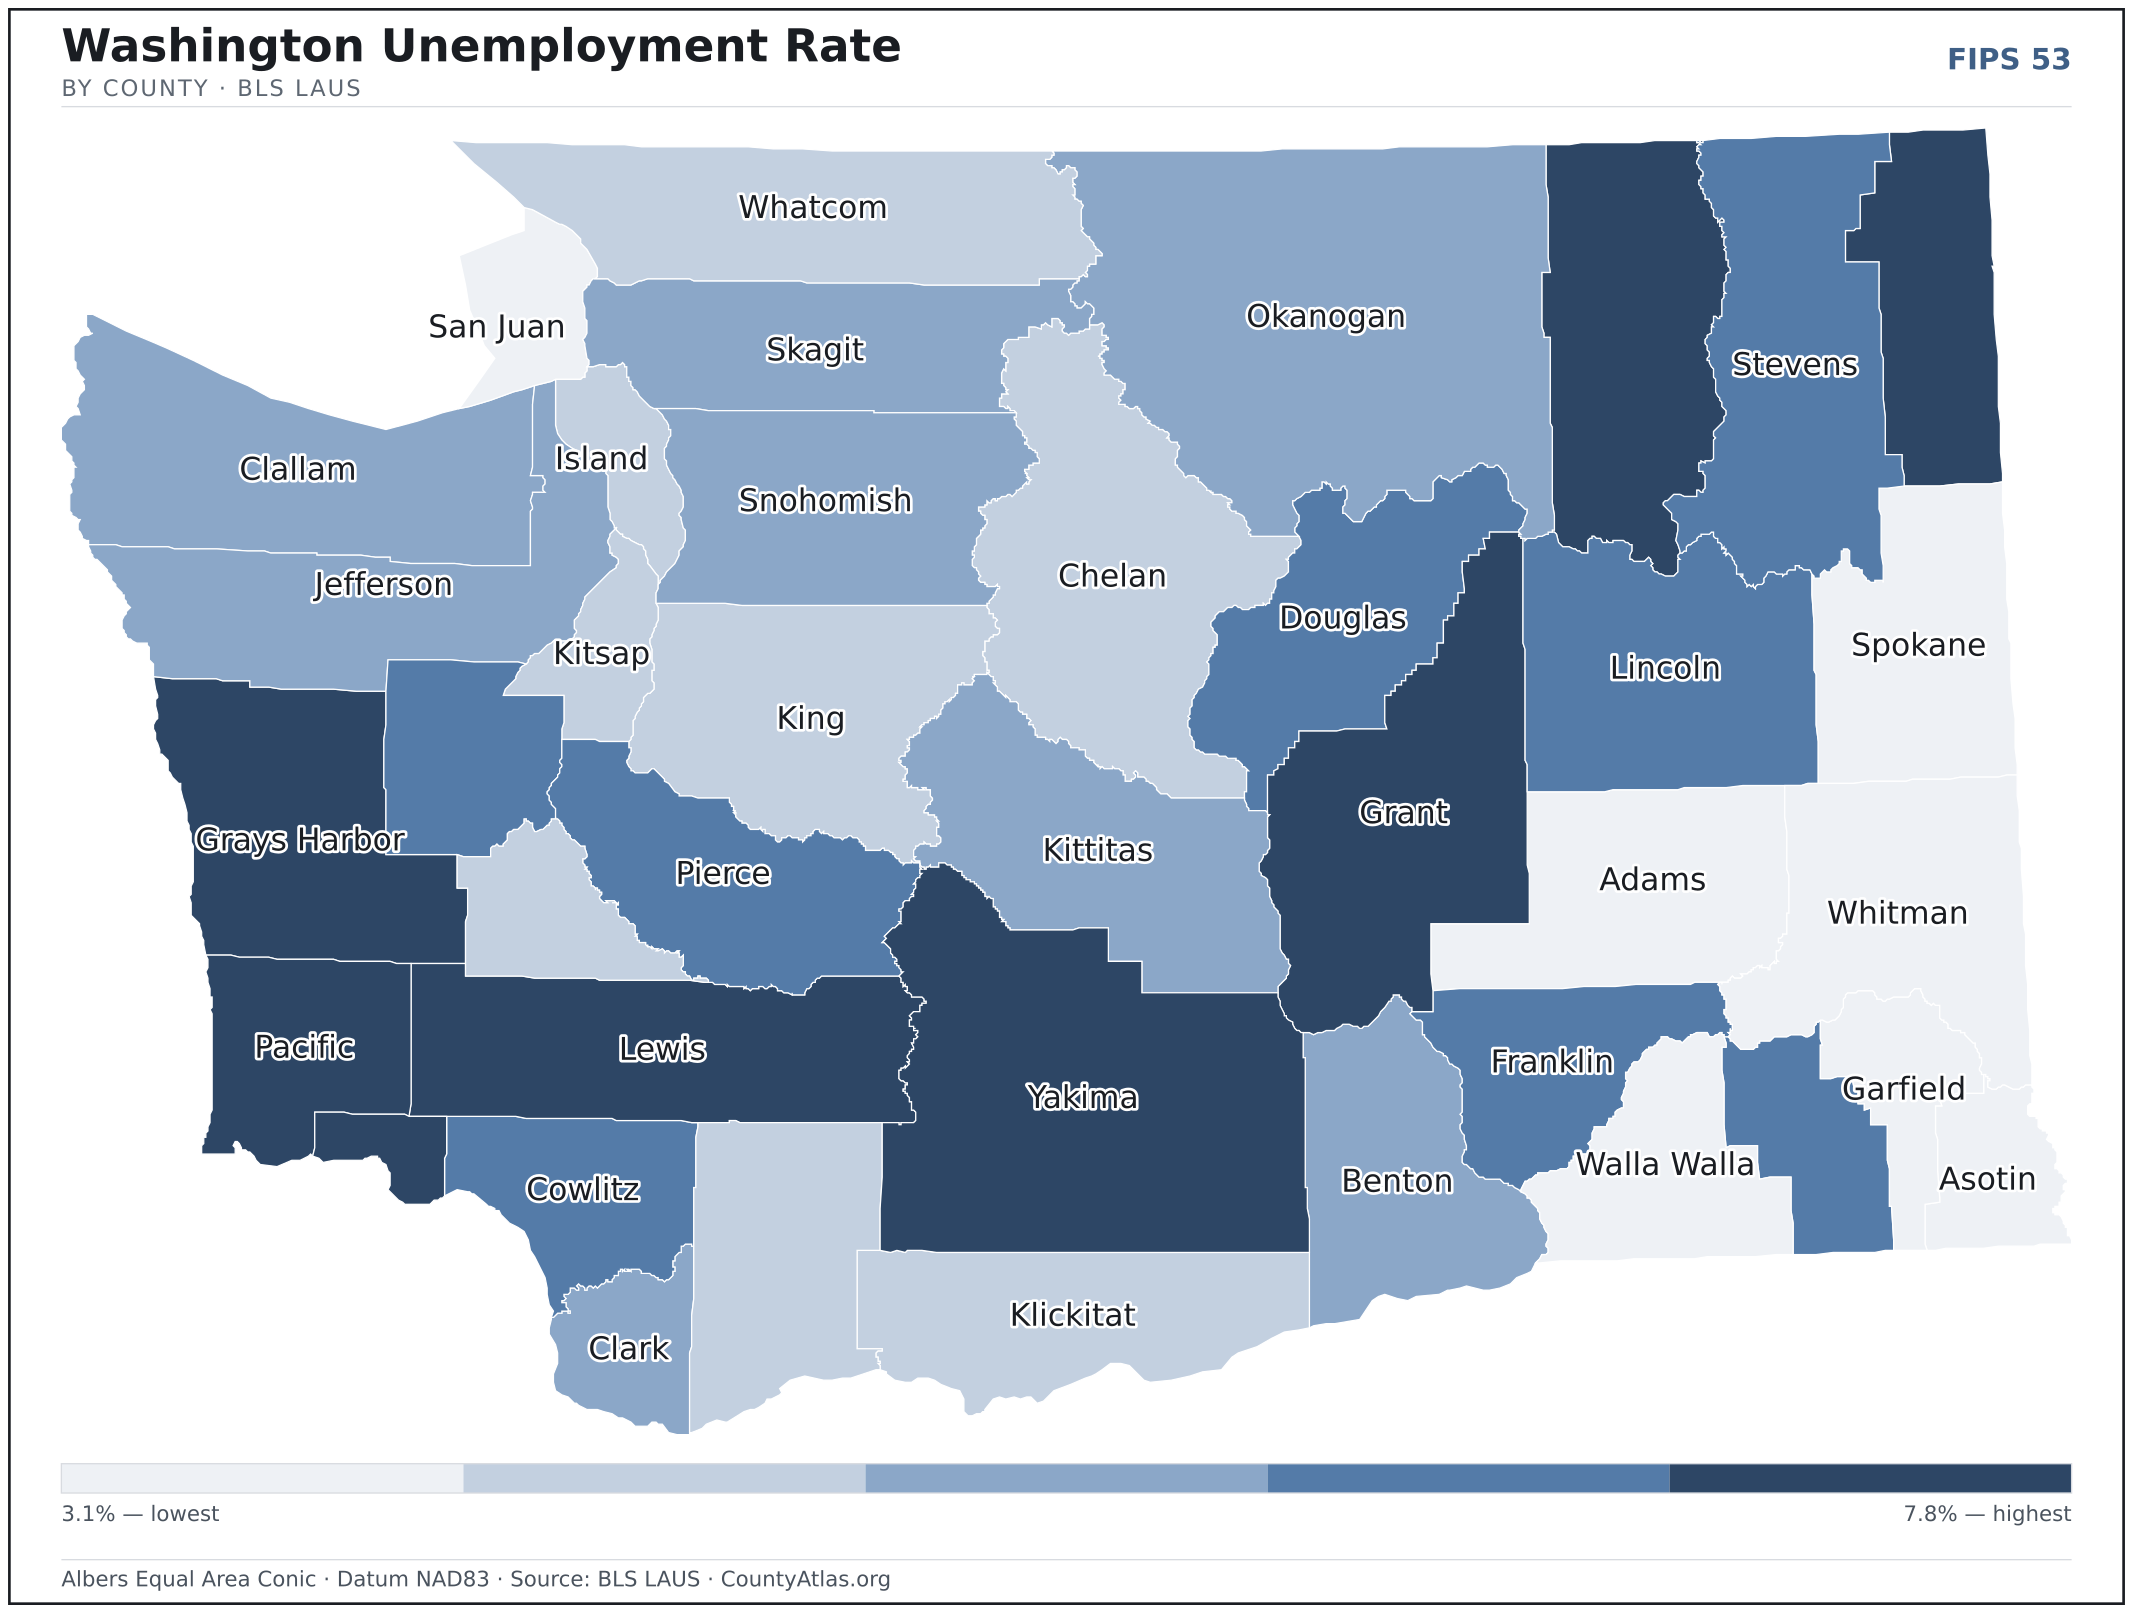
- In Washington, unemployment is highest in Wahkiakum County (7.8%) and lowest in Asotin County (3.1%), for May 2026. BLS LAUS
- Washington’s highest median age is in Jefferson County (59.5); the lowest is in Whitman County (26.1). Census ACS 2019–2023
- Washington’s highest share of bachelor’s degrees is in King County (55.9% of adults); the lowest is in Adams County (15.4%). Census ACS 2019–2023
Every figure is a current official estimate from the source named — not a crowd-sourced or copied value. Suppressed estimates (coefficient of variation ≥ 0.30) are omitted, never guessed. See the full methodology.
Washington counties: common questions
How many counties are in Washington?
Washington has 39 counties covering 66,457 sq mi and about 7.8M residents. Every one is on the map above and in the table below.
What is the largest county in Washington?
It depends on the measure. By land area it’s Okanogan County (5,266 sq mi); by population it’s King County (2,271,380 residents).
What county is Seattle in?
Seattle (population 741,440) is in King County. Use the search on the map to find any Washington city’s county.
What is the richest county in Washington?
By median household income, King County is the richest at $120,672; the poorest is Ferry County at $57,090 (Census SAIPE 2023).
What is the most populous county in Washington?
King County, with 2,271,380 residents — about 29.1% of Washington’s people, and 961× the least populous, Garfield County (2,363).
Sources & vintages
- Population — PEP Vintage 2023 (July 1, 2023) — pep/charv
- Median household income & poverty — SAIPE 2023
- Unemployment — BLS LAUS May 2026 (preliminary)
- Geometry & boundaries — Census TIGERweb
- Cities & city population — Census TIGERweb Incorporated Places + ACS 5-year 2019–2023
Data current through .